Abstract
The purpose of this study was to validate the dose prescription defined to the gross tumor volume (GTV) 3D and 4D dose distributions of stereotactic radiotherapy for lung cancer. Treatment plans for 94 patients were generated based on computed tomography (CT) under free breathing. A uniform margin of 8 mm was added to the internal target volume (ITV) to generate the planning target volume (PTV). A leaf margin of 2 mm was added to the PTV. The prescription dose was defined such that 99% of the GTV should receive 100% of the dose using the Monte Carlo calculation (iPlan RT DoseTM) for 6-MV photon beams. The 3D dose distribution was determined using CT under free breathing. The 4D dose distribution plan was recalculated to investigate the effect of tumor motion using the same monitor units as those used for the 3D dose distribution plan. D99 (99% of the GTV) in the 4D plan was defined as the average D99 in each of the four breathing phases (0%, 25%, 50% and 75%). The dose difference between maximum and minimum at D99 of the GTV in 4D calculations was 0.6 ± 1.0% (range 0.2–4.6%). The average D99 of the GTV from 4D calculations in most patients was almost 100% (99.8 ± 1.0%). No significant difference was found in dose to the GTV between 3D and 4D dose calculations (P = 0.67). This study supports the clinical acceptability of treatment planning based on the dose prescription defined to the GTV.
Keywords: four-dimensional computed tomography, gross tumor volume, Monte Carlo calculation, stereotactic body radiotherapy, lung cancer
INTRODUCTION
Stereotactic body radiotherapy (SBRT) for non-surgical treatment of early-stage primary lung cancer has recently been investigated in clinical practice, during which several problems regarding lung cancer treatment planning have been identified [1–5].
First, intrafractional tumor motion is significantly changed by respiratory motion. The development of 4D-computed tomography (CT) has made it possible to visualize breathing-induced tumor motion, shape and volume during a respiratory cycle. Respiration-induced tumor motion may result in considerable differences between the planned and actually delivered dose. Second, inhomogeneous corrections are reported to lead to larger dose differences for lung cancer patients [5]. Aarup et al. reported that dose differences to the target obtained using the Monte Carlo (MC) calculation and treatment planning systems using Pencil Beam calculation were influenced by lung density (0.4 to 0.1 g cm−3) [6]. The third problem relates to dose prescription. The International Commission on Radiation Units and Measurements (ICRU) recommended the use of dose volume instead of point dose at the reference point [7]. Dose calculation to the planning target volume (PTV) is complicated, however, because it can be affected by low lung density. If the dose prescription is defined at the PTV, monitor units should be adjusted to allow sufficient PTV coverage.
On this basis, we defined that 99% of the gross tumor volume (GTV) should be covered by 100% of the prescribed dose (D99 = 100%) using the MC calculation. However, the dose should be calculated with confirmation that the dose prescription is defined to the GTV with tumor motion. The purpose of this study was to validate the dose prescription defined to the gross tumor volume (GTV) 3D and 4D dose distributions.
MATERIALS AND METHODS
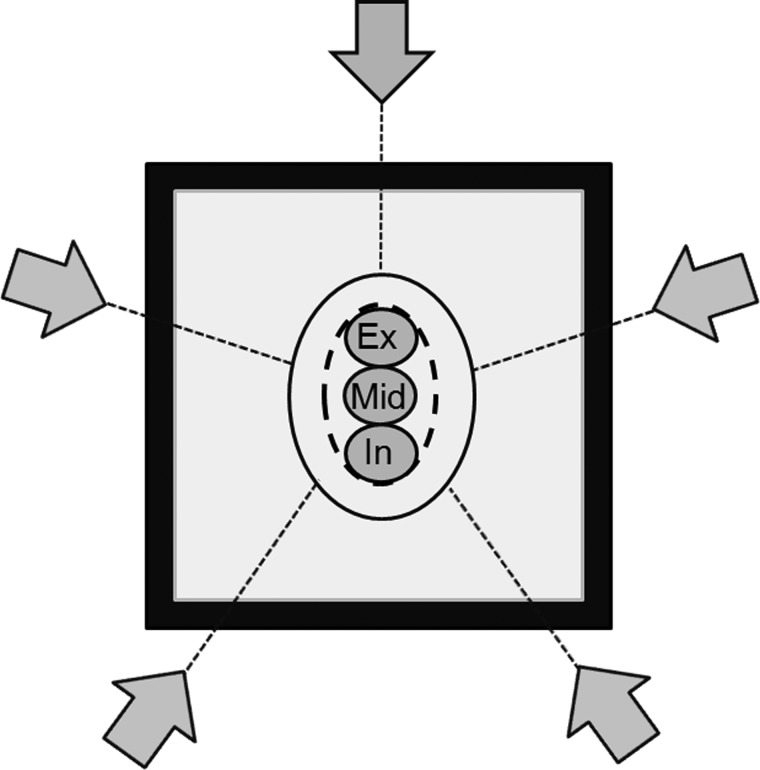
Figure 1 shows the basic virtual phantom, which has a simulated GTV of 10 mm diameter with an equivalent water density of 1.0 g cm−3. The density of the equivalent lung surrounding the GTV was defined as 0.25 g cm−3. The selected GTV sizes were intended to represent the average target dimensions in lung cancer SBRT. The influence of GTV motion was investigated with motion amplitudes of 5, 10 and 20 mm. These amplitudes yielded the size of the internal target volume (ITV). The PTV was generated by adding a uniform margin of 8 mm to the ITV to account for setup uncertainties and mechanical inaccuracy. The treatment fields were conformed around the PTV. A leaf margin of 2 mm was added to the PTV, and the isocenter was positioned in the center of the PTV. The plan was calculated using the MC calculation in an iplan RT Dose, ver 4.1.2 (BrainLAB, Germany) treatment planning system. Beam energy for all plans were 6-MV photon beams, and gantry angles were 0°, 72°, 144°, 216° and 288°, which is consistent with simple SBRT treatment planning.
Fig. 1.
Schematic overview of the foundation model with center of the mid-expiration GTV (Mid), 10 mm relative to the end-expiration GTV (Ex), and end-inspiration GTV (In) surrounded by lung-equivalent material (grey) and a 20 mm wall of water-equivalent material (black). ITV (black dashed line) is the sum of all GTV phases. Margin to the PTV (black solid line) was 8.0 mm in all directions. The grey arrows indicate the directions of the five beams.
Dose prescription was defined as D99 = 100% of the GTV at mid-expiration phase (mid-GTV). Delivered dose to the GTV with movement was validated using the end-expiration (ex-GTV) and end-inspiration (in-GTV) phases. The reference images were changed to evaluate the effect of movement of the GTV on dose distribution. All planning parameters (beam arrangement, leaf positions, isocenter position and monitor unit) remained unchanged. The MC calculation was performed using the full MLC geometry simulation ‘Accuracy Optimized Model’ with a spatial resolution of 2 mm and variance of 2%. Target coverage was evaluated in each breathing phase as dose to 99% of the volume of the GTV, determined as a dose volume histogram (DVH). D99 was used to represent minimal dose coverage. Delivered dose was defined as a given dose to the GTV, which was assigned a density of 1.0 g cm−3 in the breathing phase. Setup uncertainties were negligible.
A total of 94 patients treated with SBRT between October 2010 and October 2011 were included in this analysis. Patient characteristics are shown in Table 1. As a routine procedure for the planning of stereotactic radiotherapy, 3D-CT (General Electric Company, 4-slice Brightspeed QX/i scanner) was used to acquire a whole lung image series under free breathing using a system developed in-house to suppress tumor motion, the ‘Air-bag System’ [8]. The Air-bag System consists of a non-elastic air bag connected to a second smaller elastic air bag. The first air-bag is placed between the patient's body surface and a HipFix device (CIVCO, USA) and secured by a pressure adjustment via the elastic air-bag. 4D-CT was performed to more accurately determine tumor shape, volume and position at different phases of the breathing cycle. The CT images had a slice thickness of 2.5 mm with a gantry rotation time of 1.0 s. Each image was tagged with the corresponding phase of the respiratory cycle and then sent to the Advantage Workstation (General Electric Company, Waukesha, WI) using Advantage 4D-CT software. The 4D datasets were categorized into four phases of the respiratory cycle (0%, 25%, 50% and 75%), with 0% representing maximum inspiration. Image quality of the 4D-CT was sufficient for tumor evaluation in all patients. The visible tumor was delineated as the GTV in the CT pulmonary window of the 4D-CT images. The 3D tumor motion vector, which was individually measured in each direction, was calculated as follows:
where X was the lateral, Y was the anterior-posterior and Z was the cranio-caudal direction. The coordinate was placed at the center of the GTV in each breathing phase. Dose calculation for treatment planning was performed using 3D-CT images. Dose prescription was conformed to 99% of the GTV, as in the phantom study. Maximum dose within the PTV was less than 115% of the prescription dose. The number of beams was from five to eight with non-coplanar arrangements.
Table 1.
Patient characteristics
| Patients (n) | 94 |
| Gender | |
| Male (n) | 53 (56%) |
| Female (n) | 41 (44%) |
| Age (years) | 72 (34–89) |
| Gross tumor volume (cm3) | 8.9 (0.3–77.5) |
| Planning target volume (cm3) | 52.0 (9.7–232.3) |
| Target location (lobe) | |
| Upper and middle (n) | 46 (48%) |
| Lower (n) | 48 (52%) |
All planning parameters on the reference plan of the 3D-CT images were copied to the four breathing phase 4D-CT images to recalculate the dose, which was influenced by breathing. D99 of the delivered dose to the GTV in the 4D plan in this study was defined as the average of each D99 for the four breathing phases. The 3D and 4D calculations were compared using the Student paired t-test, and tumor motion in the upper and lower locations were compared using the Student unpaired t-test. P-values <0.05 were considered statistically significant. The analyzed data were displayed as mean ± standard deviation with ranges in parentheses among 94 clinical plans.
RESULTS
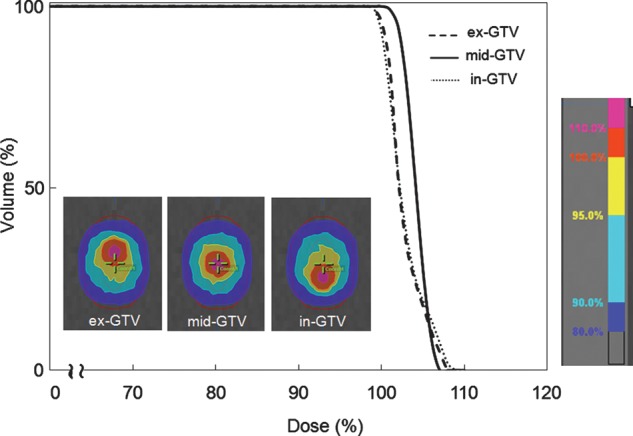
Figure 2 shows the dose distribution and dose-volume histogram (DVH) of the delivered dose to the ex-GTV, mid-GTV and in-GTV, calculated at the amplitude of 10 mm. Movement of the dose distributions was synchronized with tumor motion. Dose to the GTV was decreased close to the edge with the ITV. Dose distribution showed that the GTV received similar doses at the three breathing phases. The average D99 of delivered dose to the GTV with motion amplitudes of 5, 10 and 20 mm was 99.2%, 99.0% and 98.5%, respectively.
Fig. 2.

Dose distribution and dose volume histogram were calculated at the amplitude of 10 mm, showing the delivered doses to ex-GTV (black dashed line), mid-GTV (black solid line) and in-GTV (grey dotted line).
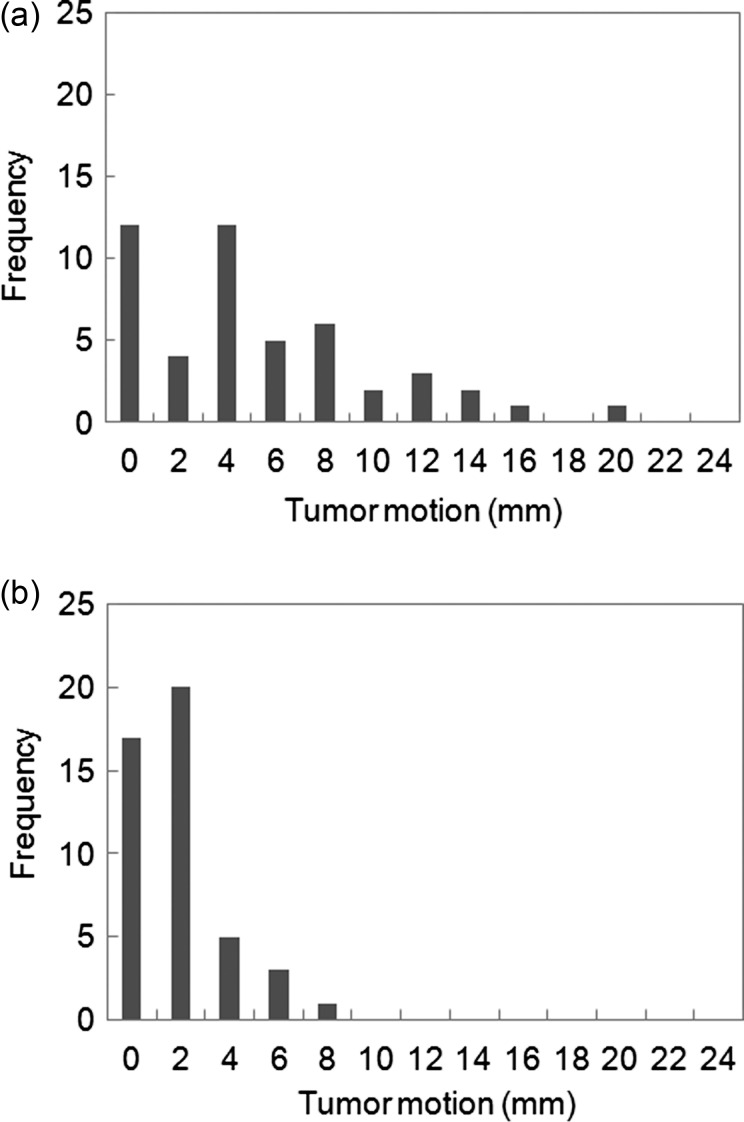
Figure 3 shows a histogram of tumor motion with respiration. Tumor motion in patients with upper/middle lobe and lower lobe tumors, for which movement was greatest in the cranio-caudal direction, was 2.2 ± 1.9 mm (range 0.1–8.2 mm) and 6.2 ± 5.0 mm (range 0.1–21.4 mm), respectively (P < 0.05); that in the lateral direction was 0.9 ± 0.7 mm (range 0.1–3.6 mm) and 0.9 ± 0.6 mm (range 0.1–2.9 mm), respectively (P = 0.74); and that in the anterior-posterior direction was 1.4 ± 1.0 mm (range 0.1–5.0 mm) and 1.4 ± 1.2 mm (range 0.1–4.7 mm), respectively (p = 0.99). Tumor motion vector for patients with upper/middle and lower lobe tumors was 2.8 ± 1.9 mm (range 0.1–9.9 mm) and 6.3 ± 5.0 mm (range 0.1–22.0 mm), respectively, with this difference in tumor motion being significant (P < 0.05). All patients with upper/middle lesions exhibited between 0 and 10 mm of tumor motion. Tumor movement of more than 20 mm was seen in one patient, with a lower lobe tumor.
Fig. 3.
Histograms of the tumor motion vector of upper/middle lung tumors (a) and lower lung tumors (b) using an abdominal compression system developed in-house. n = 94.
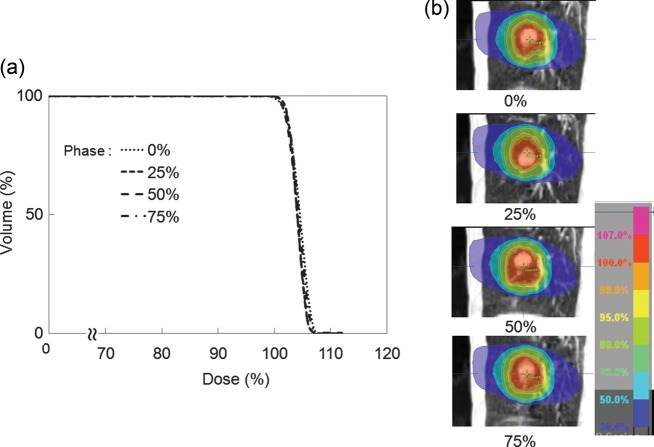
Figure 4 shows the dose distribution and DVH of the delivered dose to the GTV for the four breathing phases for representative patients. The lower isodose lines hardly differ between breathing phases, while the higher isodose lines are synchronized with the tumor motion. D99 to the GTV in the 4D calculation was 99.7%, 99.9%, 100.3% and 100.0% at 0%, 25%, 50% and 75%, respectively. Dose to the GTV in the inspiration phase was slightly lower than that in the expiration phase. The dose difference between maximum and minimum D99 of the GTV in 4D calculations was 0.6 ± 1.0% (range 0.2–4.6%). Average D99 of the GTV in 4D calculations for most of the patients was almost 100% (99.8 ± 1.0%). No significant difference in dose to the GTV was seen between 3D and 4D dose calculations (P = 0.67).
Fig. 4.
(a) Dose volume histograms and (b) dose distributions of GTV for each breathing phase in one patient (tumor motion: 11 mm).
DISCUSSION
Dose prescription in SBRT is defined by two major methods. The Japan Clinical Oncology Group (JCOG) and the Radiation Therapy Oncology Group (RTOG) have planned multi-institutional trials of SBRT for non-small-cell lung cancer [4–5]. In the JCOG 0403 protocol, dose prescription is defined as the point dose at the isocenter of the PTV with inhomogeneous correction, such as the Pencil Beam convolution with Batho power law and Clarkson with effective path length correction, but this prescription is not accurate for dose calculations of lung cancer [9]. In contrast, the RTOG 0236 protocol defines dose prescription as the volume dose at the periphery of the PTV without inhomogeneous correction. These clinical trials reported around 90% of local control rates have been report [1–3]. Because these reports do not cover the test results of inhomogeneous correction, the actual dose delivered to the tumor cannot be accurately determined. Inhomogeneous corrections were necessary to prevent large discrepancies between planned and actual delivered doses to individual patients. Several studies of the accuracy of inhomogeneous correction employing various algorithms have been reported. Takahashi et al. reported that collapsed cone convolution and superposition calculation plans were close to the MC calculation plan and the actual dose distributions obtained in lung SBRT [10]. The external border of the PTV is covered by a lower isodose surface than that usually used in conventional radiotherapy planning, typically around 80% [11–12]. Therefore, prescription dose was defined to the PTV, which was differently covered at 65% [11] and 80% [12], with normalization to 100% at the isocenter in inhomogeneous correction. Monitor units and leaf margins should be adjusted to allow sufficient PTV coverage. This increases the amount of normal tissue in the field, however, which could lead to increased toxicity. The PTV is a tool designed to ensure that the tumor receives an adequate absorbed dose. The ICRU reported that PTV might not necessarily be useful for dose optimization [7].
This study revealed that tumor motion influenced the GTV on inhomogeneous dose distribution using the MC calculation. Our present phantom study suggests that the actually delivered dose to the GTV was more stable than that expected from the planned dose, owing to the generation of secondary electrons from the tumor [11]. Additionally, the decreased dose to the GTV resulted from larger tumor motion, indicating the need for particular attention to the larger tumor motion induced by breathing. Nevertheless, no dose difference to the GTV between 3D and 4D calculations was observed for our present lung cancer patients because tumor motion was small. Seppenwoolde et al. measured 3D motion in 20 patients using a 2 mm gold marker implanted in or near the tumor during real-time imaging [13]. They reported that the greatest average amplitude of tumor motion in the cranial-caudal direction was 12 ± 2 mm for lower lobe tumors, and 2 ± 1 mm in both the lateral and anterior-posterior directions for upper and lower lobe tumors, respectively. The motion range of tumors for many patients can be suppressed to less than 5 mm using the Air-bag System. Abdominal compression has been widely used to minimize respiratory-associated tumor movement during SBRT to lung and liver tumors [14]. Abdominal compression can be used to suppress respiratory diaphragm motion, which leads to suppressed tumor motion [15]. The reduction in tumor motion may lead to a decrease in dose to the normal lung structure. An effective approach to resolving motion without increasing margins is to gate and synchronize the radiation to specific phases of the respiratory cycle [16]. Most lung cancer patients are elderly, and these techniques require a longer time for beam delivery, making it more difficult for patients as they must maintain normal breathing over the delivery time. We therefore selected the free-breathing technique using abdominal compression.
A dose difference between maximum and minimum at the D99 of GTV for each phase was >3% in eight patients. The tumor motion vector for these patients was 3.1 ± 1.9 mm (range 1.5–6.4 mm). Figure 5 shows the dose distribution at the worst case for end-inspiration and end-expiration phases, in which the tumor was located near the diaphragm. The delivered dose to the GTV at the end-inspiration phase was lower than that at the end-expiration phase. Dose distributions were different in each breathing phase, owing to secondary scatter generated from the diaphragm. Guckenberger et al. reported that the CTV was still covered by almost 100% of the dose under conditions of tumor movement, but the peripheral dose was reduced by the low-density material [11]. If the microscopic extension margin is added and dose prescription is defined to the CTV [17], the CTV includes the low-density material, leading to a similar dose result to that for the PTV.
Fig. 5.
Dose distributions for (a) end-inspiration (b) end-expiration in one patient (tumor motion: 5.1 mm).
For a regular free-breathing CT simulation, images could be acquired at a random phase. Selection of the reference image for 3D calculation at the end-breathing phase, however, may result in a larger dose difference between the 3D and 4D dose calculations. In the case of 4D, we renormalized calculation to achieve an average delivered GTV dose of more than 100%. 4D treatment planning provides more accurate dose calculations to the tumor with regard to relative changes in shape, volume, position and density during respiration. Our approach to GTV for respiration-induced tumor motion achieved adequate tumor coverage and spared normal tissue.
CONCLUSION
We investigated the effect of respiratory motion on the delivered dose to the GTV in 4D dose distribution. No significant differences were found between 3D and 4D dose calculations in treatment planning for lung cancer patients using the MC calculation. Particular attention should be paid to not only tumor motion but also the structure around the tumor. This study supports the clinical acceptability of treatment planning based on the dose prescription defined to the GTV.
REFERENCES
- 1.Nagata Y, Wulf J, Lax I, et al. Stereotactic radiotherapy of primary lung cancer and other targets: results of consultant meeting of the International Atomic Energy Agency. Int J Radiat Oncol Biol Phys. 2011;79:660–9. doi: 10.1016/j.ijrobp.2010.10.004. [DOI] [PubMed] [Google Scholar]
- 2.Onishi H, Araki T, Shirato H, et al. Stereotactic hypofractionated high-dose irradiation for stage I non-small cell lung carcinoma: clinical outcomes in 245 subjects in a Japanese multiinstitutional study. Cancer. 2004;101:1623–31. doi: 10.1002/cncr.20539. [DOI] [PubMed] [Google Scholar]
- 3.Nagata Y, Takayama K, Matsuo Y, et al. Clinical outcomes of a phase I/II of 48Gy of stereotactic body radiotherapy in 4 fractions for primary lung cancer using a stereotactic body frame. Int J Radiat Oncol Biol Phys. 2005;63:1427–31. doi: 10.1016/j.ijrobp.2005.05.034. [DOI] [PubMed] [Google Scholar]
- 4.Matsuo Y, Takayama K, Nagata Y, et al. Interinstitutional variations in planning for stereotactic body radiation therapy for lung cancer. Int J Radiat Oncol Biol Phys. 2007;68:416–25. doi: 10.1016/j.ijrobp.2006.12.012. [DOI] [PubMed] [Google Scholar]
- 5.Ding GX, Duggan DM, Lu B, et al. Impact of inhomogeneity corrections on dose coverage in the treatment of lung cancer using stereotactic body radiation therapy. Med Phys. 2007;34:2985–94. doi: 10.1118/1.2745923. [DOI] [PubMed] [Google Scholar]
- 6.Aarup LR, Nahum AE, Zacharatou C, et al. The effect of different lung densities on the accuracy of various radiotherapy dose calculation methods: implications for tumour coverage. Radiother Oncol. 2009;91:405–14. doi: 10.1016/j.radonc.2009.01.008. [DOI] [PubMed] [Google Scholar]
- 7.International Commission on Radiation Units and Measurements. ICRU Report 83. Prescribing, recording, and reporting photon-beam intensity-modulated radiation therapy (IMRT) J ICRU. 2010;10 [Google Scholar]
- 8.Oh R, Masai N, Shiomi H, et al. The “Air-bag System”: A novel respiratory monitoring device collaborated with RPM system. Int J Radiat Oncol Biol Phys. 2010;78:S824–5. [Google Scholar]
- 9.Kappas C, Rosenwald JC. Quality control of inhomogeneity correction algorithms used in treatment planning systems. Int J Radiat Oncol Biol Phys. 1995;32:847–58. doi: 10.1016/0360-3016(94)00474-Y. [DOI] [PubMed] [Google Scholar]
- 10.Takahashi W, Yamashita H, Saotome N, et al. Evaluation of heterogeneity dose distributions for Stereotactic Radiotherapy (SRT): Comparison of commercially available Monte Carlo dose calculation with other algorithms. Radiat Oncol. 2012;7:20. doi: 10.1186/1748-717X-7-20. [DOI] [PMC free article] [PubMed] [Google Scholar]
- 11.Guckenberger M, Wilbert J, Krieger T, et al. Four-dimensional treatment planning for stereotactic body radiotherapy. Int J Radiat Oncol Biol Phys. 2007;69:276–85. doi: 10.1016/j.ijrobp.2007.04.074. [DOI] [PubMed] [Google Scholar]
- 12.Takeda A, Sanuki N, Kunieda E, et al. Stereotactic body radiotherapy for primary lung cancer at a dose of 50 Gy total in five fractions to the periphery of the planning target volume calculated using a superposition algorithm. Int J Radiat Oncol Biol Phys. 2009;73:442–8. doi: 10.1016/j.ijrobp.2008.04.043. [DOI] [PubMed] [Google Scholar]
- 13.Seppenwoolde Y, Shirato H, Kitamura K, et al. Precise and real-time measurement of 3D tumor motion in lung due to breathing and heartbeat, measured during radiotherapy. Int J Radiat Oncol Biol Phys. 2002;53:822–34. doi: 10.1016/s0360-3016(02)02803-1. [DOI] [PubMed] [Google Scholar]
- 14.Heinzerling JH, Anderson JF, Papiez L, et al. Four-dimensional computed tomography scan analysis of tumor and organ motion at varying levels of abdominal compression during stereotactic treatment of lung and liver. Int J Radiat Oncol Biol Phys. 2008;70:1571–8. doi: 10.1016/j.ijrobp.2007.12.023. [DOI] [PubMed] [Google Scholar]
- 15.Eccles CL, Patel R, Simeonov AK, et al. Comparison of liver tumor motion with and without abdominal compression using cine-magnetic resonance imaging. Int J Radiat Oncol Biol Phys. 2011;79:602–8. doi: 10.1016/j.ijrobp.2010.04.028. [DOI] [PubMed] [Google Scholar]
- 16.Mageras GS, Yorke E. Deep inspiration breath hold and respiratory gating strategies for reducing organ motion in radiation treatment. Semin Radiat Oncol. 2004;14:65–75. doi: 10.1053/j.semradonc.2003.10.009. [DOI] [PubMed] [Google Scholar]
- 17.Giraud P, Antoine M, Larrouy A, et al. Evaluation of microscopic tumor extension in non-small-cell lung cancer for three-dimensional conformal radiotherapy planning. Int J Radiat Oncol Biol Phys. 2000;48:1015–24. doi: 10.1016/s0360-3016(00)00750-1. [DOI] [PubMed] [Google Scholar]


