

Abstract
The oocyte, to become a fully mature gamete, has to acquire a correct pattern of DNA methylation on its genome; this epigenetic event represents the major point of the molecular mechanisms that occur during postnatal oogenesis. It is known that an intimate link exists between DNA methylation and histone posttranslational modifications, such as trimethylation of lysine 9 on histone 3 (H3K9me3), that is essential in the silencing of gene transcription. What remains unclear is the precise sequence of these two epigenetic events and the protein expression of the enzymes that catalyze this epigenetic maturation during oogenesis. To identify the key molecules involved in global DNA methylation and H3K9me3, a biological network-based computational model was realized. Then, the spatiotemporal distribution of the proteins, identified from the biological network, was assessed during postnatal oogenesis. The results obtained suggest the existence of a sequential cascade of events in which H3K9me3 is the primary step followed by DNA methylation. These two epigenetic marks are realized due to the recruitment of the HDAC1, SUV39H1, G9a, HP1, and Dnmt3a, which were always localized in the nuclei of the oocytes and were dependent on chromatin configuration. These results involving DNA methylation and H3K9me3 are crucial in defining the oocyte developmental competence.
Keywords: H3K9me3, global DNA methylation, HDAC1, SUV39H1, G9a, HP1, Dnmt3a, sheep, oogenesis, biological networks
Epigenetic modifications consist of reversible changes to DNA that are involved in the regulation of gene expression without affecting its primary DNA sequence. Major epigenetic mechanisms include DNA methylation, covalent posttranslational modifications of histone proteins, and RNA-mediated gene silencing (Vaissière et al. 2008). Altogether, these epigenetic mechanisms regulate physiological events and are also involved in the pathological ones, such as cancer (Jones and Baylin 2002).
The development of adult organisms depends on several epigenetic reprogramming events. In fact, after fertilization, both parental genomes undergo global demethylation involving non-imprinted sequences to prepare the embryo, after the first divisions, to automatically use its new genome. Then, the primordial germ cells begin to undergo a complete demethylation to erase the inherited parental imprints; this is required to delete any trace of the original somatic genome, as these cells will differentiate into specialized gametes during fetal/adult life (Morgan et al. 2005). After birth, methylation levels of individual imprinted genes and non-imprinted regions of the genome are assessed over the period of oocyte growth and maturation (Lucifero et al. 2004). By the time of ovulation, the oocyte has acquired the correct pattern of DNA methylation, becoming a fully differentiated non-transcriptional gamete (Swales and Spears 2005).Methylation is both a heritable and reversible epigenetic modification able to define primary imprinting in gametes and influence gene expression and also chromatin condensation via the binding of several modulatory factors (Kono 1998; Arney et al. 2001; Li 2002). Large-scale chromatin condensation during mammalian oocyte growth is, in fact, a crucial event that temporarily switches off global gene transcription in fully differentiated oocytes. These, at the end of the growing phase, will have synthesized and accumulated in their cytoplasm essential molecules to sustain the early phase of embryo development (Bouniol-Baly et al. 1999; De La Fuente et al. 2004; Dean et al. 2005; Zuccotti et al. 2005; Russo et al. 2006; De La Fuente 2006; Lodde et al. 2007; Russo et al. 2007; Tan et al. 2009). Thus, the nuclei of fully differentiated oocytes, to express a complete embryonic developmental competence, start to display an inactive, condensed chromatin, stable and elongated telomeres, and high levels of DNA methylation (Russo et al. 2006; Kageyama et al. 2007; Russo et al. 2007). The available information on DNA methylation represents the starting point for interpreting the molecular mechanisms underlying the epigenetic events that occur during oogenesis. A great degree of knowledge on epigenetic mechanisms has been achieved using somatic or tumor murine cells (Mager and Bartolomei 2005; Nagase and Ghosh 2008). It is known that there is an intimate link between DNA methylation and histone posttranslational modifications controlled by several enzymatic proteins. In particular, three active DNA cytosine methyltransferases—Dnmt1, Dnmt3a, and Dnmt3b—have been characterized in mammals. Dnmt1, which is a maintenance methyltransferase, restores DNA methylation patterns (Bestor 1992). Dnmt3a and Dnmt3b are required to initiate and establish de novo DNA methylation patterns (Okano et al. 1999). In addition, six methyl-CpG-binding proteins, including MECP2, MBD1, MBD2, MBD3, MBD4, and Kaiso, have been identified in mammals. MECP2 binds methylated DNA in vitro and in vivo. MBD1, 2, and 4 bind methyl-CpG preferentially (Bird 2002). MBD3 is an integral component of the Mi-2–NuRD complex (Wade et al. 1999; Zhang et al. 1999). MECP2, MBD1, and MBD2 function as transcription repressors. MBD4 is involved in DNA mismatch repair (Riccio et al. 1999). Kaiso binds methylated CGCG through its zinc-finger domain (Prokhortchouk et al. 2001). An additional role has been identified for these methyl-CpG binding proteins, which suggests that they might recruit different chromatin-remodeling proteins and transcription-regulatory complexes to methylated DNA targets in the genome.
The process of methylation also may involve the histone proteins that modify the biochemical access to the genome. Numerous classes of histone methyltransferases have been identified (Zhang and Reinberg 2001), most notably five H3-K9 methyltransferases: Suv39h1 and Suv39h2 (Rea et al. 2000), G9a (Tachibana et al. 2002), ESET/SetDB1 (Schultz et al. 2002; Yang et al. 2002), and Eu-HMTase1 (Ogawa et al. 2002). Moreover, several histone deacetylases (HDACs) have also been identified in mammalian cells, which determine deacetylation of lysine residues on the N-terminal part of the core histones and are associated with transcriptional repression and nucleosomal condensations (Li 2002).
Among the histone modifications associated with a repressed chromatin state and gene silencing, the ones that have been studied more to date are histone deacetylation and trimethylation of lysine 9 of histone H3 (H3K9me3). Although it is well established that an epigenetic “conversation” exists between histones and DNA that leads to transcriptional silencing (Fuks 2005; Cheng and Blumenthal 2010; He et al. 2011; Wong et al. 2011), what remains unclear is the precise sequence of these events during oogenesis. In addition, several mRNA transcripts of the enzymes that catalyze these histone modifications have been identified in mammalian oocytes (Nowak-Imialek et al. 2008; Racedo et al. 2009; Gu et al. 2010), but data regarding protein expression of these enzymes are still insufficient.
Moreover, the proteins that carry out these epigenetic modifications do not act alone but interact with one another, often by forming large protein complexes that regulate higher-order chromatin structures and the accessibility of chromatin to various controlling/transcriptional factors (Li 2002). Thus, the epigenetic remodeling of cells is a process that involves hundreds of molecules, interacting with each other in a non-linear way, giving rise to a complex network of pathways that only now has begun to be clarified. As recently proposed (Vespignani 2003), a powerful strategy to manage the complexity of biological events is computational modeling. Adopting this emerging approach, it may become possible to describe and quantitatively analyze the links existing among several biochemical pathways, focusing our attention on the whole system. In fact, as the theory of complexity postulates, a whole system is more than the sum of its single components.
For this reason, in the present study, a biological network-based computational model was realized to analyze the molecular events involved in transcriptional silencing. In particular, computational modeling was designed to interpret the interactions among several proteins defining global DNA methylation and H3K9me3, the main mechanisms involved in transcriptional silencing already described in different cellular models. An experimental setup also has been developed to translate the indications obtained with the help of the sheep postnatal oogenesis model. In particular, immunohistochemical analyses were performed to verify which sequential cascade of events occurs between global DNA methylation and H3K9me3 and to describe the major linked proteins, identified within the computational model, as well as their expression and single subcellular distribution.
Materials and Methods
Biological Network Realization and Analysis
To analyze the molecular events involved in transcriptional silencing, we have adopted graph theory formalism. In fact, a system of elements that interact or regulate each other can be represented by a mathematical object called a “graph” (Bollobás 1979). The graphs are constituted by a variable number of nodes (the molecules) linked by edges (interactions) originating a network. The edges can be directed (i.e., could recognize a starting and target point) or undirected (Albert 2005).
To realize the biological network representing transcriptional silencing (TS network), a database was realized using Microsoft Office Excel 2003 (Microsoft Corp.; Redmond, WA). The available information was obtained from peer-reviewed papers from PubMed (www.ncbi.nlm.nih.gov/pubmed/) published in the past 10 years. The database fields were addressed to collect the following:
Source molecule: representing the molecule source of interaction
Interaction: representing the nature of the interaction (activation, inhibition, etc.)
Target molecule: representing the molecule target of the interaction
Biological function: representing the functional meaning or the context of the interaction
Reference: representing the bibliographic source of the information
Notes: representing all the notations, such as the presence of synonyms
By contrast, freely available and diffusible molecules, such as H2O, CO2, Pi, H+, and O2, were not considered. The data, extracted from the database, were used to build a biological network using Cytoscape 2.8.2 (http://www.cytoscape.org). Once realized, the network was represented using the yFile Hierarchical Layout, where the node size was proportional to the connection number and the node color gradient was dependent on the closeness centrality (Cc). This parameter is computed as Cc(n) = 1/avg(L(n,m)), were L(n,m) is the length of the shortest path occurring between two nodes named n and m. The closeness centrality of each node may range from 0 to 1, and it is a measure of how fast information spreads from a given node to the other nodes. The statistical and topological analyses of networks were carried out using the Cytoscape plugin Network Analyzer (http://med.bioinf.mpi-inf.mpg.de/netanalyzer/help/2.6.1/index.html). In particular, the following parameters have been assessed:
Number of nodes: the total number of molecules involved
Number of edges: the total number of interactions
Clustering coefficient: calculated as CI = 2nI/k(k – 1), where nI is the number of links connecting the kI neighbors of node I to each other and is a measure of how the nodes tend to form clusters
Network diameter: the largest distance between two nodes,
Average number of neighbors: the mean number of connections of each node
Characteristic path length: the expected distance between two connected nodes
Tissue and Ovarian Follicles Collection
Ovaries were collected during the breeding season from 2- to 4-year-old adult sheep weighing about 50 kg that were slaughtered at the local abattoir.
The ovaries were transported to the laboratory within 30 min in an isothermal container. In order to study primary follicles, a group of ovaries were trimmed of any extra tissue, cut into small ovarian cortical pieces, and immediately fixed in 4% paraformaldehyde/phosphate-buffered saline (PBS) for 12 hr at 4C. By contrast, secondary and tertiary follicles were mechanically isolated under a stereomicroscope as previously described (Cecconi et al. 1999). All procedures were performed in a dissection medium (Dulbecco’s phosphate-buffered medium with Ca++ and Mg++ supplemented with 0.4% bovine serum albumin [BSA]; Sigma, St. Louis, MO), with the aid of fine forceps.
After isolation, healthy follicles were measured and selected on the basis of their morphology. In particular, under the stereomicroscope, only the translucent follicles displaying the compactness of follicular layers, the absence of free particles within the antral cavity, and the presence of blood vessels were considered healthy (Cecconi et al. 1999; Mattioli et al. 2001).
Single healthy follicle diameters were then measured using an inverted-phase microscope equipped with an ocular micrometer (×40 magnification) and classified (Russo et al. 2007; Barboni et al. 2011) as follows:
Small preantral follicles (150 ± 40 µm diameter)
Large preantral follicles (250 ± 30 µm)
Early antral follicles (350 ± 50 µm)
Medium-sized antral follicles (≥ 3 mm)
Single follicles were then fixed in 4% paraformaldehyde/PBS for 1 hr at 4C and then, as with the ovarian cortical slides, dehydrated through an ethanol series and embedded in paraffin wax before processing them for immunohistochemistry analyses.
Immunohistochemistry
Indirect immunofluorescence was carried out to describe the evolution of H3K9me3 and global DNA methylation during sheep oogenesis by analyzing their single and merged patterns in the oocytes of each category of follicles considered. Then, the main proteins involved in H3K9me3 and global DNA methylation identified within the computational model were detected in the oocytes of all follicular categories considered (from primary to tertiary follicles). In detail, the expression and subcellular distribution of histone deacetylase 1 (HDAC1), histone methyltransferase G9a, histone methyltransferase suppressor of variegation 3-9 homolog 1 (SUV39H1), heterochromatin protein 1 (HP1), and DNA-methyltransferase 3a (Dnmt3a) were considered.
Each sample, once rehydrated in increasing concentrations of ethanol, was subjected to three washes in PBS, and antigen retrieval was achieved for all immunoreactions by treating sections of 5 µm thickness for 20 min in 20 µg/ml proteinase K in PBS. Nonspecific binding was blocked by incubating the sections in normal goat or donkey serum, depending on the secondary antibody used, (1:20 dilution in PBS/1% BSA; Sigma) for 1 hr at room temperature. Then, samples were treated as specified in the following paragraphs.
H3K9me3
The primary antibody, a rabbit anti-H3K9me3 (Abcam, Cambridge, UK), was maintained at the appropriate dilution (1:500 in PBS/1% BSA) overnight at 4C. The samples, after washing in PBS, were incubated with a goat anti-rabbit Alexa Fluor 488 secondary antibody (1:200 in PBS; Invitrogen, Carlsbad, CA) was then used for 1 hr at room temperature.
Global DNA Methylation
Tissue slides were treated in 2M HCl for 2 hr at 37C to obtain DNA denaturation and then neutralized in 100 mM Tris HCl buffer (pH 8.5) for 10 min at room temperature before primary antibody incubation. The primary antibody, a mouse anti–5-methylcytosine (Eurogentec, Seraing, Belgium), was maintained at the appropriate dilution (1:500 in PBS/1% BSA) overnight at 4C. The sections, after extensive washing in PBS, were incubated with a goat anti-mouse Cy3 secondary antibody (1:400 in PBS; Chemicon International, Temecula, CA) for 1 hr at room temperature.
Double Immunostaining for Global DNA Methylation and H3K9me3
To obtain DNA, denaturated tissue slides were treated as described in the single immunoreaction for global DNA methylation before primary antibody incubation. The sections were incubated with a mouse anti–5-methylcytosine (1:500 in PBS/1% BSA; Eurogentec) and with a rabbit anti-H3K9me3 (1:500 in PBS/1% BSA; Abcam) at 4C overnight. After an extensive washing in PBS, the 5-methylcytosine immunocomplexes were revealed by incubating the tissue sections with a goat anti-mouse Cy3 secondary antibody (1:400 in PBS; Invitrogen), and to reveal H3K9me3 immunocomplexes, sections were incubated with a goat anti-rabbit Alexa Fluor 488 secondary antibody (1:400 in PBS; Invitrogen) for 1 hr at room temperature.
HDAC1
Immunohistochemistry was performed with a polyclonal rabbit anti-HDAC1 (1:200 in PBS/1% BSA; Abcam) at 4C overnight. Then, after washing in PBS, a secondary goat anti-rabbit conjugated Cy3 antibody (1:400 PBS/1% BSA for 1 hr at room temperature; Chemicon International) was used to reveal the primary antibody.
G9a and SUV39H1
These two enzymes belong to the family of histone-methyltransferases, and for this reason they will be described together.
Immunohistochemistry for G9a was performed with a polyclonal goat anti-G9a (1:25 in PBS/1% BSA; Santa Cruz Biotechnology, Santa Cruz, CA) at 4C overnight. After washing in PBS, a donkey anti-goat TRITC conjugated secondary antibody (1:200 in PBS/1% BSA; Sigma) was used.
Immunohistochemistry for SUV39H1 was performed with a polyclonal rabbit anti-SUV39H1 (1:25 in PBS/1% BSA; Santa Cruz Biotechnology) at 4C overnight. After washing in PBS, biotin-labeled secondary goat anti-rabbit antibody (1:100 in PBS/1% BSA; Sigma) was applied for 1 hr and then, after washing in PBS, incubated in avidin-TRITC diluted 1:200 in PBS for 1 hr.
HP1
Immunohistochemistry was performed with a polyclonal goat anti-HP1 (1:25 in PBS/1% BSA; Santa Cruz Biotechnology), which recognizes all three mammalian isoforms, at 4C overnight. After washing in PBS, biotin-labeled secondary donkey anti-goat antibody (1:100 in PBS/1% BSA; Sigma) was applied for 1 hr and then, after washing in PBS, incubated in avidin-TRITC diluted 1:200 in PBS for 1 hr.
Dnmt3a
Immunohistochemistry was performed using a polyclonal rabbit antibody anti-Dnmt3a (1:100 PBS/1% BSA overnight at 4C; Abcam). Then, after washing in PBS, a secondary goat anti-rabbit conjugated Cy3 antibody (1:400 PBS/1% BSA; Chemicon International), for 1 hr at room temperature, was used to reveal Dnmt3a (Barboni et al. 2011).
At the end of each immunoreaction, the DNA was counterstained with DAPI (Sigma) diluted 1:100 in PBS for 10 min. In all experiments, non-immune serum was used in place of the primary antisera as a negative control. All controls performed were negative. As indicated in the HDAC1, G9a, SUV39H1, and HP1 data sheets, human papillomavirus–transformed epithelial cells (HeLa) were used as a positive control (data not shown).
Each immunofluorescence analysis was performed on at least 30 replicates (oocytes/follicular category).
Fluorescence Image Analyses
The morphological analyses were performed with an Axioskop 2 Plus epifluorescence microscope (Zeiss, Oberkochen, Germany) equipped with a cooled color charge-coupled device camera (CCD; Axiovision Cam, Zeiss, Oberkochen, Germany) interfaced to a computer workstation and provided with an interactive and automatic image analyzer (Axiovision; Zeiss). Tissue sections were analyzed at a magnification of ×400. At the beginning of an imaging session, optimum exposure times were determined and held constant thereafter. The oocyte nuclei, named germinal vesicles (GVs), were acquired by setting the luminous-field diaphragm on their whole area. This procedure was performed to exclude any interference with granulosa cell fluorescent signals. After the acquisition of the digitized image, it was stored in a 1300 × 1030–pixel file and imported in the 24-bit uncompressed TIF format.
Fluorescence Quantitative Analyses
To evaluate any modifications in the H3K9me3 and global DNA methylation status during oogenesis, both fluorescent signals were analyzed, according to Russo et al. (2007), by considering the total fluorescence intensity (TFI) on the two-dimensional image emitted by the signal recorded in each GV on the equatorial plane. The images were always corrected for the background, represented by the mean intensity of the cytoplasmic area, and nuclear intensities were measured by manually outlining each GV. Then, the TFI emitted from each GV was measured using the KS300 computed image analysis system (Zeiss). The obtained values were then normalized: for each fluorescent staining, the maximum TFI recorded was considered 100%.
Statistical Analysis
All the data obtained from TFI oocyte analyses at the different follicular stages were tested for normal distribution and then compared using analysis of variance (MicroCal Origin 6.0; GE Healthcare, Piscataway, NJ). The data were expressed as mean ± standard deviation (SD). Statistical analyses were carried out on transformed data by logarithmic function; p<0.05 was considered significant, and p<0.01 was considered highly significant.
Results
Analysis of Biological Network Topology
The TS network resulting from the aggregation of the data is represented in Figure 1.
Figure 1.

Diagram showing the structure of the transcriptional silencing network. The node diameter is proportional to the number of links, and the color varies depending on the closeness centrality (red = 1; green = 0). The spatial network arrangement was obtained by using the yFile Hierarchical Layout.
Statistical analysis allowed us to define the main topological parameters used to infer some relevant biological aspects of these series of events (see Table 1). In detail, it is evident that the networks were characterized by the following:
Table 1.
Main Topological Parameters of the Transcriptional Silencing Network
| No. of nodes | 34 |
| No. of edges | 75 |
| Clustering coefficient | 0.037 |
| Diameter | 5 |
| Average number of neighbors | 2.574 |
| Characteristic path length | 4.294 |
The number of nodes represents the total number of molecules involved; the number of edges represents the total number of interactions found; the clustering coefficient is calculated as CI = 2nI/k(k – 1),where nI is the number of links connecting the kI neighbors of node I to each other; the network diameter is the largest distance between two nodes; the average number of neighbors represents the mean number of connections of each node; and the characteristic path length gives the expected distance between two connected nodes.
A very low value of the clustering coefficient (0.037) (i.e., the nodes scarcely tended to form clusters)
Ideally, a maximum distance of 5 between two nodes
An average number of 2.5 neighbors (i.e., each node is, on average, connected with two or three other nodes)
A characteristic path length of 4.2 (i.e., to jump from a random node to another random node, on average, four passages were necessary)
In addition, the analysis of the network topology revealed that the closeness centrality was strongly correlated with the node degree (r = 0.692); in other words, the most linked nodes were those whose variation would affect all the other nodes faster.
Because the biological events represented by the network were strictly dependent on its topology, we have identified the most connected nodes (the hubs), as shown in Table 2. The analysis of the network topology allowed us to select the main epigenetic events (DNA methylation and H3K9me3) and molecules involved in transcriptional silencing. Although, for this research, among the identified hubs, only those molecules for which their mRNAs have been already identified in bovine oocytes (Nowak-Imialek et al. 2008; Racedo et al. 2009) were chosen, because there is a greater similarity between the oocytes of ruminants compared with other mammals. Thus, Eu-HMT, ESET, and SUV39H2 were not analyzed, whereas HDAC1, G9a and SUV39H1, HP1, and Dnmt3a were considered. Then, these epigenetic marks and molecules were assessed in physiologically grown sheep oocytes by means of immunohistochemical studies.
Table 2.
Most Connected Nodes (the Hubs) of the Transcriptional Silencing Network
| Node | No. of Links |
|---|---|
| DNA methylation | 10 |
| HDACs | 10 |
| G9a | 9 |
| H3K9me3 | 9 |
| Eu-HMT | 8 |
| ESET | 8 |
| SUV39H1 | 7 |
| SUV39H2 | 7 |
Analysis of Histone H3K9 Trimethylation
The immunopositivity for H3K9me3 was recorded in the nucleus of all categories of oocytes analyzed and always co-localized with chromatin (Fig. 2). Even if the chromatin architecture changed, following the configuration patterns previously described by Russo et al. (2007), H3K9me3 distribution tracked chromatin modifications. In fact, the oocytes enclosed in primary and preantral follicles displayed H3K9me3 conjugated to the chromatin that appeared diffuse, not condensed, and did not surround the nucleolus (NSN). The incidence of NSN oocytes dropped in early antral follicles, where about 70% of the gametes started to display a more condensed chromatin that was strictly localized around the nucleolus (SN) and that conserved the positivity for H3K9me3. Finally, antral follicle germ cells displayed a condensed chromatin, together with a positivity to H3K9me3, partially localized around the nucleolus and the nuclear envelope (SNE configuration).
Figure 2.

Microphotographs of sheep germinal vesicles (GVs) showing immunopositivity for H3K9me3. (A–C) H3K9me3 patterns (in green). (D–F) Different types of chromatin configurations (DAPI): (D) diffuse chromatin within the nucleus (NSN), (E) condensed chromatin around the nucleolus (SN), and (F) condensed chromatin around the nucleolus and the nuclear envelope (SNE). (G–I) H3K9me3 and DAPI merged images. A perfect overlap of the two fluorescent signals is evident. Scale bar = 50 µm.
Simultaneous Analysis of Histone H3K9me3 and Global DNA Methylation
The double immunolabeling (Fig. 3) revealed that the coexpression of H3K9me3 and DNA methylation started only in those oocytes enclosed in large preantral follicles, persisting in gametes of early antral and antral follicles (Fig. 3F–L). It is important to note (Fig. 3M–Q) that the fluorescence signals related to H3K9me3 and DNA methylation were not coincident exclusively in the oocytes displaying an NSN chromatin configuration.
Figure 3.

Digital images of sheep germinal vesicles (GVs) showing immunopositivity for H3K9me3 (left images), global DNA methylation (middle images), and merged images (right images). H3K9me3 immunofluorescence was performed with Alexa Fluor 488 (green), whereas global DNA methylation was analyzed with a 5-methylcytosine antibody and revealed with a Cy3 conjugated antibody (red). (A) A typical GV of a germ cell present in a primary follicle (primary NSN) with a diffuse chromatin (NSN) that shows immunopositivity for H3K9me3 but does not display any immunostaining for 5-methylcytosine (F, M). (B) A GV example of an oocyte belonging to a large preantral follicle (L-PA NSN) where the NSN chromatin shows an intense H3K9me3 immunofluorescence and starts to display immunopositivity for 5-methylcytosine (G). The merged image reveals that global DNA methylation and H3K9me3 staining are not coincident (N). (C, D) Two examples of GV oocytes present in early antral (EA) follicles with either an NSN or a chromatin configuration that surrounds the nucleolus (SN), respectively. In both categories of oocytes, the H3K9me3 (EA NSN = C–O; EA SN = D–P) and 5-methylcytosine immunopositivity (EA NSN = H–O, EA SN = I–P) indicates the high degree of histone and DNA methylation. (E) A GV of an oocyte belonging to an antral follicle (A SNE) where the chromatin is partially localized around the nucleolus and the nuclear envelope (SNE configuration) with a clear immunopositivity for H3K9me3 and 5-methylcytosine (E, L). In the merged image (Q), it is evident that the two fluorescent signals are superimposable. Bar = 100 µm.
Quantification of H3K9me3 and Global DNA Methylation
The total fluorescence intensity (TFI) signals for H3K9me3 and DNA methylation was strictly dependent on the follicular stage. In detail, H3K9me3 TFI, calculated in the oocytes enclosed in primary and small preantral follicles, was ~20%, whereas the oocytes belonging to the large preantral follicles had a higher TFI (~100%, p<0.05; Fig. 4). In the oocytes enclosed in early antral and antral follicles, the TFI value remained constant (p>0.05), although the chromatin configuration changed (Fig. 4).
Figure 4.
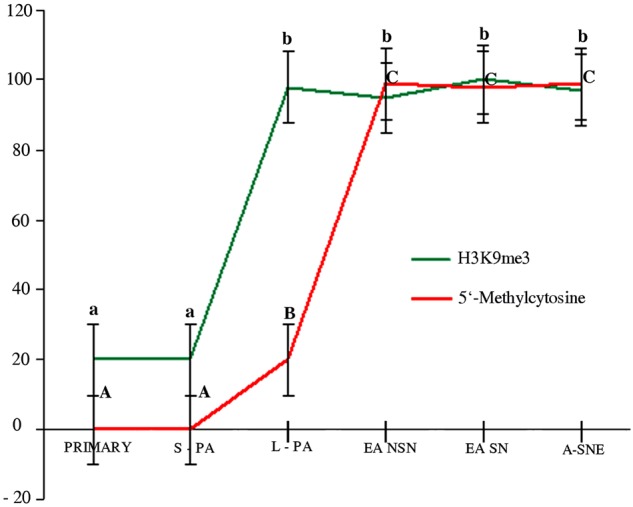
H3K9me3 (green line) and global DNA methylation (red line) total fluorescence intensity (TFI) values recorded in germ cells present in primary small (S-PA) and large (L-PA) preantral, NSN (not surrounded nucleolus chromatin) and SN (surrounded nucleolus chromatin) early antral (EA NSN, EA SN, respectively), and antral (A SNE, surrounded nucleolus and nuclear envelope chromatin) follicles. The H3K9me3 distribution revealed that primary and small preantral follicles showed a TFI value of about 20%; H3K9 trimethylation progressively increased in oocytes of large preantral follicles up to about 100%. The TFI values did not change when the oocytes reached the antral follicle stage. Instead, global DNA methylation TFI values showed that this signal progressively increased starting from oocytes belonging to large preantral follicles (about 20%) and reached the maximum TFI value in early antral follicle oocytes, which was also maintained after the oocyte reached the fully grown stage. It is also evident that H3K9me3 and global DNA methylation were strictly dependent on the follicular stage. Different superscripts denote significantly different values (p<0.05). Lowercase letters = H3K9me3; uppercase letters = global DNA methylation (5-methylcytosine).
The global DNA methylation TFI instead was undetectable in the oocytes belonging to primary and small preantral follicle categories, which progressively increased in the oocytes of large preantral follicles (p<0.05), and reached a plateau in the oocytes enclosed in early antral and antral follicles (p<0.05), independently of their chromatin configuration (Fig. 4).
Distribution Patterns of the Main Enzymes Involved in H3K9me3 and DNA Methylation
All the main enzymes involved in H3K9me3 and DNA methylation were always expressed in the GVs of all oocytes of each category of follicles analyzed (from primary to antral follicles). These molecules were always dependent on the chromatin configuration, and for this reason, enzyme distribution patterns will refer to the chromatin configuration and not to the follicular stage (Fig. 5A). Details are presented as follows.
Figure 5.

(A) Summary of all enzyme distribution patterns inside the germinal vesicles (GVs): NSN, a typical GV with a diffuse chromatin (NSN) where the analyzed enzymes show a diffuse and punctiform immunopositivity near the chromatin; SN, a GV example of an early antral follicle with a condensed chromatin around the nucleolus (SN) where the immunofluorescence of the enzymes appeared almost superimposed to the chromatin; and SNE, a GV example of an antral follicle where the chromatin is partially localized around the nucleolus and the nuclear envelope (SNE configuration). There is a clear immunopositivity for the analyzed enzymes that co-localizes perfectly with the chromatin. (B–F) Digital images of sheep GVs showing immunopositivity for HDAC1 (B), G9a (C), SUV39H1 (D), HP1 (E), and Dnmt3a (F). The enzymes are all visible in red (left images), chromatin is in blue (middle images), and merged images (right images) show both. Bar = 100 µm.
HDAC1
HDAC1 was always visualized in the GVs of all the considered oocytes. However, as shown in Figure 5B, this enzyme was widespread throughout the nucleoplasm in the oocytes with an NSN chromatin configuration, whereas it became strictly connected to the DNA as the chromatin condensed, reaching the SN and SNE configurations.
G9a and SUV39H1
Both molecules were always expressed in the examined oocytes, where they maintained a precise nuclear localization, as shown in Figure 5 (G9a, Fig. 5C; SUV39H1, Fig. 5D). However, the enzymes in NSN oocytes appeared either diffused in the nucleoplasm or as spots close to the DNA. Instead, the immunopositivity for G9a and SUV39H1 co-localized with the DNA or was distributed around it in those oocytes displaying an SN chromatin configuration to then become completely coincident with the chromatin in SNE oocytes.
HP1
HP1 immunopositivity reproduced that previously described for G9a and SUV39H1. HP1, in fact, was always expressed, conserved a nuclear localization, and displayed a closely related chromatin configuration distribution. In particular, a diffuse and scattered HP1 pattern was observed in GV oocytes with an NSN configuration, but it appeared in part coincident with the chromatin and in part as spots near the DNA in SN oocytes. Only in the oocytes belonging to antral follicles was the HP1 closely coincident with the SNE chromatin (Fig. 5E).
Dnmt3a
Dnmt3a remained sequestered within the nucleus in all categories of germ cells analyzed. The enzyme distribution, in addition, occurred in a chromatin configuration-dependent way. In particular, Dnmt3a expression resulted independent of DNA and was organized in clusters within the nucleus in the totality of NSN oocytes. Instead, Dnmt3a started to co-localize with the DNA of SN oocytes, to then become strictly associated with the condensed chromatin in SNE oocytes enclosed in antral follicles (Fig. 5F).
Discussion
In the present research, a computational model based on biological network formalism was realized using the molecules involved in the process of genome transcriptional silencing. The first aim was to identify the main enzymes involved in H3K9me3 and DNA methylation before studying their spatiotemporal expression in sheep oocytes during the postnatal phase of oogenesis.
From the network topology of computational model analysis, the most linked nodes (the hubs of the system) identified the enzymes that play a crucial role in genome silencing. Their closeness centrality value indicates that each modification of the enzyme activity inserted within the model rapidly affects all the other ones. This finding is further emphasized by the low clustering coefficient and the low path length indicated as the signal generated by each enzyme diffuses rapidly and efficiently, avoiding redundant mechanisms while maximizing the signal integrity and leading to a prompt genome remodeling. In addition, the computational model allowed, for the first time, discrimination among the several proteins discovered. Thus, our attention focused on selected enzymes identified on the basis of their topological proprieties (connectivity and closeness centrality) and their biological relevance. In particular, we have paid attention to the H3K9me3 and DNA methylation dynamics and, among the main hubs, those molecules involved in these epigenetic events for which their mRNAs have already been identified in bovine oocytes (Nowak-Imialek et al. 2008; Racedo et al. 2009), as HDACs, G9a, SUV39H1, HP1, and Dnmts, because there is a greater similarity between the oocytes of ruminants compared with other mammals (Russo et al. 2007).
In particular, the most linked nodes in the network resulted in HDACs and DNA methylation. The first event, as indicated also by its closeness centrality value, is histone deacetylation, which is considered a preliminary condition to trigger gene silencing (Vaissière et al. 2008). DNA methylation, which is the other hub of the system, biologically is required to later reinforce the process of gene inactivation. Both these events have, moreover, an intimate cross-talk (Fuks 2005) as indirectly demonstrated by the effects promoted on DNA methylation when cell cultures are performed in the presence of HDAC inhibitors (Milutinovic et al. 2007; Ou et al. 2007; Bártová et al. 2008; Raynal et al. 2012). Jointly to the first two major hubs, H3K9me3 contributes to inhibit gene transcription, working together with histone deacetylation and DNA methylation (Fuks 2005; Cheng and Blumenthal 2010; He et al. 2011; Wong et al. 2011). The activities of the histone-methyltransferases modulate the H3K9 methylation state. In this context, G9a is mainly involved in defining the trimethylated state of H3K9 in euchromatic regions (Fuks 2005) and SUV39H1 in the heterochromatic ones (Lehnertz et al. 2003). In addition, even if HP1 was not identified as one of the main nodes, it has been studied in this research because H3K9me3 is directly linked to HP1. This link may be biologically explained because H3K9me3 serves as a binding platform for HP1 recruitment (Bannister et al. 2001; Lachner et al. 2001; Munari et al. 2012). Analogously, HP1 in turn recruits Dnmts along with a multiprotein complex that also includes G9a and SUV39H1 (Estève et al. 2006; Smallwood et al. 2007), thus contributing to define an inactive condensed chromatin configuration. The machinery involved in DNA methylation (Dnmts), however, was functionally differentiated. In fact, the methylation status of DNA is influenced both by the activity of Dnmt1, essential to maintaining the degree of DNA methylation (i.e., during the process of DNA replication), and of Dnmt3a and Dnmt3b, which are required to generate a de novo methylation (Bestor 2000).
To translate the obtained indications from the computational model, an experimental setup was developed. First of all, the correlation between DNA methylation and H3K9me3 during postnatal sheep oogenesis was described on single cells in different categories of oocytes by adopting the immunohistochemistry technique. Although the quantitativity with this technique has some limits if compared with other more quantitative analyses (i.e., molecular biology), it adds important in situ and single-cell topographical information on each single molecule analyzed. In particular, the H3K9me3 fluorescence signal appeared precociously during oogenesis. It was already detectable, even if with low TFI levels, in oocytes enclosed within primary follicles. During oocyte growth, the degree of H3K9me3 gradually increased, reaching a steady-state level during the transition from large preantral to antral follicles. Also, Hou et al. (2008) have found in sheep that late GV oocytes heavily stained for H3K9me3. Instead, global DNA methylation revealed its first signs in large preantral follicles. The level of DNA methylation then increased before stabilizing in oocytes enclosed in tertiary follicles. The global DNA methylation results already have been analyzed in sheep in vivo- and in vitro-grown oocytes (Russo et al. 2007; Barboni et al. 2011), but for the first time we have studied this process also in primary follicles and simultaneously with the H3K9me3 signal. Thus, in the present study, we have observed that in sheep female germ cells, H3K9me3 precedes global DNA methylation. In fact, it was possible to observe that H3K9me3 and global DNA methylation coexisted only from the large preantral follicle germ cell stage. Both these events were strictly related to folliculogenesis but independent of chromatin configuration, which dramatically changed during the transition from secondary to tertiary follicles. This follicular transition represents, in sheep germ cells, the crucial step in which the definitive nuclear asset will be shortly acquired—more precisely, when the follicle will begin to develop the antrum (Russo et al. 2007). Our results are different from the mouse, in which the levels of the epigenetic modifications were higher in the SN oocytes than in the NSN oocytes (Kageyama et al. 2007). Moreover, the SN configuration in sheep oocytes does not represent the more advanced configuration toward ovulation. In fact, in this animal model, the DNA maintained a decondensed widespread configuration (NSN configuration) from primary up to preantral follicles, then reached a higher degree of condensation and a typical localization surrounding the nucleolus in the oocytes enclosed in early antral follicles (SN configuration). The SN configuration, which in several mammals is considered a mature and definitive chromatin configuration (Mattson and Albertini 1990; Zuccotti et al. 1995; Zuccotti et al. 2005), undergoes a further evolution in sheep oocytes. In fact, germ cells enclosed in all categories of antral follicles, from small to preovulatory ones, display a condensed chromatin that is localized partly around the nucleolus and partly around the nuclear envelope, and assumes the species-specific SNE configuration (Russo et al. 2007).
Moreover, the protein expression and subcellular distribution of the enzymes selected by the in silico approach were analyzed in all categories of follicles considered. More precisely, the attention was focused on HDAC1 (the dominant histone deacetylase described in maturing oocytes) (Huang et al. 2012), G9a, SUV39H1, HP1, and Dnmt3a, which have never been studied in sheep postnatal oogenesis. All these enzymes displayed a stable nuclear localization and a degree of DNA association that was strictly influenced by chromatin configuration. In particular, the enzymes showed close to the chromatin a diffuse and punctiform immunopositivity in those oocytes displaying an NSN configuration. They became progressively more coincident with the DNA passing from germ cells with an SN chromatin configuration to SNE oocytes, where a complete co-localization was recorded. Although a cause-effect relationship between the enzyme distribution patterns and the large-scale chromatin remodeling still remains unclear, the common spatiotemporal redistribution during the transition from the diffuse (NSN) to the condensed chromatin configurations (SN and SNE) allows us to hypothesize their close functional relationship with the structural changes of the chromatin and a role in defining the final stage of oocyte differentiation.
Differentiated oocytes need to repress gene transcription and maintain the proper organization of major heterochromatin regions (Espada et al. 2004) until meiotic maturation will be resumed and the embryonic genome will be generated from the fusion with the male gamete. The high levels of H3K9me3 and DNA methylation could be involved in this event and, collectively, the examined enzymes could contribute to the definition of these two epigenetic marks.
Interestingly, Dmnts distributions analyzed to date has strongly and indirectly demonstrated their different role in the epigenetic process during oogenesis. In fact, on the basis of its nuclear distribution, Dnmt3a seems to have a role in the definition of maternal genome imprinting rather than Dmnt1. The definition of maternal imprints is operative in oocytes enclosed from primary to preovulatory follicles, as indicated by genomic studies performed by different groups (Lucifero et al. 2004; Hiura et al. 2006; Colosimo et al. 2009; Barboni et al. 2011). Dmnt3a is the only methylating enzyme that remains active within the nucleus during the whole postnatal oogenesis, maintaining a strict interaction with the DNA until the resumption of oocyte maturation occurs. A role for Dnmt3a in imprinting definition is also confirmed by functional experiments. In fact, offspring from Dnmt3a conditional mutant female mice die in utero, displaying lack of methylation and allele-specific expression at several maternally imprinted loci (Kaneda et al. 2004). On the contrary, Dnmt1 exits from the nucleus in the later stages of follicular development, ceasing to have a functional influence on oocytes enclosed in early antral and antral follicles (Russo et al. 2007; Barboni et al. 2011). On the basis of cytoplasmic translocation timing, Dnmt1 activity may be associated with the establishment of the global DNA methylation that is already defined in the early antral follicle oocytes that is different to the imprinting program that is completely defined later. Thus, the morphological evidence that Dnmt1 is exported from the nucleus to the cytoplasm in late-growing oocytes involves, as a functional consequence, the inactivity of the enzyme and may indirectly confirm the end of the global DNA methylating process.
The results obtained in the present study suggest the existence, in sheep oocytes, of a temporally related sequential cascade of events in which H3K9me3 is the primary step followed by DNA methylation. These two epigenetic marks are probably realized also thanks to the recruitment of HDAC1, SUV39H1, G9a, HP1, Dnmt1 (Russo et al. 2007; Barboni et al. 2011), and Dnmt3a (Fig. 6).
Figure 6.

Sheep oocyte transcriptional silencing (TS) network. The node diameter is proportional to the number of links, and the color varies depending on the closeness centrality (red = 1; green = 0). The spatial network arrangement was obtained by using the yFile Hierarchical Layout. The arrows indicate the flux of the epigenetic events.
Therefore, H3K9me3 and DNA methylation seem to act synergistically to generate an epigenetic cycle directed to create a repressed chromatin state in fully differentiated oocytes and then to underlie the silencing of imprinted genes.
Moreover, the female germ cell, thanks to its epigenetic characteristics, could potentially explain how and which epigenetic enzymes are able to find their “targets” of action on the genomic sequence. In fact, in sheep oocytes, histone deacetylation may be an initial event that triggers shutdown of transcription, and DNA methylation is set to stably inactivate gene expression.
However, the spatiotemporal organization and the recruitment timing of the epigenetic mechanisms during the silencing of endogenous genes may be dependent on cell type, genomic locus, physiological context, and, more importantly, several environmental conditions (Vaissière et al. 2008). Nevertheless, the knowledge of these epigenetic mechanisms is fundamental to identifying aberrant epigenetic events and/or to recognizing the conditions responsible for anomalous histone deacetylation and DNA methylation, which can promote pathological deviations until tumor development (Vaissière et al. 2008). In oocyte differentiation, in addition, epigenetic mechanisms have another relevant functional role. The events described in the present research involving DNA methylation and H3K9 trimethylation and, as a consequence, transcriptional silencing, are crucial in defining oocyte developmental competence. For this reason, new information acquired on these relevant physiological events becomes extremely useful, because the epigenetic maturation reached from an oocyte will condition the whole embryonic program, from gametes fusion until its postnatal life, thus defining the success of female reproductive function.
Footnotes
Declaration of Conflicting Interests: The authors declared no potential conflicts of interest with respect to the research, authorship, and/or publication of this article.
Funding: The authors received no financial support for the research, authorship, and/or publication of this article.
References
- Albert R. 2005. Scale-free networks in cell biology. J Cell Sci. 118:4947–4957 [DOI] [PubMed] [Google Scholar]
- Arney KL, Erhardt S, Drewell RA, Surani MA. 2001. Epigenetic reprogramming of the genome—from the germ line to the embryo and back again. Int J Dev Biol. 45(3):533–540 [PubMed] [Google Scholar]
- Bannister AJ, Zegerman P, Partridge JF, Miska EA, Thomas JO, Allshire RC, Kouzarides T. 2001. Selective recognition of methylated lysine 9 on histone H3 by the HP1 chromo domain. Nature. 410(6824):120–124 [DOI] [PubMed] [Google Scholar]
- Barboni B, Russo V, Cecconi S, Curini V, Colosimo A, Garofalo ML, Capacchietti G, Di Giacinto O, Mattioli M. 2011. In vitro grown sheep preantral follicles yield oocytes with normal nuclear-epigenetic maturation. PLoS One. 6(11):e27550. [DOI] [PMC free article] [PubMed] [Google Scholar]
- Bártová E, Krejcí J, Harnicarová A, Galiová G, Kozubek S. 2008. Histone modifications and nuclear architecture: a review. J Histochem Cytochem. 56(8):711–721 [DOI] [PMC free article] [PubMed] [Google Scholar]
- Bestor TH. 1992. Activation of mammalian DNA methyltransferase by cleavage of a Zn binding regulatory domain. EMBO J. 11:2611–2617 [DOI] [PMC free article] [PubMed] [Google Scholar]
- Bestor TH. 2000. The DNA methyltransferases of mammals. Hum Mol Genet. 9(16):2395–2402 [DOI] [PubMed] [Google Scholar]
- Bollobás B. 1979. Graph theory: an introductory course. New York: Springer Verlag [Google Scholar]
- Bouniol-Baly C, Hamraoui L, Guibert J, Beaujean N, Szollosi MS, Debey P. 1999. Differential transcriptional activity associated with chromatin configuration in fully grown mouse germinal vesicle oocytes. Biol Reprod. 60(3):580–587 [DOI] [PubMed] [Google Scholar]
- Cecconi S, Barboni B, Coccia M, Mattioli M. 1999. In vitro development of sheep preantral follicles. Biol Reprod. 60(3):594–601 [DOI] [PubMed] [Google Scholar]
- Cheng X, Blumenthal RM. 2010. Coordinated chromatin control: structural and functional linkage of DNA and histone methylation. Biochemistry. 49(14):2999–3008 [DOI] [PMC free article] [PubMed] [Google Scholar]
- Colosimo A, Di Rocco G, Curini V, Russo V, Capacchietti G, Berardinelli P, Mattioli M, Barboni B. 2009. Characterization of the methylation status of five imprinted genes in sheep gametes. Anim Genet. 40(6): 900–908 [DOI] [PubMed] [Google Scholar]
- De La Fuente R. 2006. Chromatin modifications in the germinal vesicle (GV) of mammalian oocytes. Dev Biol. 292(1):1–12 [DOI] [PubMed] [Google Scholar]
- De La Fuente R, Viveiros MM, Burns KH, Adashi EY, Matzuk MM, Eppig JJ. 2004. Major chromatin remodeling in the germinal vesicle (GV) of mammalian oocytes is dispensable for global transcriptional silencing but required for centromeric heterochromatin function. Dev Biol. 275(2):447–458 [DOI] [PubMed] [Google Scholar]
- Dean W, Lucifero D, Santos F. 2005. DNA methylation in mammalian development and disease. Birth Defects Res C Embryo Today. 75(2):98–111 [DOI] [PubMed] [Google Scholar]
- Espada J, Ballestar E, Fraga MF, Villar-Garea A, Juarranz A, Stockert JC, Robertson KD, Fuks F, Esteller M. 2004. Human DNA methyltransferase 1 is required for maintenance of the histone H3 modification pattern. J Biol Chem. 279(35):37175–37184 [DOI] [PubMed] [Google Scholar]
- Estève PO, Chin HG, Smallwood A, Feehery GR, Gangisetty O, Karpf AR, Carey MF, Pradhan S. 2006. Direct interaction between DNMT1 and G9a coordinates DNA and histone methylation during replication. Genes Dev. 20(22):3089–3103 [DOI] [PMC free article] [PubMed] [Google Scholar]
- Fuks F. 2005. DNA methylation and histone modifications: teaming up to silence genes. Curr Opin Genet Dev. 15(5):490–495 [DOI] [PubMed] [Google Scholar]
- Gu L, Wang Q, Sun QY. 2010. Histone modifications during mammalian oocyte maturation: dynamics, regulation and functions. Cell Cycle. 9(10):1942–1950 [DOI] [PubMed] [Google Scholar]
- He XJ, Chen T, Zhu JK. 2011. Regulation and function of DNA methylation in plants and animals. Cell Res. 2011;21(3):442–465 [DOI] [PMC free article] [PubMed] [Google Scholar]
- Hiura H, Obata Y, Komiyama J, Shirai M, Kono T. 2006. Oocyte growth-dependent progression of maternal imprinting in mice. Genes Cells. 11(4):353–361 [DOI] [PubMed] [Google Scholar]
- Hou J, Liu L, Zhang J, Cui XH, Yan FX, Guan H, Chen YF, An XR. 2008. Epigenetic modification of histone 3 at lysine 9 in sheep zygotes and its relationship with DNA methylation. BMC Dev Biol. 8:60. [DOI] [PMC free article] [PubMed] [Google Scholar]
- Huang J, Li T, Ding CH, Brosens J, Zhou CQ, Wang HH, Xu YW. 2012. Insufficient histone-3 lysine-9 deacetylation in human oocytes matured in vitro is associated with aberrant meiosis. Fertil Steril. 97(1):178–184.e3 [DOI] [PubMed] [Google Scholar]
- Jones PA, Baylin SB. 2002. The fundamental role of epigenetic events in cancer. Nat Rev Genet. 3(6):415–428 [DOI] [PubMed] [Google Scholar]
- Kageyama S, Liu H, Kaneko N, Ooga M, Nagata M, Aoki F. 2007. Alterations in epigenetic modifications during oocyte growth in mice. Reproduction. 133(1):85–94 [DOI] [PubMed] [Google Scholar]
- Kaneda M, Okano M, Hata K, Sado T, Tsujimoto N, Li E, Sasaki H. 2004. Essential role for de novo DNA methyltransferase Dnmt3a in paternal and maternal imprinting. Nature. 429(6994):900–903 [DOI] [PubMed] [Google Scholar]
- Kono T. 1998. Influence of epigenetic changes during oocyte growth on nuclear reprogramming after nuclear transfer. Reprod Fertil Dev. 10(7–8):593–598 [DOI] [PubMed] [Google Scholar]
- Lachner M, O’Carroll D, Rea S, Mechtler K, Jenuwein T. 2001. Methylation of histone H3 lysine 9 creates a binding site for HP1 proteins. Nature. 410(6824):116–120 [DOI] [PubMed] [Google Scholar]
- Lehnertz B, Ueda Y, Derijck AA, Braunschweig U, Perez-Burgos L, Kubicek S, Chen T, Li E, Jenuwein T, Peters AH. 2003. Suv39h-mediated histone H3 lysine 9 methylation directs DNA methylation to major satellite repeats at pericentric heterochromatin. Curr Biol. 13(14):1192–1200 [DOI] [PubMed] [Google Scholar]
- Li E. 2002. Chromatin modification and epigenetic reprogramming in mammalian development. Nat Rev Genet. 3(9):662–673 [DOI] [PubMed] [Google Scholar]
- Lodde V, Modina S, Galbusera C, Franciosi F, Luciano AM. 2007. Large-scale chromatin remodeling in germinal vesicle bovine oocytes: interplay with gap junction functionality and developmental competence. Mol Reprod Dev. 74(6):740–749 [DOI] [PubMed] [Google Scholar]
- Lucifero D, Mann MR, Bartolomei MS, Trasler JM. 2004. Gene-specific timing and epigenetic memory in oocyte imprinting. Hum Mol Genet. 13(8):839–849 [DOI] [PubMed] [Google Scholar]
- Mager J, Bartolomei MS. 2005. Strategies for dissecting epigenetic mechanisms in the mouse. Nat Genet. 37(11):1194–1200 [DOI] [PubMed] [Google Scholar]
- Mattioli M, Barboni B, Turriani M, Galeati G, Zannoni A, Castellani G, Berardinelli P, Scapolo PA. 2001. Follicle activation involves vascular endothelial growth factor production and increased blood vessel extension. Biol Reprod. 65(4):1014–1019 [DOI] [PubMed] [Google Scholar]
- Mattson BA, Albertini DF. 1990. Oogenesis: chromatin and microtubule dynamics during meiotic prophase. Mol Reprod Dev. 25(4):374–383 [DOI] [PubMed] [Google Scholar]
- Milutinovic S, D’Alessio AC, Detich N, Szyf M. 2007. Valproate induces widespread epigenetic reprogramming which involves demethylation of specific genes. Carcinogenesis. 28(3):560–571 [DOI] [PubMed] [Google Scholar]
- Morgan HD, Santos F, Green K, Dean W, Reik W. 2005. Epigenetic reprogramming in mammals. Hum Mol Genet. 14(Spec No. 1):R47–R58 [DOI] [PubMed] [Google Scholar]
- Munari F, Soeroes S, Zenn HM, Schomburg A, Kost N, Schroeder S, Klingberg R, Rezaei-Ghaleh N, Stuetzer A, Gelato KA, et al. 2012. Methylation of K9 in histone H3 directs alternative modes of highly dynamic interaction of heterochromatin protein hHP1β with the nucleosome. J Biol Chem. 287(40):33746–33765 [DOI] [PMC free article] [PubMed] [Google Scholar]
- Nagase H, Ghosh S. 2008. Epigenetics: differential DNA methylation in mammalian somatic tissues. FEBS J. 275(8):1617–1623 [DOI] [PubMed] [Google Scholar]
- Nowak-Imialek M, Wrenzycki C, Herrmann D, Lucas-Hahn A, Lagutina I, Lemme E, Lazzari G, Galli C, Niemann H. 2008. Messenger RNA expression patterns of histone-associated genes in bovine preimplantation embryos derived from different origins. Mol Reprod Dev. 75(5):731–743 [DOI] [PubMed] [Google Scholar]
- Ogawa H, Ishiguro K, Gaubatz S, Livingston DM, Nakatani Y. 2002. A complex with chromatin modifiers that occupies E2F- and Myc-responsive genes in G0 cells. Science. 296:1132–1136 [DOI] [PubMed] [Google Scholar]
- Okano M, Bell DW, Haber DA, Li E. 1999. DNA methyltransferases Dnmt3a and Dnmt3b are essential for de novo methylation and mammalian development. Cell. 99:247–257 [DOI] [PubMed] [Google Scholar]
- Ou JN, Torrisani J, Unterberger A, Provençal N, Shikimi K, Karimi M, Ekström TJ, Szyf M. 2007. Histone deacetylase inhibitor Trichostatin A induces global and gene-specific DNA demethylation in human cancer cell lines. Biochem Pharmacol. 73(9):1297–1307 [DOI] [PubMed] [Google Scholar]
- Prokhortchouk A, Hendrich B, Jørgensen H, Ruzov A, Wilm M, Georgiev G, Bird A, Prokhortchouk E. 2001. The p120 catenin partner Kaiso is a DNA methylation-dependent transcriptional repressor. Genes Dev. 15(13):1613–1618 [DOI] [PMC free article] [PubMed] [Google Scholar]
- Racedo SE, Wrenzycki C, Lepikhov K, Salamone D, Walter J, Niemann H. 2009. Epigenetic modifications and related mRNA expression during bovine oocyte in vitro maturation. Reprod Fertil Dev. 21(6):738–748 [DOI] [PubMed] [Google Scholar]
- Raynal NJ, Si J, Taby RF, Gharibyan V, Ahmed S, Jelinek J, Estécio MR, Issa JP. 2012. DNA methylation does not stably lock gene expression but instead serves as a molecular mark for gene silencing memory. Cancer Res. 72(5):1170–1181 [DOI] [PMC free article] [PubMed] [Google Scholar]
- Rea S, Eisenhaber F, O’Carroll D, Strahl BD, Sun ZW, Schmid M, Opravil S, Mechtler K, Ponting CP, Allis CD, et al. 2000. Regulation of chromatin structure by site-specific histone H3 methyltransferases. Nature. 406(6796):593–599 [DOI] [PubMed] [Google Scholar]
- Riccio A, Aaltonen LA, Godwin AK, Loukola A, Percesepe A, Salovaara R, Masciullo V, Genuardi M, Paravatou-Petsotas M, Bassi DE, et al. 1999. The DNA repair gene MBD4 (MED1) is mutated in human carcinomas with microsatellite instability. Nat Genet. 23(3):266–268 [DOI] [PubMed] [Google Scholar]
- Russo V, Berardinelli P, Martelli A, Di Giacinto O, Nardinocchi D, Fantasia D, Barboni B. 2006. Expression of telomerase reverse transcriptase subunit (TERT) and telomere sizing in pig ovarian follicles. J Histochem Cytochem. 54(4):443–455 [DOI] [PubMed] [Google Scholar]
- Russo V, Martelli A, Berardinelli P, Di Giacinto O, Bernabò N, Fantasia D, Mattioli M, Barboni B. 2007. Modifications in chromatin morphology and organization during sheep oogenesis. Microsc Res Tech. 70(8):733–744 [DOI] [PubMed] [Google Scholar]
- Schultz DC, Ayyanathan K, Negorev D, Maul GG, Rauscher FJ., III 2002. SETDB1: a novel KAP-1-associated histone H3, lysine 9-specific methyltransferase that contributes to HP1-mediated silencing of euchromatic genes by KRAB zincfinger proteins. Genes Dev. 16:919–932 [DOI] [PMC free article] [PubMed] [Google Scholar]
- Smallwood A, Estève PO, Pradhan S, Carey M. 2007. Functional cooperation between HP1 and DNMT1 mediates gene silencing. Genes Dev. 21(10):1169–1178 [DOI] [PMC free article] [PubMed] [Google Scholar]
- Swales AK, Spears N. 2005. Genomic imprinting and reproduction. Reproduction. 130(4):389–399 [DOI] [PubMed] [Google Scholar]
- Tachibana M, Sugimoto K, Nozaki M, Ueda J, Ohta T, Ohki M, Fukuda M, Takeda N, Niida H, Kato H, et al. 2002. G9a histone methyltransferase plays a dominant role in euchromatic histone H3 lysine 9 methylation and is essential for early embryogenesis. Genes Dev. 16(14):1779–1791 [DOI] [PMC free article] [PubMed] [Google Scholar]
- Tan JH, Wang HL, Sun XS, Liu Y, Sui HS, Zhang J. 2009. Chromatin configurations in the germinal vesicle of mammalian oocytes. Mol Hum Reprod. 15(1):1–9 [DOI] [PubMed] [Google Scholar]
- Vaissière T, Sawan C, Herceg Z. 2008. Epigenetic interplay between histone modifications and DNA methylation in gene silencing. Mutat Res. 659(1–2):40–48 [DOI] [PubMed] [Google Scholar]
- Vespignani A. 2003. Evolution thinks modular. Nat Genet. 35(2):118–119 [DOI] [PubMed] [Google Scholar]
- Wade PA, Gegonne A, Jones PL, Ballestar E, Aubry F, Wolffe AP. 1999. Mi-2 complex couples DNA methylation to chromatin remodelling and histone deacetylation. Nat Genet. 23(1):62–66 [DOI] [PubMed] [Google Scholar]
- Wong CM, Wong CC, Ng YL, Au SL, Ko FC, Ng IO. 2011. Transcriptional repressive H3K9 and H3K27 methylations contribute to DNMT1-mediated DNA methylation recovery. PLoS One. 8;6(2):e16702. [DOI] [PMC free article] [PubMed] [Google Scholar]
- Yang L, Xia L, Wu DY, Wang H, Chansky HA, Schubach WH, Hickstein DD, Zhang Y. 2002. Molecular cloning of ESET, a novel histone H3-specific methyltransferase that interacts with ERG transcription factor. Oncogene. 21(1):148–152 [DOI] [PubMed] [Google Scholar]
- Zhang Y, Ng HH, Erdjument-Bromage H, Tempst P, Bird A, Reinberg D. 1999. Analysis of the NuRD subunits reveals a histone deacetylase core complex and a connection with DNA methylation. Genes Dev. 13(15):1924–1935 [DOI] [PMC free article] [PubMed] [Google Scholar]
- Zhang Y, Reinberg D. 2001. Transcriptional regulation by histone methylation: interplay between different covalent modifications of the core histone tails. Genes Dev. 15:2343–2360 [DOI] [PubMed] [Google Scholar]
- Zuccotti M, Garagna S, Merico V, Monti M, Alberto Redi C. 2005. Chromatin organisation and nuclear architecture in growing mouse oocytes. Mol Cell Endocrinol. 234(1–2):11–17 [DOI] [PubMed] [Google Scholar]
- Zuccotti M, Piccinelli A, Giorgi Rossi P, Garagna S, Redi CA. 1995. Chromatin organization during mouse oocyte growth. Mol Reprod Dev. 41(4):479–485 [DOI] [PubMed] [Google Scholar]