Abstract
Histone deacetylase (HDAC) inhibitors are potent anticancer agents and show efficacy against various human neoplasms. Vorinostat is a potent HDAC inhibitor and has shown potential to inhibit growth of human xenograft tumors. However, its effect on the growth of skin neoplasm remains undefined. In this study, we show that vorinostat (2μM) reduced expression of HDAC1, 2, 3, and 7 in epidermoid carcinoma A431 cells. Consistently, it increased acetylation of histone H3 and p53. Vorinostat (100mg/kg body weight, IP) treatment reduced human xenograft tumor growth in highly immunosuppressed nu/nu mice. Histologically, the vorinostat-treated tumor showed features of well-differentiation with large necrotic areas. Based on proliferating cell nuclear antigen (PCNA) staining and expression of cyclins D1, D2, E, and A, vorinostat seems to impair proliferation by down-regulating the expression of these proteins. However, it also induced apoptosis. The mechanism by which vorinostat blocks proliferation and makes tumor cells prone to apoptosis, involved inhibition of mTOR signaling which was accompanied by reduction in cell survival AKT and extracellular-signal regulated kinase (ERK) signaling pathways. Our data provide a novel mechanism-based therapeutic intervention for cutaneous squamous cell carcinoma (SCC). Vorinostat may be utilized to cure skin neoplasms in organ transplant recipient (OTRs). These patients have high morbidity and surgical removal of these lesions which frequently develop in these patients, is difficult.
Keywords: Vorinostat, Histone deacetylase inhibitors, mTOR, skin cancer
Introduction
More than 2.5 million cases of non-melanoma skin cancer (NMSC) exist in the United States of America as estimated by the American Cancer Society (Society AC, 2011). These neoplasms include both basal cell carcinoma (BCC) and squamous cell carcinoma (SCC). Exposure to ultraviolet light B (UVB) is a major etiologic factor for the pathogenesis of these cancers (Diepgen and Mahler, 2002). Besides the high prevalence of these cancers in normal caucasian populations with fair skin phenotype, individuals with impaired immune function, for example, those receiving chronic immunosuppressive medication after organ transplantation, are at a further increased risk and develop much aggressive and invasive NMSCs (Aberg et al., 2011; Euvrard et al., 2003). Skin cancer is among the most frequent OTRs cancer and its aggressiveness depends upon the level of immunosuppression (Alam et al., 2011; Zwald and Brown, 2011). Cumulative risk for this and other cancers in OTRs also increases with the duration of immunosuppression (Zwald et al., 2011). Carroll et al. (2003) showed that the incidence of NMSC increases from 19% at fewer than 5 years to 47% after more than 20 years of immunosuppressive therapy.
Currently, surgical excision of histological defined margins remains gold standard therapy for the majority of cutaneous SCCs (Motley et al., 2002). However, considering the high morbidity among OTRs, repetitive surgical procedures to remove these cancers is often frustrating. Moreover, some of these lesions are also known to be metastasized in these patients. Based on these notions, we tested whether vorinostat (suberoylanilidine hydroxamic acid), the first HDAC inhibitor approved by the U.S. Food and Drug Administration (USFDA) for cutaneous T cell lymphoma (CTCL) (Mann et al., 2007) is also effective against cutaneous SCCs. Vorinostat has been extensively evaluated for its effectiveness against various cancers such as prostate cancer, breast cancer, renal cell carcinoma, mantle cell lymphoma, lung cancer, and melanoma (Butler et al., 2000; Facchetti et al., 2004; Komatsu et al., 2006; Mahalingam et al., 2010; Xargay-Torrent et al., 2011; Uehara et al., 2012). It is currently listed for various clinical trials as a single agent or in combination therapy (Wagner et al., 2010; Ramaswamy et al., 2011).
In this study, we report that vorinostat suppresses proliferation of epidermoid carcinoma A431 cells in vitro. Vorinostat administration also blocks growth of human xenograft epidermoid SCCs in highly immunosuppressed nu/nu mice. Its mechanism of chemotherapeutic effects has also been investigated here.
Materials and Methods
Preparation of Lent-virus
Constitutively active myr-flag-AKT (Addgene, Cambridge, MA) was PCR amplified and subcloned into the EcoRI and BamHI site of pLVX-puro or pLVX-IRES-zsgreen vectors (Clontech, Mountain View, CA). The primers used were Forward 5′-GCTAGCGAATTCGCCGCCACCATGGGGTCTTCAAAATCTAAACCAAAG and Reverse 5′-CTCGAGAGATCTTCAGGCCGTGCCGCTGGCCGAGTAG. Plasmids containing the myr-flag-AKT insert or control pLVX plasmids without an insert were cotransfected with packaging plasmids (Invitrogen Virapower Lentiviral Expression Systems, Carlsbad, CA) using Polyfect transfection reagent (Qiagen, Valencia, CA). Supernatants containing viral particles were harvested at 48 hrs and 72 hrs post-transfection. Cells (A431) were plated in 6-well plates and allowed to adhere for 24 h before infection. Cells were infected in the presence of polybrene (6 μg/ml) overnight and the following day media was replaced. After 24 hrs, cells were selected by treating with media containing puromicin (1 μg/ml) for pLVX-myr-flag-AKT. No antibiotic selection was used for pLVX-myr-flag-AKT-IRES-zsgreen.
Cells
Human epidermoid carcinoma cells A431 (CRL-1555) were obtained from American Type Culture Corporation (Manassas VA). Cells were cultured in Dulbecco’s modified eagle’s medium (DMEM) supplemented with 10% fetal bovine serum, 100 U/ml of penicillin and 100 μg/ml of streptomycin at 37°C in a humidified atmosphere of 5% CO2.
Animals
Female mice (Athymic nu/nu, 3–5 weeks, 25–30 g) were purchase from NCI-Frederick Animal Production Program (Frederick, MD, USA).
Ethics Statement
All experiments were approved by the University of Alabama at Birmingham Institutional Animal Care and Use Committee (IACUC). This study was performed in accordance with guidelines of IACUC. Animal protocol approval number is 08363.
Antibodies and reagents
Primary antibodies and dilutions used in this study are listed in table-1. Vorinostat was purchased from LC laboratories (Woburn, MA, USA).
Table 1.
Antibody information
| Antibody | Company | Purpose | Dilution |
|---|---|---|---|
| Ac-Histone H3 | Santa Cruz | Western Blot | 400 |
| Ac-p53 K379 | Cell signaling | Western Blot, IF | 1000 |
| Ac-p53 K386 | Abcam | Western Blot, IF | 1000 |
| Akt 1/2/3 H-136 | Santa Cruz | Western Blot | 400 |
| Bax | Cell Signaling | Western Blot | 1000 |
| Bcl2 | Cell signaling | Western Blot | 1000 |
| Cleaved caspase-3 | Cell signaling | Western Blot | 1000 |
| Cyclin D1 | Santa Cruz | Western Blot | 500 |
| Cyclin D2 | Santa Cruz | Western Blot | 500 |
| Cyclin A | Santa Cruz | Western Blot | 500 |
| Cyclin E | Santa Cruz | Western Blot | 500 |
| E-cadherin | Santa cruz | Western Blot | 500 |
| Fibronectin | Abcam | Western Blot | 1000 |
| HDAC-1 | Santa Cruz | Western Blot, IHC | 500 |
| HDAC-2 | Santa Cruz | Western Blot, IHC | 500 |
| HDAC-3 | Santa Cruz | Western Blot | 500 |
| HDAC4/5/7 | Santa Cruz | Western Blot | 500 |
| HDAC-6 | Santa Cruz | Western Blot | 400 |
| N-cadherin | Santa Cruz | Western Blot, IF | 500 |
| PCNA | Santa Cruz, | Western Blot | 500 |
| PCNA | Abcam | IHC | 500 |
| Phospho Akt1/2/3 thr-308 | Santa Cruz | Western Blot | 200 |
| Phospho Akt1/2/3 ser-473 | Santa Cruz | Western Blot | 200 |
| Phospho- P-S6 Ribosomal protein Ser-235/236 | Cell Signaling | Western Blot | 1000 |
| phospho-P70 S6 kinase Thr-389 | Cell Signaling | Western Blot | 1000 |
| Phospho-4E-BP1 Ser-6 | Cell Signaling | Western Blot | 1000 |
| Phospho 44/42 MAPK | Cell Signaling | Western Blot | 1000 |
| P-44/42 MAPK (ERK ½) | Cell Signaling | Western Blot | 1000 |
| S6 ribosomal protein | Cell Signaling | Western Blot | 1000 |
| p70 S6 kinase | Cell Signaling | Western Blot | 1000 |
| 4E-BP1 | Cell Signaling | Western Blot | 1000 |
| p21 cip1/waf1 | Cell Signaling | Western Blot | 1000 |
| Vimentin | Santa Cruz | IF | 100 |
| goat anti-rabbit | Pierce | 3000 | |
| goat anti-mouse | Pierce | 3000 | |
| mouse anti-goat | Pierce | 3000 | |
| Bax | Santa Cruz | IF | 100 |
IHC- Immunohistochemistry; IF- Immunofluorescence
Tumor xenograft study
Female athymic nu/nu mice (3–5 weeks old) were injected subcutaneously with 2.5×10⁶ A431 cells which were harvested and suspended in PBS for injection into both flanks. Mice with palpable tumors were divided into two groups (five mice/group) for the study. Vorinostat stock solution made in DMSO and cremophor and stored at −20°C. Group 1 mice received an injection of vehicle (PBS) whereas group 2 received vorinostat (100 mg/Kg body weight in 200 μl PBS; I.P.) daily for 3 weeks. Vorinostat treatment was started at day 3 following the tumor cell inoculation. These animals were monitored daily to assess toxicity if any associated with the treatments. Tumor volume was monitored using electronic caliper on every alternate day and tumor volume was calculated using following formula: . The experiment was terminated at the end of 3 weeks, when the vehicle-treated animals had large tumors, requiring euthanasia. At this time, all the animals were also sacrificed by isoflurane inhalation and cervical dislocation as per IACUC guidelines. The subcutaneous tumor was removed and divided into two pieces, one of which was snap frozen in liquid nitrogen, and the other was fixed in 10% buffered formalin and embedded in paraffin. The control group used in this study is common to that which we have published earlier (Chaudhary et al., 2012). In fact, two experiments conducted simultaneously with various treatments incorporating single vehicle treated positive control to avoid unnecessary escalation in the numbers of animals (Chaudhary et al., 2012).
Hematoxylin and eosin (H&E) and Immunohistochemical (IHC) staining
Tumors tissues were fixed in 10% formalin and embedded in paraffin. Tumor tissues were cut into sections (5 μm) using microtome (Thermo scientific HM 325). Sections were deparaffinized in xylene and rehydrated. Tumor sections from each group were stained with H&E and examined for tumor histology. For immunohistochemical staining, sections were deparaffinized and rehydrated and then incubated in antigen unmasking solution according to the manufacturer’s instructions (Vector laboratories, Burlingame, CA, USA). A blocking buffer of 2% BSA in PBS for 30 min at 37°C was used to avoid nonspecific binding of antibodies and then incubated with primary antibodies specific to PCNA, HDAC1and HDAC2. The sections were detected by a universal peroxidase-coupled secondary antibody and visualized with peroxidase staining kit (Vector laboratories, Burlingame, CA, USA). Sections were counterstained with hematoxylin and eosin (H&E), and mounted with cover slips using paramount and visualized under 20X or 40X magnifications under Olympus BX51TRF microscope attached to an Olympus DP71 digital camera (Tokyo, Japan).
Immunocytochemical analysis of Bax translocation
A431 cells (2×10⁵) were cultured in four wells chambered slides (Nunc, Rochester, NY) and exposed to vorinostat (2 μM) for 24 hrs. At the completion of exposure, cells were stained with (250 nM) of MitoTracker Red (Invitrogen, Grand Island, NY) for 20 minute at 37°C followed by two washes with PBS. Then cells were fixed in methanol for 30 min, permeabilized with 0.1% Triton X-100 for 15 min and again washed with PBS. Cells were blocked for 1 hr with 2% bovine serum albumin (BSA) and incubated with primary antibody overnight at 4°C. Polyclonal Bax antibodies were used as the primary antibody. Cells were then washed three times with PBS, followed by incubation with daylight 488 (Pierce, Rockford, IL) fluorescence secondary goat-anti-rabbit antibody for 1 hr at room temperature. After a second rinsing step with PBS, the cells were incubated with Hoechst 33342 (Invitrogen, Grand Island, NY) to counter stain cell nuclei for 5 min at room temperature. Labeled cells were examined with fluorescence microscopy.
Terminal deoxyribonucleotide-transferase-mediated dUTP nick-end labeling (TUNEL) assay
TUNEL assay of tumor sections was performed using a commercial apoptosis detection kit (Roche Diagnostics, Indianapolis, IN) according to the manufacturer’s instruction. Sections were mounted with vectashield mounting substance containing DAPI (Vector laboratories, Burlingame, CA) and visualized using an Olympus BX51TRF microscope with an Olympus DP71 digital camera (Tokyo, Japan) under 20X magnification.
Cell cytotoxicity assay
A431 cell viability was assessed by 3-(4,5-dimethylthiazol-2-yl)-2-5- diphenyl tetrazolium bromide (MTT) (LC laboratories, Woburn, MA, USA) assay. Briefly, 10,000 cells per well were seeded into 96-well culture plates at 37°C with 5% CO2 and allowed to attach for 24 hrs. Cells were treated with designated concentration of vorinostat (1–5 μM) for 24 and 48 hrs. Cells were then incubated with MTT assay solution at a final concentration of 0.5 mg/ml for 4 hrs before the completion of exposure time at 37°C. Formation of MTT to formazon crystals by viable cells was assessed using 200 μl/well DMSO at room temperature for 15 min. Optical density was measured at 490 nm using a 1420 multilable counter VICTOR3 -V (Perkin Elmer, Shelton, CT, USA) The reduction in viability of cells in each well was expressed as the percentage of control cells.
Clonogenic survival assay
A431 cells were seeded into 6-well plates at very low density of 800 cells per well and were allowed to grow overnight. Cells were treated with vorinostat (2 μM) or vehicle for 48 hrs. Drug or vehicle-treatment was replaced by fresh drug-free media and cells were incubated for additional 10 days in humidified chamber at 37°C with 5% CO2. Cell colonies were fixed with cold methanol, stained with crystal violet, washed and air-dried. Blue colonies were scored and photographed. Each condition was replicated in triplicate. Data expressed as percent survival relative to the control using the formula: .
Wound-healing assay
Briefly, A431 cells were allowed to grow in 6-well plates to 100% confluency as monolayer. Following serum starvation for 24 hrs, cell monolayers were wounded with a sterile 200 μl pipette tip perpendicular to the line drawn, washed with starvation medium to remove detached cells from the plates. Cells were left either untreated or treated with vorinostat and kept in incubator for 24 hrs. Medium was replaced with PBS. The wound gap was photographed using an upright Olympus 1X70-58F2 microscope fitted with Olympus DP20 digital camera (Olympus optical company ltd., Japan).
Migration assay
The migration capacity of human epidermoid cancer cells was determined using Boyden Chamber in which the two chambers were separated with Millipore membrane (6.5 mm diameter filters, 8 μm pore size). Briefly, A431 cells (1.5×10⁴ cells/200 μL of low serum DMEM medium) were placed in the upper chamber of Boyden chamber. Vorinostat or vehicle was added to the upper chamber and the lower chamber contained the medium alone (150 μl). Chambers were placed in an incubator for 24 hrs. At the end of desired time-point, cells from the upper surface of Millipore membranes were removed with gentle swabbing and the migrant cells on the lower surface of membranes were fixed with methanol and stained with crystal violet. Membranes were then washed and mounted onto glass slides. The membranes were examined microscopically and cell migration was determined by counting the number of stained cells in at least four to five randomly selected fields visualized with Olympus BX51TRF microscope with an Olympus DP71 digital camera (Tokyo, Japan). Data represented as percentage of mean number of the cells migrated. The experiment was repeated three times.
Western blot analysis
Briefly, 40–100 μg of total protein from tumor tissue lysates was electrophoresed on 10%, 15% and 8% polyacrylamide gel (Bio-Rad, Hercules, CA, USA). The protein was transferred, via electrotransfer, to a PVDF membrane. Non-specific binding sites were blocked with 5% non-fat milk in tris-buffered saline with 0.1% tween (TBST) and then membranes were incubated with primary antibody overnight at 4°C. After washing with TBST, the membranes were incubated with appropriate horseradish peroxidase (HRP)–conjugated secondary antibody for 1 hr. The immune-complex was detected with enhanced chemiluminscent substrate (ECL) according to the manufacturer’s instructions (Amersham, Piscataway, NJ) and was exposed to Hyblot CL autoradiography film (Denville Scientific Incorporated, Metuchen, NJ, USA). For sequential antibody reprobing, blots were stripped using Restore plus Western Blot Stripping Buffer (Pierce Biotechnology, Rockford, IL) according to manufacturer’s instructions. These blots are presented in different figures and identical β-actin loading controls represent stripping and reprobing with the same blot as denoted by symbol ‘†’ in various figures. Band densities were measured using NIH Image J software and results were normalized to corresponding β-actin band densities.
Immunofluorescence staining
A431 cells were grown on cover slips and allowed to attach overnight. Next day the cells were treated with vorinostat for 24 hrs. Media containing vorinostat was removed and cells were fixed by adding chilled methanol and blocked in 2% bovine serum albumin (BSA) for 1 hr followed by addition of primary antibody overnight at 4°C. The tumor, sections were deparaffinized, rehydrated, blocked and probed with primary antibody as described in immunohistochemical staining procedure. Tumor sections or cells were rinsed with PBS and positive cells were detected by Alexa-fluor 594 (Invitrogen, Carlsbad, CA, USA), Daylight 488 (Pierce, Rockford, IL) fluorescence secondary antibody for 1 hr. Cells adhering to cover slips mounted with Vectashield mounting substance containing DAPI (Vector laboratories) and visualized under fluorescence microscope using an upright Olympus BX51TRF microscope with an Olympus DP71 digital camera (Tokyo, Japan).
Statistical analysis
All values are expressed as means ± SE. Statistical analysis was performed using Microsoft Excel 2007. The significance between the two test groups was determined using Student’s t-test. p<0.05 were considered significant (*) and p<0.005 described as highly significant (**).
Results
Vorinostat reduces tumor growth, proliferation and induces apoptosis in A431 xenograft tumors
We examined antiproliferative effect of vorinostat in a xenograft study. Xenograft tumors were treated with either vehicle as control or vorinostat at 100 mg/kg dose intraperitoneally (n=5). When mean tumor volume was plotted against the study duration, there was an arrest in tumor growth (p=0.038 at day 21) starting from day 10 which continued till the end of experiment as shown in fig 1A. H&E staining of tumor sections showed round nuclei and abundant cytoplasm in vehicle-treated group (Fig 1B). In vorinostat-treated tumors, marked coagulative necrosis, dark nuclei, and fragmented tumor cells with disruption of tissue architecture was observed. Vorinostat decreased the in vivo proliferation of tumor cells as shown by the decreased PCNA expression by IHC (Fig 1B) and western blot analysis (Fig 1C).
Figure 1. Vorinostat inhibits on tumor growth, proliferation and apoptosis.
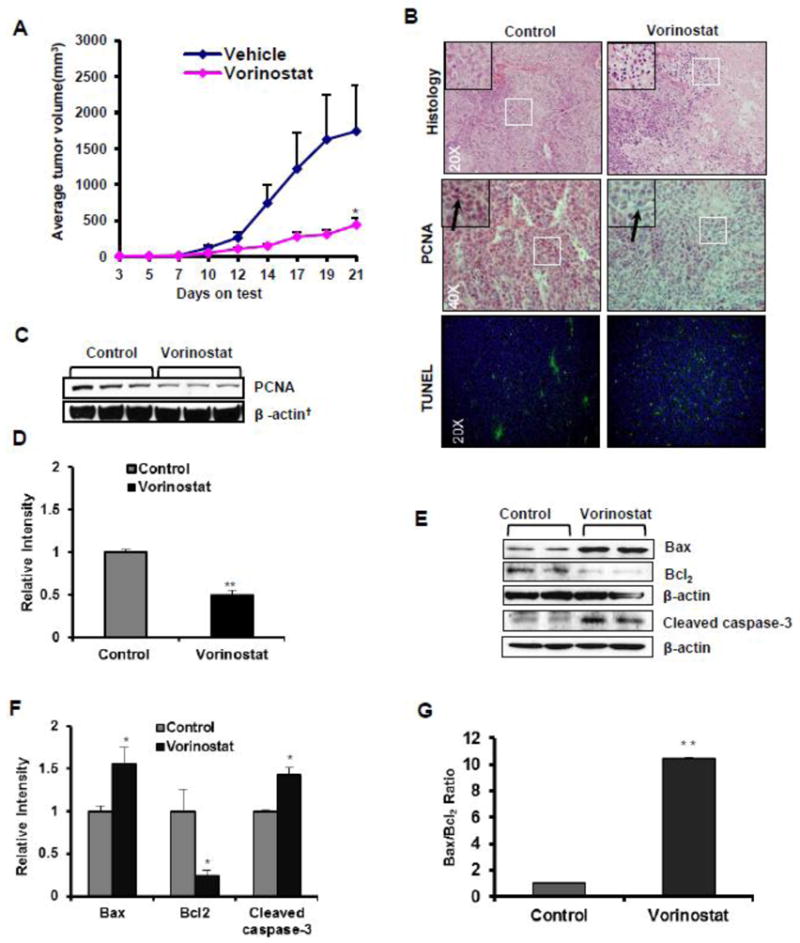
(A) Graph showing mean tumor volume plotted against the study duration. Treatment was started day 3 of tumor cell inoculation. Significant reduction of average tumor volume in nu/nu mice treated with vehicle (n=5) or vorinostat (n=5) (*p=0.038). (B) Representative photographs of H&E (20X magnification), IHC (PCNA) expression (40X magnification) and TUNEL staining (20X magnification). (C) Western blot (WB) analysis of PCNA (**p=0.001) in control and vorinostat-treated tumors. (D) Relative densitometry analysis of PCNA WB. (E) Western blot analysis of Bax, Bcl2 and Cleaved caspase-3 protein isolated from excised xenograft tumor tissue. (F&G) Relative densitometry analysis of Bax (*p=0.041), Bcl2 (*p=0.027), Bax/Bcl2 ratio (*P=0.010) and Cleaved caspase-3 (*p=0.036). Values in parenthesis represent the level of statistical significance when compared with vehicle-treated controls. Results normalized to corresponding β-actin band densities.
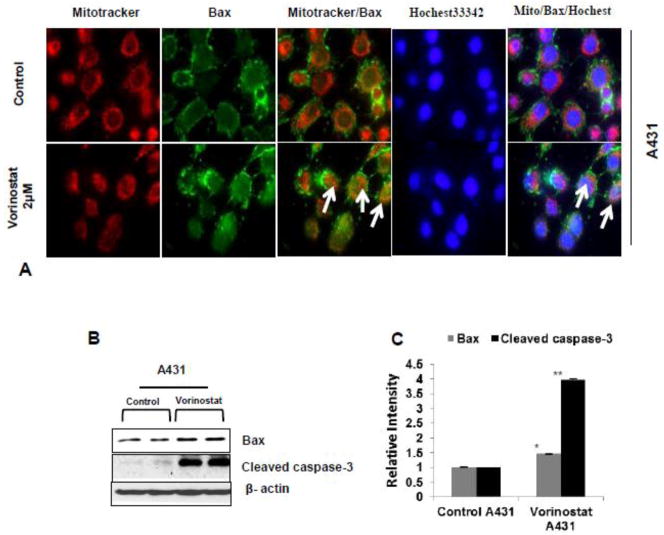
To further investigate whether vorinostat induces apoptosis in xenograft tumors, TUNEL staining was performed. Enhanced numbers of TUNEL-positive cells were noticed in the vorinostat-treated group (Fig 1B). The cysteine-aspartic acid protease (caspase) family of proteins has a central role regulating apoptosis. Activation of caspase-3 by caspases-8 and-9 is the key process in the execution of apoptosis (Yan and Shi et al., 2005). Results showing increased apoptosis in vorinostat-treated group by TUNEL assay were confirmed by western blot analysis. Caspase-3 was cleaved following vorinostat treatment (*P=0.036) (Fig 1E & F). Bcl2, an anti-apoptotic protein was reduced significantly (*p=0.027) whereas pro-apoptotic Bax (also see Fig. 2b & C) was increased (*p=0.041). The ratio of Bax/Bcl2 which is considered to be a more reliable indicator of apoptosis was shifted in favor of apoptosis (*p=0.010) as shown in Fig 1G. To further confirm the role of Bax in vorinostat-induced apoptosis, the translocation of Bax from cytosol to mitochondria was studied by immunofluroscent localization in A431 cells. Vorinostat treatment to these cells induced translocation of Bax to mitochondria as shown in Fig 2A.
Figure 2. Vorinostat persuaded apoptosis by influencing translocation of Bax protein to mitochondria.
(A) Vorinostat treated and untreated A431 cells were stain with MitoTracker (Red) and Bax (green). Arrows in the representative photograph showed the translocation of Bax protein from cytosol to mitochondria in vorinostat (2 μM) treated A431 cells. (B) Western blot of Bax and Cleaved caspase-3 protein is significantly up-regulated in vorinostat (2 μM) treated A431 cell line. (C) Relative densitometry analysis of Bax (A431 *P=0.007) and Cleaved caspase-3 (A431 **P=0.001) in vorinostat (2 μM) treated cells.
Vorinostat inhibits expression of various HDACs and acetylated histone and non-histone proteins
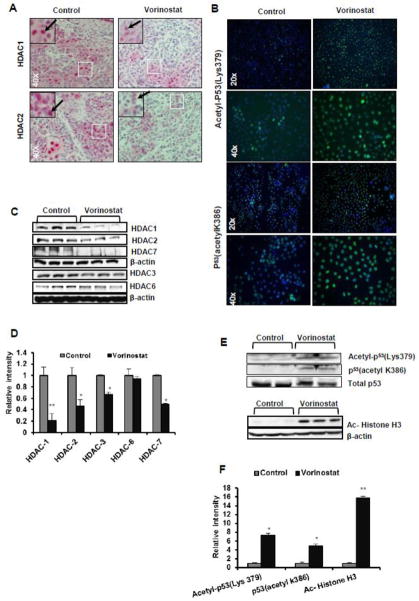
In a parallel set of experiments, we investigated whether the mechanism of vorinostat-induced cytotoxicity on A431 cells was HDAC-dependent. In western blot analysis we found that the expression of HDAC1 (**p=0.004), HDAC2 (*p=0.025), and HDAC3 (*p=0.016) were significantly reduced by vorinostat treatment as shown in Fig 3C & D. We also observed a significant down-regulation of HDAC7 (*p=0.032). However, no effect was found on HDAC6 expression (p=0.765) as shown in Fig 3C & D. Similar results were observed in IHC analysis of vorinostat-treated tumor sections (Fig 3A). Subsequently, we studied acetylation status of histone and non-histone proteins in A431 xenograft tumors. A strong expression signal of acetylated histone H3 in vorinostat-treated tumors (**p<0.0001) was detected (Fig 3E & F). Next, we assessed acetylation of p53 at both lysine 379 and lysine 386 sites (Fig 3E). We found an increased acetylation of p53 at both of these sites (*p=0.020 and *p=0.065). Immunofluorescence analysis of A431 cells in vitro showed similar results with enhanced acetylation in vorinostat-treated cells (Fig 3B).
Figure 3. Vorinostat reduces expression of various HDACs and enhances acetylated histone and non-histone proteins.
(A) IHC analysis of HDAC1 and 2 in vehicle-treated control and vorinostat-treated tumors sections (40X magnification). (B) A431 cells were treated with vorinostat (2 μM) for 24 hrs and subjected to Immunofluorescence analysis (20X and 40X magnifications) with indicated antibodies. (C) WB analysis of HDACs (1, 2, 3, 6 and 7) of protein isolated from excised xenograft tumor tissue. (D) Relative densitometry analysis of HDAC1 (**p=0.004), HDAC2 (*p=0.025), HDAC3 (*p=0.016), HDAC7 (*p=0.032), HDAC6 (p= 0.768). (E&F) WB and relative densitometry analysis p53 (acetyl K386) (p=0.065), Acetyl-p53 (Lys379) (*p=0.020) and for Ac-Histone H3 (**p<0.0001).
Vorinostat inhibits cell cycle regulatory proteins and reduces phosphorylation of extracellular-signal regulated kinase (ERK1/2)
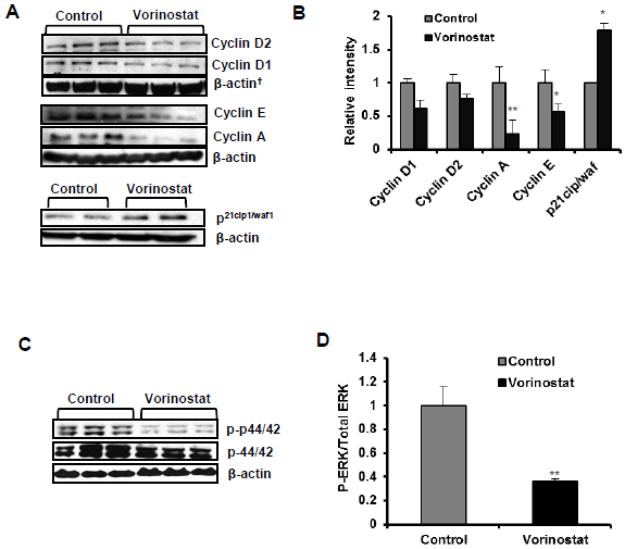
Based on our findings where we found that vorinostat inhibits PCNA and induces apoptosis, we decided to explore the possible effects of vorinostat on cell cycle regulatory proteins. As demonstrated in Fig 4A & B, treatment with vorinostat resulted in the reduction of cyclin expression (cyclins D1, D2, E and cyclin A). These effects were more pronounced for cyclin A (**p=0.002) and cyclin E (*p=0.015) than for cyclin D1 (p= 0.069) and D2 (p=0.220). The cell cycle inhibitory protein, p21cip1/waf1 is also known as CDK-interacting protein 1 (CIP1) was induced (*p=0.056) following vorinostat treatment (Fig 4A & B). Activation of ERK is known to regulate proliferation (Karam et al., 2012). Therefore, we investigated whether vorinostat reduced cell viability by altering cell survival pathway. We assessed the expression of total and phosphorylated ERK proteins. Vorinostat reduced the phosphorylation of ERK1/2 significantly (*p=0.014) as shown in Fig 4D & E.
Figure 4. Vorinostat blocks cell cycle progression and activation of ERK1/2.
(A) WB analysis for cell cycle regulatory proteins in vehicle-treated control and vorinostat-treated group. Cyclin D1 (p=0.069), Cyclin D2 (p=0.220), Cyclin A (**p=0.002), Cyclin E (*p=0.015) and p21cip1/waf1 (*p=0.057). (B) Image J analysis of cell cycle regulatory proteins. Results normalized to corresponding β-actin band densities. (C) WB analysis of ERK1/2 signaling proteins: p-44/42 (p=0.379) and p-p44/42 (*p= 0.014). (D) Image J analysis for ERK1/2 proteins.
Vorinostat effectively targets cell survival signaling pathways
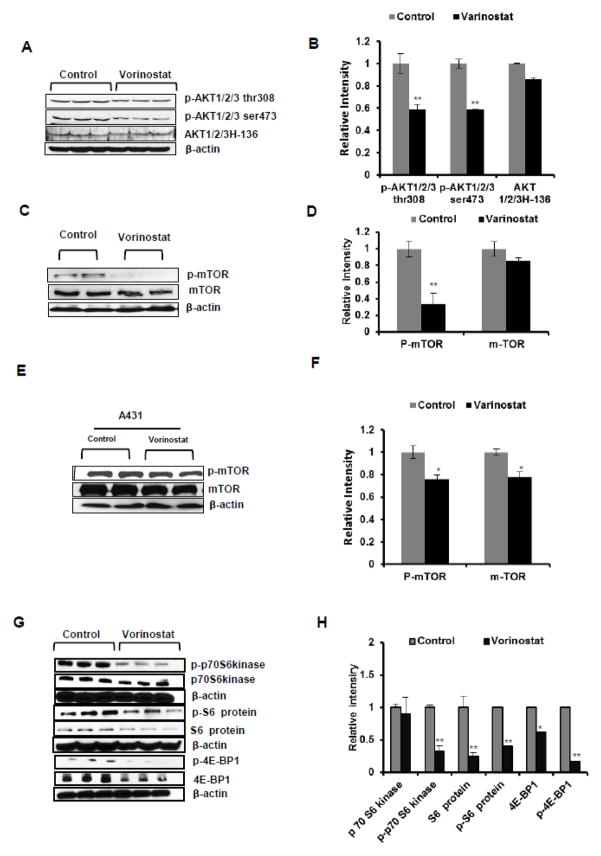
To determine whether multiple proliferation pathways are inhibited by vorinostat, we also assessed the effects of vorinostat on cell survival signaling pathway regulated by Akt and its downstream target proteins. A reduced phosphorylation of Akt at both Thr308 (**p=0.004) and Ser473 (**p=0.001) in vorinostat-treated tumors was observed while no significant change in the total AKT expression (p=0.19) was noticed (Fig 5A & B). Similarly, phosphorylation of the downstream target of AKT, mTOR was also found to be significantly reduced both in vivo in vorinostat-treated xenograft tumor (Fig 5C & D) as well as in vitro in A431 cells (Fig 5E & F). Phosphorylation of downstream targets of mTOR such as S6 ribosomal protein (**p=0.004), p70S6 kinase (**p=0.001) and 4E-BP1 (**p=0.003) were significantly reduced in vorinostat-treated tumors as compared to vehicle-treated control tumors (Fig 5G & H). These data indicate that vorinostat acts by inhibiting AKT/mTOR signaling pathway axis.
Figure 5. Vorinostat dampens cell survival signaling pathway.
(A & B) WB and relative densitometry analysis for AKT/mTOR signaling markers. p-AKT1/2/3 Thr308 (*p=0.004), p-AKT1/2/3 ser473 (*p=0.001), AKT1/2/3 (*p=0.19) significantly reduced in vorinostat treatment group of mice. (C&D) WB and densitometry analysis of p-mTOR (*P=0.04) and total m-TOR (P=0.15) in vorinostat treated group represent significant reduction of p-mTOR level. (E&F) WB and densitometry analysis of p-mTOR (*P=0.027) and total mTOR (*P=0.009) levels in vorinostat (2μM) treated A431 cells. (G&H) WB and relative densitometry analysis mTOR signaling proteins, p-p70S6 kinase (**P=0.001), p70S6 kinase (P=0.976), p-S6 ribosomal protein (**P=0.004), S6 ribosomal protein (**P=0.005), p-4E-BP1 (**p=0.003) and 4E-BP1 (*p=0.033).
Vorinostat inhibits cell growth, colony formation and migration of A431 cells
Vorinostat has been reported to inhibit proliferation of different carcinoma cell lines (Butler et al., 2000; Komatsu et al., 2006; Wedel et al., 2011). A similar effect on proliferation was noted in this investigation both in vitro and in vivo. In an MTT assay, vorinostat reduced cell proliferation in concentration and time-dependent manner in A431 cells (Fig 6A).
Figure 6. Vorinostat inhibits cell proliferation and colony formation in A431 cells.
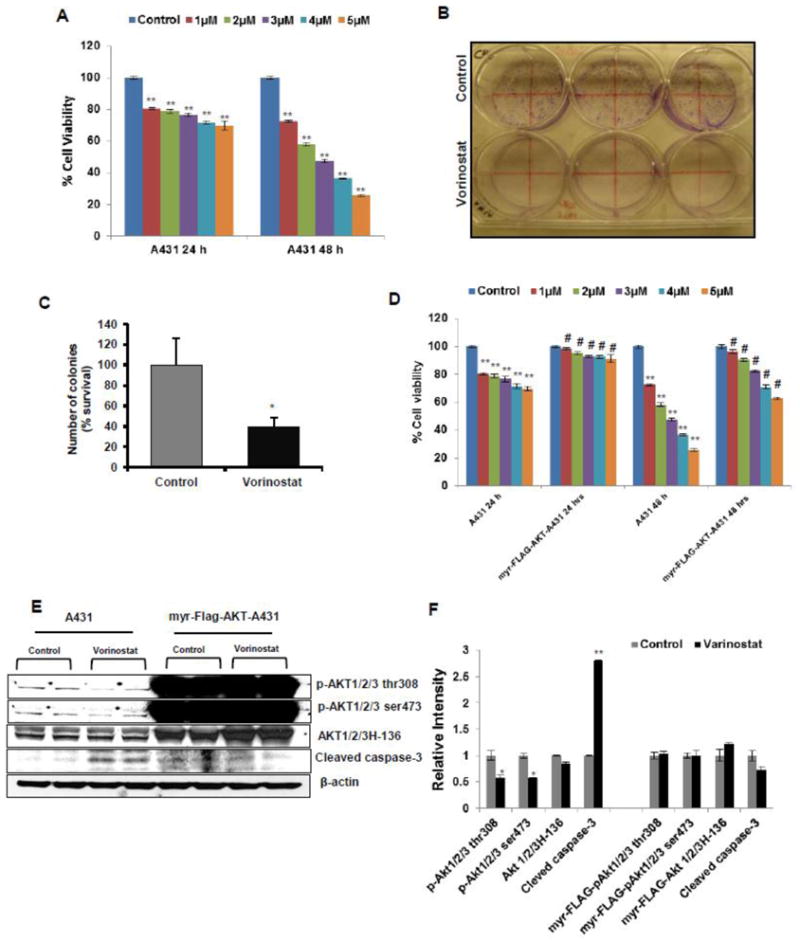
(A) MTT assay to check proliferation shown at 24 and 48 hrs following treatment with vorinostat at various concentrations in A431 cells. Data expressed as the percentage compared to untreated control cells. (B) Photograph for A431 cells treated with vorinostat (2 μM) for clonogenic/colony formation assay. (C) Graphical representation for colony formation assay. Results expressed as percentage survival relative to control ±SE (*p=0.021). (D) Over expression of myr-Flag-AKT in transduced A431 cells significantly restores the cell viability in vorinostat (1–5 μM) exposed cells at both 24 and 48 hrs treatment in comparison to normal A431 cells. (E) WB analysis of normal A431 and overexpressed myr-Flag-AKT transduced A431 cells. (F) Relative densitometry analysis showed Vorinostat (2 μM) significantly diminished the level of p-AKT1/2/3 thr 308 (*P=0.042) and p-AKT1/2/3 ser 473 (*P=0.006) and up-regulate the level of cleaved caspase-3 (**P=0.004) in normal A431 cells while myr-Flag-AKT over expressing cells do not show increased caspase 3 cleavage in the presence of vorinostat.
For colony formation/clonogenic assay as shown in Fig 6B, vorinostat not only reduced the number of colonies formed but also decreased the size of colonies. Calculation of percent survival of number of colonies compared to control is shown in Fig 5C (*p=0.021).
We also confirmed these findings in constitutively active myr-FLAG-AKT in A431 cells (Fig 6E & F). Transduced A431 cells significantly up-regulated cell survival in vorinostat (1–5 μM)-treated cells as compared to control untreated A431 cells. Similarly, vorinostat treatment of myr-FLAG-AKT infected A431 cells did not induce cleaved caspase-3 in contrast to its effects on A431 cells expressing endogenous AKT levels where a significant down-regulation of p-AKT1/2/3 thr308 (*P=0.042), p-AKT1/2/3 ser473 (*P=0.006) and a concomitant up-regulation of cleaved caspase-3 (**P=0.004) were observed. Constitutively active GFP tagged myr-FLAG-AKT green were confirmed under the fluorescent microscopy (Supplementary figure S-1). In another set of experiments, A431 cells infected with control pLVX, without myr-FLAG AKT, when treated with vorinostat (1–5 μM) showed a significant reduction in cell viability similar to that observed in uninfected A431 cells (Supplementary figure S-2).
Inhibition in proliferation is often accompanied by changes in tumor cell phenotype. Therefore, we determined whether treatment of A431 cell with vorinostat reduces cellular migration. At a low concentration (0.5 μM), vorinostat was found to reduce the migration capacity of A431 cells in scratch/wound healing assay (Fig 7A). Similarly, in Boyden chamber assays, as seen by the crystal violet staining of membrane of untreated and vorinostat-treated cells (Fig 7B), vorinostat treatment significantly reduced the invasion of A431 cells. Fig 7C shows a graph plotted as percentage of mean number of cells migrated following vehicle or vorinostat treatment (*p=0.010).
Figure 7. Vorinostat abrogates invasive tumor phenotype in A431 cells.
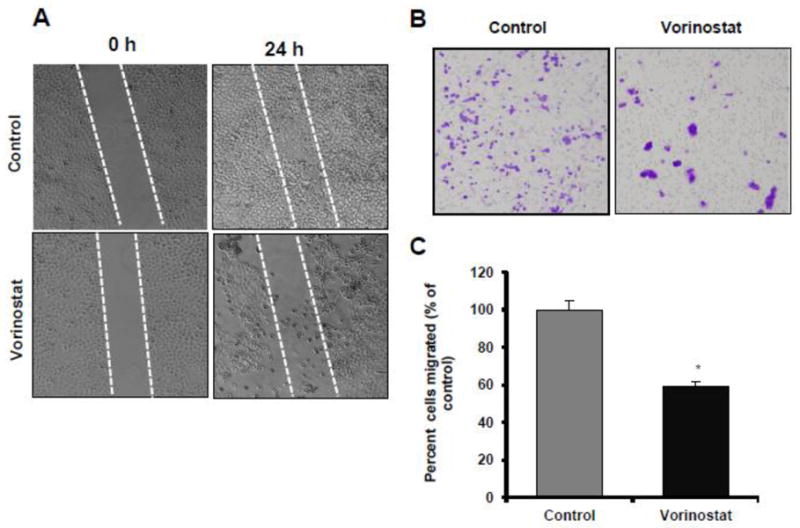
(A) Photographs showing scratch/wound healing assay after treatment with or without vorinostat (0.5 μM). Photographs are shown at 0 and 24 hrs. (B) Cell migration was checked by Boyden chamber assay with (0.5 μM) of vorinostat (10Xmagnification). (C) Graph for migration assay. Results expressed as percentage of migratory cells compared to control (±SE) per microscopic field (*p=0.010).
Vorinostat reverses epithelial-mesenchymal transition (EMT)
To understand the molecular mechanism of inhibition in migratory potential of A431 cells, we assessed various epithelial and mesenchymal biomarkers. As assessed by western blot analysis (Fig 8A & B), the expression of the epithelial biomarker, E-cadherin was increased (*p=0.038) whereas mesenchymal biomarkers such as N-cadherin (*p=0.059) and fibronectin (p=0.063) were decreased following vorinostat treatment. Similar results were observed by immunofluorescence staining of A431 cells with N-cadherin and vimentin antibodies (Fig 8C).
Figure 8. Vorinostat enhances cell polarity and reduces mesenchyme character.
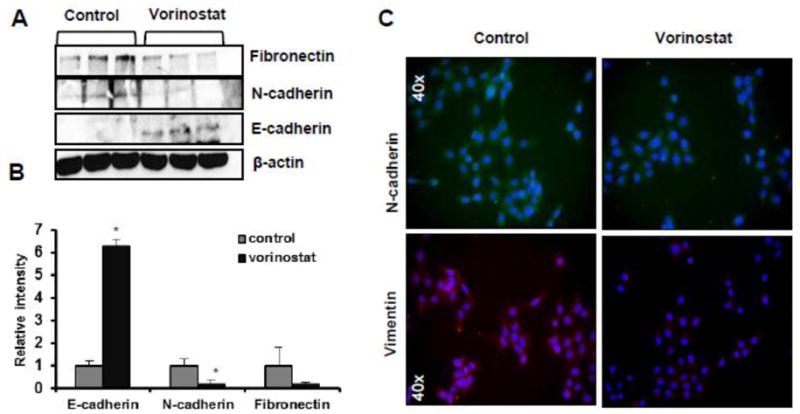
(A) WB analysis for E-cadherin (*p=0.038), N-cadherin (*p=0.059) and fibronectin (p=0.074). (B) Image J analysis for EMT markers. (C) Immunofluorescence staining for EMT biomarkers in A431 cells following vorinostat treatment (2 μM) for 24 hrs (40 X magnifications).
Discussion
The covalent modification of histones that associate with DNA influences chromatin structure and gene expression. Aberrant epigenetic changes have been shown to play critical roles in the development and progression of various cancer types (Dashwood and HO, 2007). HDACs are important targets for molecular cancer therapeutics. HDACs catalyze the removal of acetyl groups from lysine residues in histone as well as non-histone proteins (Dashwood and HO, 2007; Wagner et al., 2010; Carew et al., 2008). Studies have suggested that HDACs play important roles in cell cycle progression, cell proliferation, and differentiation (Mark et al., 2000; Bi and Jiang, 2006). The multiple isoforms of HDACs (HDAC1 to HDAC11), which are classified as class I (HDAC1,2,3,8), class IIa (HDAC4,5,7,9), class IIb (HDAC6,10) and Class IV (HDAC11) (Wagner et al., 2010; Carew et al., 2008; Ellis and Pili, 2010) have both distinct and overlapping functions. Interestingly variety of HDAC inhibitors have been shown effective agents against a variety of aggressive SCCs (Lglesias-Linares et al., 2010; Giommarelli et al., 2010; Erlich et al., 2012). However, their potential to block cutaneous SCCs as a single agent has not been described.
Here we show that vorinostat acts as potent chemotherapeutic agent against cutaneous SSCs. Vorinostat decreased levels of various cyclins (cyclins D1, D2, E and cyclin A). However, the effect was more pronounced on G2-related cell cycle regulatory proteins. These data suggest that vorinostat acts by dampening cell cycle progression by down-regulating the expression of multiple proteins involved in this process. This is also consistent with our observations that vorinostat up-regulates p21cip1/waf1, a cell cycle inhibitory protein. Thus the major target of vorinostat is to block proliferation via inhibiting cell cycle regulatory machinery. Vorinostat-treated residual tumors show reduced nuclear PCNA expression further supports this notion.
Induction of apoptosis is considered as one of the mechanisms of action of chemotherapeutic drugs and an important phenomenon in eliminating cancer cells by these drugs (Makin and Hickman, 2000). Apoptosis is triggered by two important pathways: “extrinsic”/death receptor pathway and the “intrinsic”/mitochondrial pathway (Yan and Shi, 2005). HDAC inhibitors-induced apoptosis have been shown to involve the activation of both of these pathways (Rosato et al., 2003). In this study, vorinostat initiated caspase-3-mediated apoptosis which involved down-regulation of Bcl2 and up-regulation of Bax, with a concomitant translocation of Bax to the mitochondria, causing alterations in mitochondrial membrane permeability and subsequent release of cytochrome C (Fig. 2).
Nagakawa et al. (2007) studied expression patterns of class-1 HDACs in various cancer cell lines and primary tissue samples of colon, esophagus, prostate, lung, breast, thyroid, ovary carcinoma. Moreover Chang et al. showed that HDAC2 protein is frequently over-expressed in oral squamous cell carcinoma (OSCC) with advanced stage and showed its role in tumor invasion and migration (Chang et al., 2011). HDACs have also been shown to be important regulators of tumor suppressor p53 and p63 in skin (Ramsey et al., 2011). In refractory SCCs, these deacetylases may play an important role (LeBoeuf et al., 2010). Our observations that HDAC1, 2, 3, and 7 were down regulated following vorinostat treatment which was accompanied the hyper-acetylation of histone H3 and p53 suggest that the primary underlying target of action of vorinostat remains the HDACs inhibition. Although we have data to show here that HDAC inhibition affects cell cycle progression, proliferation and apoptosis, the exact demonstration, whether inhibition of multiple HDACs by this agent is related to cell cycle inhibition and dictates a diminution of proliferation and enhancement of apoptosis remained to be defined.
AKT/mTOR pathway is crucial for cell survival and growth (Hsu et al., 2011) cell growth is controlled by the careful regulation of protein synthesis. In response to nutrients availability and mitogenic growth factor stimuli, the mammalian target of rapamycin (mTOR) controls cell growth by activating the ribosomal S6 and p70S6 kinase and inhibiting the elongation-initiation factor 4E binding protein-1 (4E-BP1) that lead to protein translation (Fingar et al., 2004). Recently, Einspahr et al. (2012) studies employed reverse phase protein microarray analysis to identify cell signaling derangements in SCC. They found that numerous signaling proteins are disrupted in SCCs. Among these mitogen-activated protein kinase (MAPK/ERK) and mTOR signaling were aberrantly activated in these cancers. HDAC inhibition in human colorectal cancer cells exhibits reduced epidermal growth factor receptor (EGFR) expression and disturbed ERK and AKT phosphorylation (Chou et al., 2011). Our study showed that inhibition of cellular proliferation, migration and induction of apoptosis by vorinostat was accompanied by a down-regulation of ERK and AKT/mTOR signaling pathway axis suggesting that vorinostat by inhibiting HDACs in cutaneous SSCs targets multiple proliferation and growth regulatory pathways. Our AKT overexpression studies confirmed the role of cell survival signaling pathways in the toxicity of vorinostat to cancer cells.
Epithelial–mesenchymal transition (EMT), a process by which cells undergo a transition from a polarized epithelial to a motile mesenchymal phenotype by losing their cell–cell adhesion properties, is considered important in achieving an invasive tumor phenotype (Thiery, 2002). Cadherins are among the important mediators of EMT. Earlier, we found that NO-exisulind treatment decreases the expression of mesenchymal markers, Fibronectin, N-cadherin, SNAIL, Slug and Twist and enhances the epithelial marker E-cadherin during the pathogenesis of UVB-induced skin tumors (Singh et al., 2012). Similarly, in this study we found that vorinostat treatment effectively up-regulates the expression of E-cadherin and down-regulates the expression of N-cadherin in A431 xenogarft tumors. Our results confirmed the previously published study in which the HDAC inhibitor vorinostat enhances the antitumor effect of gefitinib in squamous cell carcinoma of head and neck by modulating ErbB receptor expression and reverting EMT (Bruzzese et al., 2011).
In summary, our results show that, vorinostat can block pathogenesis of aggressive cutaneous SCCs and can be used as potential chemotherapeutic agent to intercept the growth of cutaneous SCCs particularly in high risk OTRs.
Supplementary Material
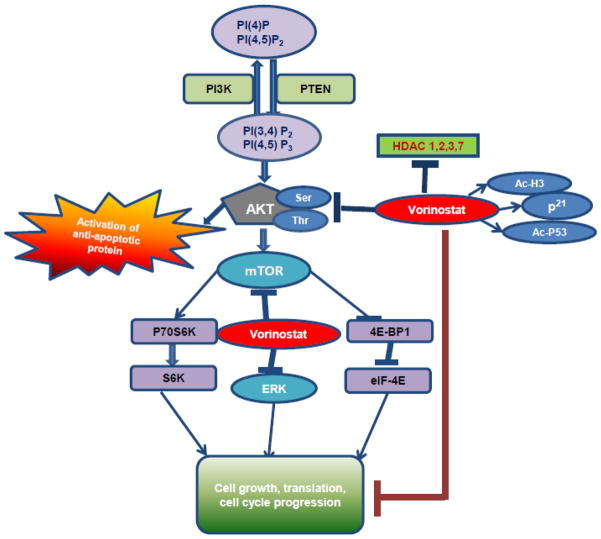
Figure 9. Flow diagram depicting mechanism by which vorinostat blocked growth of cutaneous SCCs.
Vorinostat reduces the expressions level of HDAC1&2. Additionally, HDAC3 and HDAC7 protein levels were also diminished in this study. This decrease in HDAC expression leads to enhanced acetylation of histone-H3 and non-histone proteins like p53. Vorinostat treatment reduced cell survival signaling pathways invoked by AKT phosphorylation at Ser473 and Thr308. Concomitant with this, a reduction in mTOR and ERK signaling pathways occur that together blocked growth of invasive cutaneous SCCs.
Highlights.
Vorinostat reduces SCCs growth in a xenograft murine model.
Vorinostat dampens proliferation and induces apoptosis in tumor cells.
Diminution in mTOR, Akt and ERK signaling underlies inhibition in proliferation.
Vorinostat by inhibiting HDACs inhibits epithelial-mesenchymal transition.
Acknowledgments
This work has been supported in part by R01CA138998 and funding provided by the Department of Dermatology/Cancer center of the UAB to M.A. We also thank NINDS neurobiology core facility-C P30NS047466 for assistance.
Footnotes
Conflict of interest
The authors disclose that there is no conflict of interest.
Publisher's Disclaimer: This is a PDF file of an unedited manuscript that has been accepted for publication. As a service to our customers we are providing this early version of the manuscript. The manuscript will undergo copyediting, typesetting, and review of the resulting proof before it is published in its final citable form. Please note that during the production process errors may be discovered which could affect the content, and all legal disclaimers that apply to the journal pertain.
References
- Aberg F, Isoniemi H, Hockerstedt K. Long-term results of liver transplantation. Scand J Surg. 2011;100:14–21. doi: 10.1177/145749691110000104. [DOI] [PubMed] [Google Scholar]
- Alam M, Brown RN, Silber DH, Mullen GM, Feldman DS, Oren RM, Yancy CW. Increased incidence and mortality associated with skin cancers after cardiac transplant. Am J Transplant. 2011;11:1488–1497. doi: 10.1111/j.1600-6143.2011.03598.x. [DOI] [PubMed] [Google Scholar]
- Bi G, Jiang G. The molecular mechanism of HDAC inhibitors in anticancer effects. Cell Mol Immunol. 2006;3:285–290. [PubMed] [Google Scholar]
- Bruzzese F, Leone A, Rocco M, Carbone C, Piro G, Caraglia M, Di Gennaro E, Budillon A. HDAC inhibitor vorinostat enhances the antitumor effect of gefitinib in squamous cell carcinoma of head and neck by modulating ErbB receptor expression and reverting EMT. J Cell Physiol. 2011;9:2378–2390. doi: 10.1002/jcp.22574. [DOI] [PubMed] [Google Scholar]
- Butler LM, Agus DB, Scher HI, Higgins B, Rose A, Cordon-Cardo C, Thaler HT, Rifkind RA, Marks PA, Richon VM. Suberoylanilide hydroxamic acid, an inhibitor of histone deacetylase, suppresses the growth of prostate cancer cells in vitro and in vivo. Cancer Res. 2000;60:5165–5170. [PubMed] [Google Scholar]
- Carew JS, Giles FJ, Nawrocki ST. Histone deacetylase inhibitors: mechanisms of cell death and promise in combination cancer therapy. Cancer Lett. 2008;269:7–17. doi: 10.1016/j.canlet.2008.03.037. [DOI] [PubMed] [Google Scholar]
- Carroll RP, Ramsay HM, Fryer AA, Hawley CM, Nicol DL, Harden PN. Incidence and prediction of nonmelanoma skin cancer post-renal transplantation: a prospective study in Queensland, Australia. Am J Kidney Dis. 2003;41:676–683. doi: 10.1053/ajkd.2003.50130. [DOI] [PubMed] [Google Scholar]
- Chang CC, Lin BR, Chen ST, Hsieh TH, Li YJ, Kuo MY. HDAC2 promotes cell migration/invasion abilities through HIF-1alpha stabilization in human oral squamous cell carcinoma. J Oral Pathol Med. 2011;40:567–575. doi: 10.1111/j.1600-0714.2011.01009.x. [DOI] [PubMed] [Google Scholar]
- Chaudhary SC, Kurundkar D, Elmets CA, Kopelovich L, Athar M. Metformin, an Antidiabetic Agent Reduces Growth of Cutaneous Squamous Cell Carcinoma by Targeting mTOR Signaling Pathway(†) Photochem Photobiol. 2012;5:1149–1156. doi: 10.1111/j.1751-1097.2012.01165.x. [DOI] [PMC free article] [PubMed] [Google Scholar]
- Chou CW, Wu MS, Huang WC, Chen CC. HDAC inhibition decreases the expression of EGFR in colorectal cancer cells. PLoS One. 2011;6:e18087. doi: 10.1371/journal.pone.0018087. [DOI] [PMC free article] [PubMed] [Google Scholar]
- Dashwood RH, Ho E. Dietary histone deacetylase inhibitors: from cells to mice to man. Semin Cancer Biol. 2007;17:363–369. doi: 10.1016/j.semcancer.2007.04.001. [DOI] [PMC free article] [PubMed] [Google Scholar]
- Diepgen TL, Mahler V. The epidemiology of skin cancer. Br J Dermatol. 2002;61:1–6. doi: 10.1046/j.1365-2133.146.s61.2.x. [DOI] [PubMed] [Google Scholar]
- Einspahr JG, Calvert V, Alberts DS, Curiel-Lewandrowski C, Warneke J, Krouse R, Stratton SP, Liotta L, Longo C, Pellicani G, Prasad A, Sagerman P, Bermudez Y, Deng J, Bowden GT, Petricoin EF, 3rd, Einspahr JG, Calvert V, Alberts DS, Curiel-Lewandrowski C, Warneke J, Krouse R, Stratton SP, Liotta L, Longo C, Pellicani G, Prasad A, Sagerman P, Bermudez Y, Deng J, Bowden GT, Petricoin EF. Functional protein pathway activation mapping of the progression of normal skin to squamous cell carcinoma. Cancer Prev Res (Phila) 2012;5:403–413. doi: 10.1158/1940-6207.CAPR-11-0427. [DOI] [PMC free article] [PubMed] [Google Scholar]
- Ellis L, Pili R. Histone Deacetylase Inhibitors: Advancing Therapeutic Strategies in Hematological and Solid Malignancies. Pharmaceuticals (Basel) 2010;3:2411–2469. doi: 10.3390/ph3082441. [DOI] [PMC free article] [PubMed] [Google Scholar]
- Erlich RB, Kherrouche Z, Rickwood D, Endo-Munoz L, Cameron S, Dahler A, Hazar-Rethinam M, de Long LM, Wooley K, Guminski A, Saunders NA. Preclinical evaluation of dual PI3K-mTOR inhibitors and histone deacetylase inhibitors in head and neck squamous cell carcinoma. Br J Cancer. 2012;106:107–115. doi: 10.1038/bjc.2011.495. [DOI] [PMC free article] [PubMed] [Google Scholar]
- Euvrard S, Kanitakis J, Claudy A. Skin cancers after organ transplantation. N Engl J Med. 2003;348:1681–1691. doi: 10.1056/NEJMra022137. [DOI] [PubMed] [Google Scholar]
- Facchetti F, Previdi S, Ballarini M, Minucci S, Perego P, LaPorta CA. Modulation of pro- and anti-apoptotic factors in human melanoma cells exposed to histone deacetylase inhibitors. Apoptosis. 2004;9:573–582. doi: 10.1023/B:APPT.0000038036.31271.50. [DOI] [PubMed] [Google Scholar]
- Fingar DC, Richardson CJ, Tee AR, Cheatham L, Tsou C, Blenis L. mTOR controls cell cycle progression through its cell growth effectors S6K1 and 4E-BP1/eukaryotic translation initiation factor 4E. Mol Cell Biol. 2004;24:200–216. doi: 10.1128/MCB.24.1.200-216.2004. [DOI] [PMC free article] [PubMed] [Google Scholar]
- Giommarelli C, Zuco V, Favini E, Pisano C, Dal Piaz F, De Tommasi N, Zunino F. The enhancement of antiproliferative and proapoptotic activity of HDAC inhibitors by curcumin is mediated by Hsp90 inhibition. Cell Mol Life Sci. 2010;67:995–1004. doi: 10.1007/s00018-009-0233-x. [DOI] [PMC free article] [PubMed] [Google Scholar]
- Hsu PP, Kang SA, Rameseder J, Zhang Y, Ottina KA, Lim D, Peterson TR, Choi Y, Gray NS, Yaffe MB, Marto JA, Sabatini DM. The mTOR-regulated phosphoproteome reveals a mechanism of mTORC1-mediated inhibition of growth factor signaling. Science. 2011;10:1317–1322. doi: 10.1126/science.1199498. [DOI] [PMC free article] [PubMed] [Google Scholar]
- Iglesias-Linares A, Yanez-Vico RM, Gonzalez-Moles MA. Potential role of HDAC inhibitors in cancer therapy: insights into oral squamous cell carcinoma. Oral Oncol. 2010;46:323–329. doi: 10.1016/j.oraloncology.2010.01.009. [DOI] [PubMed] [Google Scholar]
- Karam M, Legay C, Auclair C, Ricort JM. Protein kinase D1 stimulates proliferation and enhances tumorigenesis of MCF-7 human breast cancer cells through a MEK/ERK-dependent signaling pathway. Exp Cell Res. 2012;318:558–569. doi: 10.1016/j.yexcr.2012.01.001. [DOI] [PubMed] [Google Scholar]
- Komatsu N, Kawamata N, Takeuchi S, Yin D, Chien W, miller CW, Koeffler HP. SAHA, a HDAC inhibitor, has profound anti-growth activity against non-small cell lung cancer cells. Oncol Rep. 2006;15:187–191. [PubMed] [Google Scholar]
- LeBoeuf M, Terrell A, Trivedi S, Sinha S, Epstein JA, Olson EN, Morrisey EE, Millar SE. Hdac1 and Hdac2 act redundantly to control p63 and p53 functions in epidermal progenitor cells. Dev Cell. 2010;19:807–818. doi: 10.1016/j.devcel.2010.10.015. [DOI] [PMC free article] [PubMed] [Google Scholar]
- Mahalingam D, Medina EC, Esquivel JA, Espitia CM, Smith S, Oberheu K, Swords R, Kelly KR, Mita MM, Mita AC, Carew JS, Giles FJ, Nawrocki ST. Vorinostat enhances the activity of temsirolimus in renal cell carcinoma through suppression of survivin levels. Clin Cancer Res. 2010;16:141–153. doi: 10.1158/1078-0432.CCR-09-1385. [DOI] [PubMed] [Google Scholar]
- Makin G, Hickman JA. Apoptosis and cancer chemotherapy. Cell Tissue Res. 2000;301:143–152. doi: 10.1007/s004419900160. [DOI] [PubMed] [Google Scholar]
- Mann BS, Johnson JR, Cohen MH, Justice R, Pazdur R. FDA approval summary: vorinostat for treatment of advanced primary cutaneous T-cell lymphoma. Oncologist. 2007;12:1247–1252. doi: 10.1634/theoncologist.12-10-1247. [DOI] [PubMed] [Google Scholar]
- Marks PA, Richon VM, Rifkind RA. Histone deacetylase inhibitors: inducers of differentiation or apoptosis of transformed cells. J, Natl Cancer Inst. 2000;92:1210–1216. doi: 10.1093/jnci/92.15.1210. [DOI] [PubMed] [Google Scholar]
- Motley R, Kersey P, Lawrence C British Association of D. British Association of Plastic Surgeons. Multiprofessional guidelines for the management of the patient with primary cutaneous squamous cell carcinoma. Br J Dermatol. 2002;146:18–25. doi: 10.1046/j.0007-0963.2001.04615.x. [DOI] [PubMed] [Google Scholar]
- Nakagawa M, Oda Y, Eguchi T, Aishima S, Yao T, Hosoi F, Basaki Y, Ono M, Kuwano M, Tanaka M, Tsuneyoshi M. Expression profile of class I histone deacetylases in human cancer tissues. Oncol Rep. 2007;18:769–774. [PubMed] [Google Scholar]
- Ramaswamy B, Fiskus W, Cohen B, Pellegrino C, Hershman DL, Chuang E, Luu T, Somlo G, Goetz M, Swaby R, Shapiro CL, Stearns V, Christos P, Espinoza-Delgado I, Bhalla K, Sparano JA. Phase I-II study of vorinostat plus paclitaxel and bevacizumab in metastatic breast cancer: evidence for vorinostat-induced tubulin acetylation and Hsp90 inhibition in vivo. Breast Cancer Res Treat. 2011;3:1063–7. doi: 10.1007/s10549-011-1928-x. [DOI] [PMC free article] [PubMed] [Google Scholar]
- Ramsey MR, He L, Forster N, Ory B, Ellisen LW. Physical association of HDAC1 and HDAC2 with p63 mediates transcriptional repression and tumor maintenance in squamous cell carcinoma. Cancer Res. 2011;71:4373–4379. doi: 10.1158/0008-5472.CAN-11-0046. [DOI] [PMC free article] [PubMed] [Google Scholar]
- Rosato RR, Almenara JA, Dai Y, Grant S. Simultaneous activation of the intrinsic and extrinsic pathways by histone deacetylase (HDAC) inhibitors and tumor necrosis factor-related apoptosis-inducing ligand (TRAIL) synergistically induces mitochondrial damage and apoptosis in human leukemia cells. Mol Cancer Ther. 2003;2:1273–1284. [PubMed] [Google Scholar]
- Singh T, Chaudhary SC, Kapur P, Weng Z, Elmets CA, Kopelovich L, Athar M. Nitric Oxide Donor Exisulind Is an Effective Inhibitor of Murine Photocarcinogenesis. Photochem Photobiol. 2012;5:1141–1148. doi: 10.1111/j.1751-1097.2012.01093.x. [DOI] [PMC free article] [PubMed] [Google Scholar]
- Society AC. Cancer facts and figures. Serial publications: Annual Report; Cancer Facts and Figures (booklet), annual. Atlanta, GA: 2011. [accessed 23rd Jan 2012.]. http://www.cancer.org/acs/groups/content/@epidemiologysurveilance/documents/document/acspc-029771.pdf via the internet. [Google Scholar]
- Thiery JP. Epithelial-mesenchymal transitions in tumour progression. Nat Rev Cancer. 2002;2:442–454. doi: 10.1038/nrc822. [DOI] [PubMed] [Google Scholar]
- Uehara N, Kanematsu S, Miki H, Yoshizawa K, Tsubura A. Requirement of p38 MAPK for a cell-death pathway triggered by vorinostat in MDA-MB-231 human breast cancer cells. Cancer Lett. 2012;315:112–121. doi: 10.1016/j.canlet.2011.07.032. [DOI] [PubMed] [Google Scholar]
- Wagner JM, Hackanson B, Lubbert M, Jung M. Histone deacetylase (HDAC) inhibitors in recent clinical trials for cancer therapy. Clin Epigenetics. 2010;1:117–136. doi: 10.1007/s13148-010-0012-4. [DOI] [PMC free article] [PubMed] [Google Scholar]
- Wedel S, Hudak L, Seibel JM, Makarevic J, Juengel E, Tsaur I, Wiesner C, Haferkamp A, Blaheta RA. Impact of combined HDAC and mTOR inhibition on adhesion, migration and invasion of prostate cancer cells. Clin Exp Metastasis. 2011;28:479–491. doi: 10.1007/s10585-011-9386-8. [DOI] [PubMed] [Google Scholar]
- Xargay-Torrent S, Lopez-Guerra M, Saborit-Villarroya I, Rosich L, Campo E, Roué G, Colomer D. Vorinostat-induced apoptosis in mantle cell lymphoma is mediated by acetylation of proapoptotic BH3-only gene promoters. Clin Cancer Res. 2011;17:3956–3968. doi: 10.1158/1078-0432.CCR-10-3412. [DOI] [PubMed] [Google Scholar]
- Yan N, Shi Y. Mechanisms of apoptosis through structural biology. Annu Rev Cell Dev Biol. 2005;21:35–56. doi: 10.1146/annurev.cellbio.21.012704.131040. [DOI] [PubMed] [Google Scholar]
- Zwald FO, Brown M. Skin cancer in solid organ transplant recipients: advances in therapy and management: part I. Epidemiology of skin cancer in solid organ transplant recipients. J Am Acad Dermatol. 2011;65:253–261. doi: 10.1016/j.jaad.2010.11.062. [DOI] [PubMed] [Google Scholar]
Associated Data
This section collects any data citations, data availability statements, or supplementary materials included in this article.


