

Abstract
Background
Magnetic Resonance Imaging (MRI) has multiple contrast mechanisms. Like various staining techniques in histology, each contrast type reveals different information about the structure of the brain. However, it is not always clear how structures visible in MRI correspond to structures previously identified by histology. The purpose of this study was to determine if magnetic transfer contrast (MTC) or T2 contrast MRI was better at delineating the substantia nigra.
Methods
MRI scans were acquired in-vivo from two non-human primates (NHPs). The NHPs were subsequently euthanized, perfused, and their brains sectioned for histological analyses. Each slice was photographed prior to sectioning. Each brain was sectioned into approximately 500, 40-micron sections, encompassing most of the cortex, midbrain, and dorsal parts of the hindbrain. Levels corresponding to anatomical MRI images were selected. From these, adjacent sections were stained using Kluver Barrera (myelin and cell bodies) or tyrosine hydroxylase (TH) (dopaminergic neurons) immunohistochemistry. The resulting images were coregistered to the block-face images using a moving least squares algorithm with similarity transformations. MR images were similarly coregistered to the block-face images, allowing the structures in the MRI to be identified with structures in the histological images.
Results
We found that hyperintense (light) areas in MTC images were coextensive with the SN as delineated histologically. The hypointense (dark) areas in T2-weighted images were not coextensive with the SN, but extended partially into the SN and partially into the cerebral peduncles.
Conclusions
MTC is a more accurate contrast mechanism than T2-weighting for localizing the SN in vivo.
Keywords: non-human primate, T2, MRI, dopamine, substantia nigra, MTC
INTRODUCTION
There has been growing interest in visualizing in vivo a critical region of the midbrain, the substantia nigra (SN), because of its role in neurodegenerative and psychiatric disorders, such as Parkinson’s, Huntington’s, and schizophrenia (1). Yet, until recently, the SN has defied accurate depiction with magnetic resonance imaging (MRI) techniques. A reliable MR technique could serve as a potential marker for determining more timely diagnoses or monitoring of disease progression during treatment.
Many previous studies of the SN have used standard T1-, T2-, and proton density-weighted images, which may overestimate extent or show little to no contrast in this region. To improve visualization, researchers have tested an array of MR techniques, including susceptibility-weighted imaging (2), quantitative T1 imaging (3), and multishot diffusion-weighted imaging (4). However, while considerable research has been devoted to visualization of the SN, rather less attention has been paid to the underlying histological components that contribute to its appearance on anatomical images.
One example of a potentially important histological component is neuromelanin, which is found in the dopaminergic neurons of the SN pars compacta and the noradrenergic neurons of the locus ceruleus. This pigment can have paramagnetic properties when combined with iron (5, 6), and such properties can alter MRI contrast. To delineate the SN from neighboring structures, Sasaki et al. (7) recently used a fast spin echo sequence, which they termed neuromelanin-sensitive MRI. Inherent in neuromelanin-sensitive MRI is the magnetization transfer contrast (MTC) that results from the use of the fast spin echo sequence. This technique has already been used to distinguish patients with schizophrenia or depression from healthy individuals (1). However, no studies have directly compared MR images with physical neuroanatomical studies in the same subject.
The purpose of this study is to evaluate the accuracy of MTC and standard T2-weighted techniques in localizing the SN. MR images acquired in vivo from two non-human primates were compared to both histological samples and high-resolution images of macroscopic anatomy obtained from the same subjects. To elucidate which anatomical components contribute to the MR image contrast, histological specimens were stained using Kluver Barerra (myelin and cell bodies) and TH immuno-histochemistry (dopaminergic neurons). We hypothesized that the hyperintense (brighter) regions on MTC images would more accurately represent anatomical borders of the SN as shown by TH immuno-histochemistry than the hypointense (darker) regions on T2 contrast images.
METHODS
The studies were performed on two male macaques. The first, a Macaca fascicularis, was approximately six years old and weighed 7.6 kg. The second, a Macaca mulatta, was approximately seven years old and weighed 8.4 kg. These animals had been used in previous studies involving microelectrode recording from occipital visual cortical areas V1, V2, and V4, but no recordings were made in or near the structures studied in this paper nor were there any interventions likely to alter their anatomy (8-10).
For the present experiments, it was necessary to attach a head-fixation system on the monkeys’ skulls to stabilize them during MRI imaging. Thus, under isoflurane general anesthesia, high-strength plastic (PEEK: polyether ether ketone) strips were bolted to the skull with ceramic screws (Thomas Recording, Germany) and connected to a head-fixation system (11). Prior to MRI imaging the animals were anesthetized with a mixture of ketamine 5-25 mg/kg and acepromazine 0.1-0.5 mg/kg, followed by atropine 0.05 mg/kg subcutaneously. During the entire imaging procedure, the animals were kept anesthetized and heart rate and arterial hemoglobin oxygen saturation were monitored via an optical sensor taped to one finger (Invivo Millennia 3155MVS and 3150M).
Animals were euthanized, consistent with the recommendations of the Panel on Euthanasia of the American Veterinary Medical Association, by deep sodium pentobarbital anesthesia (≥ 100 mg/kg IV), followed by exsanguinations by cardiac perfusion first with a solution of 0.9% NaCl and 1% Sodium Nitrite, then with 4% paraformaldehyde in 0.1M phosphate buffer (PB). This method of euthanasia is consistent with the recommendations of the American Veterinary Medical Association (AVMA) Guidelines on Euthanasia.
All experimental procedures and care of the animals were carried out in compliance with guidelines established by the National Institute of Health and were approved by the University of Alabama at Birmingham Animal Care and Use Committee.
MRI Acquisition
All MR images were acquired on a 4.7T vertical bore primate-research dedicated scanner (Varian, Inc., Palo Alto, CA). The scanning protocol for both subjects included proton density (PD) weighted images, a magnetization transfer contrast (MTC) images, and a T2-weighted images. Identical image geometry was used with each contrast. Four slices through the brain stem parallel to the anterior commissure – posterior commissure (AC-PC) line were acquired. The image field of view was 128 × 128 mm. In subject one the image resolution was 1 × 1 × 2 mm, and in subject two the image resolution was 0.5 × 0.5 × 2 mm.
Acquisition parameters for the PD and MTC images were based on the methods described in (12, 13). PD images were acquired using a low flip angle (10°) gradient recalled echo sequence (TR/TE 500/5 ms). MTC images were acquired using the same PD sequence with the addition of a 4 W, 20 ms, constant magnitude MTC preparation pulse at 10 kHz below the resonance frequency of water. For the T2-weighted images, a simple spin echo sequence (TR/TE 5000/50 ms) was used.
Histology
So that the MRI slices would match the histological sections, the brains were blocked using a stereotactic frame to produce sections that were axial and AC-PC aligned. Each brain was then removed from the skull and placed in a solution of 25% sucrose in PB for several days until it sank to the bottom of the vessel. The sucrose solution was replaced with fresh solution each day. Each brain was then removed from the sucrose bath and the dorsal surface was trimmed flat so that the brain could be positoned ventral side up. The brains were then placed on the stage of a Model 860 American Optical Corp sliding microtome and frozen with dry ice. After removing an initial few thick sections, the brain was sectioned at a thickness of 40 microns and sections stored in individual wells in PB solution containing sodium azide (0.1%), and stored at 4°C.
Approximately 500 sections were obtained from each animal encompassing most of the cortex, the midbrain, and the dorsal parts of the hindbrain. The block face was photographed at 3024×1998 resolution using a Nikon D70 SLR digital camera prior to sectioning each slice. Illumination was provided by two 250W photoflood lamps. Image acquisition was triggered automatically by a custom trigger mounted on the microtome. Images were automatically downloaded to a computer for storage using remote camera operation software (Sofortbild, http://www.sofortbildapp.com/).
Adjacent sections from two series per brain were stained with either Kluver Barrera (KB) stain to identify axons and cells, or processed for tyrosine hydroxylase (TH) immuno-histochemistry to identify dopamine cells and fibers.
Kluver-Barrera
Sections were prepared by washing in PB (4 × 30 min), and then placed on charged slides and allowed to dry overnight. Slides were then incubated in dH2O for 5 minutes, followed by dehydration in 50% EtOH and 70% EtOH for 5 minutes each. Slides were then placed in 0.1% luxol fast blue MBS solution and placed in a 65o C water bath with a slight agitation for 24 hours. Once removed, the tissue was rehydrated in 95% EtOH, 70% EtOH, 50% EtOH, and dH2O for 5 minutes each. Tissue was placed in 0.05% lithium carbonate solution, aqueous for 12 minutes with constant agitation, followed by 70% EtOH (2 min, constant agitation), 70% EtOH (1 min, constant agitation), and 50% EtOH (1 min). Tissue was checked for differentiation under the light microscope, and then placed in dH2O (2 × 5 min). The sections were counterstained in 0.1% cresyl violet acetate solution, aqueous for 10 minutes, followed by dehydration in 50% EtOH (2 min), 70% EtOH (2 min), 95% EtOH (2 × 2 min), 100% EtOH (2 × 2 min). The slides were placed in xylene (2 × 2 min) and then coverslipped using Eukitt.
TH Immunohistochemistry
Free-floating sections were washed in PB (1 × 5 min), incubated in 1% sodium borohydride solution made in PB for 15 minutes, washed in PB (4 × 5 min), incubated in 1.5% hydrogen peroxide solution made in PB for 30 minutes, and then washed in PBS (3 × 5 min). The tissue was then incubated in 10% normal horse serum in PB for 30 min, washed in PB (4 × 5 min), followed by the primary antibody (Anti-Tyrosine Hydroxylase, Millipore, MAB318) at a dilution of 1:1,000 in 3% normal horse serum in PB for 72 hours at 4° C at a constant agitation. The tissue was then washed in PB (4 × 5 min) and incubated in biotinylated horse anti-mouse IgG 1:200 in a 1.5% normal horse serum solution made in PB for 1 hour. The tissue was washed in PB (4 × 5min) prior to being treated with reagents from the avidin–biotin peroxidase kit (ABC standard kit, Vectastain) using the recommended dilutions of 1:100 for both solution A and solution B in PB for 45 minutes. The sections were then washed in PB (4 × 5 min) and then incubated in 3,3′-diaminobenzidine (10 mg/15 ml PB) containing 0.03% hydrogen peroxide for 2 minutes to visualize the reaction product. Control samples were processed in an identical fashion except for the exclusion of the primary antibody. These control sections did not exhibit any specific staining. The stained sections were mounted on slides, dehydrated and cover slipped as detailed above.
From each of these stained series, 3-4 sections were selected that corresponded to each of the anatomical MRI images. The slides were then scanned at 20x on an Aperio ScanScope CS (Aperio, Vista CA) to create complete microscopic images of the midbrain area.
The resulting histological images were then co-registered with the block face images. In turn the MR images were also co-registered to the block face images. After this preprocessing, the transformed histological images corresponded to the MR images and could be directly compared.
Coregistration
All image processing was performed on a MacBook Pro using the open source software package FIJI (a version of NIH ImageJ’, http://fiji.sc). The image processing algorithms described below were all tools available in the default FIJI installation.
Histology images were initially subsampled to approximately 1000×1000 pixels. The block-face photos were cropped to 1188×1184 pixels. The MR images were used at the native resolution of 256×256 or 128×128 pixels. Uneven illumination was removed from the histological images using a rolling ball background removal algorithm (14) assuming a light background. The histological, block-face, and MR images were then contrast enhanced using contrast-limited adaptive histogram equalization (15).
The MR images and histology images were then coregistered to the blockface images. To guide the coregistration, ten features were marked on each image. The marked features consisted of the most anterior points of the crus cerebri, the most posterior point of the interpeduncular fossa, the most lateral points of the crus cerebri, the most anterior point of the cerebral aqueduct, and the most posterior point of the tectum. These features were selected because they are easily identified in all of the imaging modalities used in this study. These ten features served as the control points for non-rigid image registration based on an ‘as rigid as possible’ moving-least-squares algorithm (16, 17).
The midbrain was then segmented out of the histological images by hand tracing. The crus cerebri in the KB stained sections and the SN in the TH stained sections were delineated by hand. The co-registered images and the outlines of the crus cerebri and SN were then overlaid. After the images were coregistered and overlaid, figures for the paper were assembled and labeled in Adobe Photoshop Elements 7.
RESULTS
Figure 1 illustrates the difference in contrast between PD- and MTC-weighted images. The MTC pulse introduces additional contrast that can be used to delineate structures in the brainstem.
Figure 1.
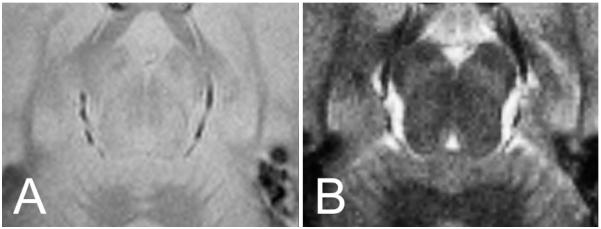
Proton density (PD) and magnetization transfer contrast (MTC) images from the same subject and same axial section at the level of the SN: left side, (A) PD image, right side, (B) MTC image.
Figure 2 illustrates the alignment of the histological data with the block-face and MRI image data from one slice in subject two. All the histological and MR contrast images were successfully aligned to the block-face resulting in mutual coregistration of all of the imaging modalities.
Figure 2.
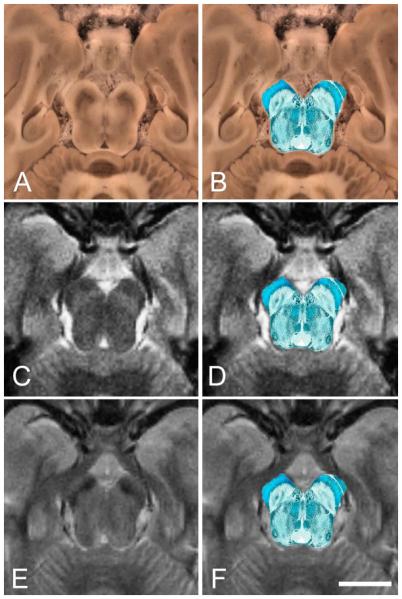
Illustration of histology data aligned with block-face and MR images. All images come from the same subject and same axial section at the level of the SN. Histology and MR images are aligned with their corresponding block-face image. The right column illustrates succesful alignment of the KB histology onto the images from the left column. Images from top to bottom: (A) block-face image acquired during sectioning with (B) aligned KB image overlaid, (C) aligned MTC MR image with (D) aligned KB image overlaid, (E) aligned T2 MR image with (F) aligned KB image overlaid. Scale bar, 1 cm.
Figure 3 illustrates the location of the cerebral peduncles and the SN as determined via post-mortem histology at three levels of the midbrain. The cerebral peduncles were delineated using the KB stain (left column, Figure 3) and the SN was delineated using TH immunohistochemistry (right column, figure 3). Cerebral peduncles are outlined in blue and SN is outlined in red. The top row shows axial sections through the brainstem in the caudal portion of the SN. The middle row shows sections through the brainstem at the level of cranial nerve III. The bottom row shows sections through the brainstem in the rostral portion of the SN. Coregistration of the histology with its corresponding blockface image was successful at each level.
Figure 3.
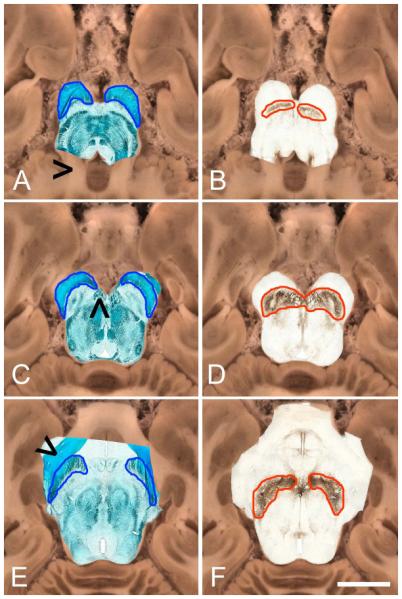
Aligned KB stain and TH stain images overlaid on corresponding block-face image at 3 levels of the SN. Left column shows overlaid KB images, right column shows TH images. Cerebral peduncles are outlined in blue and the SN is outlined in red. (A) KB and (B) TH axial sections through the caudal portion of the SN at the level of the cerebellar peduncles (black arrow, panel A) (C) KB and (D) TH axial sections at the level of cranial nerve III rootlets (black arrow, panel C). (E) KB and (F) TH axial sections through the rostral portion of the SN at the level of the optic tract (black arrow, panel E). Scale bar, 1 cm.
Figure 4 illustrates the correspondence of the histological results and the MTC contrast images. The levels of section and the outlines are identical to those in figure 3. Importantly, at each level, the hyperintense bands in the MTC image correspond to the regions identified as the SN in the TH stain (red outline). The cerebral peduncles (blue outline) correspond to hypointense areas in the MTC image.
Figure 4.
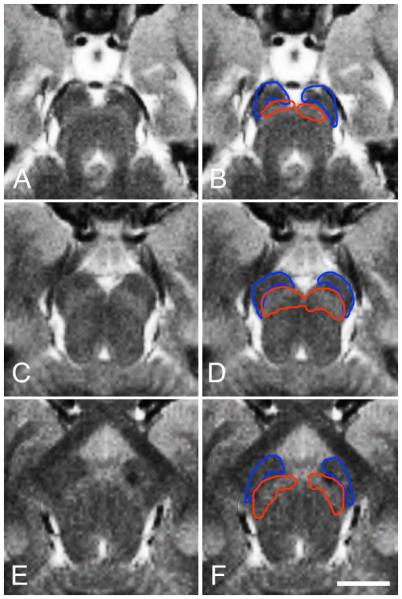
Illustration of correspondence of cerebral peduncles with hypointense areas and SN with hyperintense bands in MTC contrast MR images. The cerebral peduncles are outlined in blue and SN is outlined in red. The outlines and levels of section are the same as in figure 3. At each level the hyperintense bands correspond well to the SN as determined from the histology. (A) MTC image and (B) overlaid outlines through the caudal portion of the SN. (C) MTC image and (D) overlaid outlines at the level of cranial nerve III. (E) MTC image and (F) overlaid outlines through the rostral portion of the SN. Scale bar, 1 cm.
Figure 5 illustrates the correspondence of the histological results and the T2 contrast images. The levels of section and the outlines are identical to those in figure 3. The hypointense regions of the T2 maps do not correspond well with the SN (red outline). In the rostral and caudal sections the hypointense regions fall within the densely myelinated dorsal region of the cerebral peduncles. In the intermediate section at the level of cranial nerve III the hypointense regions extend into the cerebral peduncles and the SN, but are not coextensive with either structure.
Figure 5.
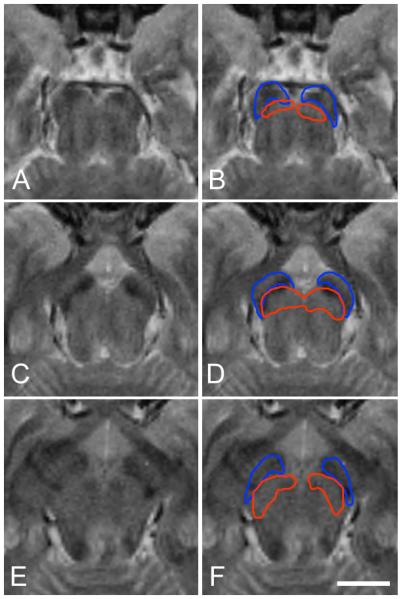
Illustration of poor correspondence of cerebral peduncles and SN with hypointense areas in T2 contrast MR images. The cerebral peduncles are outlined in blue and SN is outlined in red. The outlines and levels of section are the same as figure 3. At no level do the hypointense areas correspond well to the SN as determined from the histology. (A) T2 image and (B) overlaid outlines through the caudal portion of the SN. (C) T2 image and (D) overlaid outlines at the level of cranial nerve III. (E) T2 image and (F) overlaid outlines through the rostral portion of the SN. Scale bar, 1 cm.
DISCUSSION
In this study, we imaged the midbrain and the SN of two non-human primates in vivo with a proton density weighted gradient recalled echo sequence with a magnetization transfer contrast (MTC) preparation pulse as described by Wolff and Balaban (13). Previous studies have compared in vivo MR images of the midbrain and SN to macroscopic samples or atlases from different subjects, but this study is the first to present images and histology from the same subjects in primates. We found the MTC sequence better localizes the SN than conventional T2-weighted imaging as confirmed by histology.
Freely mobile protons are detectable by MR because they have a sufficiently long T2 relaxation time, while the T2 of macromolecular protons is too short to be detected (18). The MTC sequence (13) uses an off-resonance radio frequency excitation pulse to saturate the protons of macromolecules, which may be cholesterol in myelin (19). By cross-relaxation or exchange mechanisms (13), the magnetization is transferred from the bound protons in macromolecules to the freely-mobile, MR-visible water protons leading to a reduction of total signal intensity. This signal reduction is larger in white matter, where the MTC effect is greater, than in gray matter. The MTC effect is also inherent in some multi-slice imaging techniques (20), including fast spin echo and turbo spin echo (18), which results from RF excitation of out-of-plane slices during image acquisition (21).
Early MRI studies of Parkinson’s disease used T2-weighted images to delineate the SN (22, 23), and researchers interpreted the hypointense region to result from iron in the SN pars reticulata (SNr) (24). However, Rutledge et al. (25) and Mänz et al. (26) have observed that the correlation between this hypointense region and the SN was imperfect. Since T2-weighted images do not accurately depict the SN, others have employed additional MR imaging techniques, including diffusion weighted imaging (4), inversion recovery imaging (27, 28), quantitative T1 mapping (3), and susceptibility weighted imaging (2).
Recently, Sasaki et al. (1, 7) used a T1-weighted fast spin echo sequence to visualize the SN and locus ceruleus. They referred to this technique as neuromelanin-sensitive MRI, arguing that the contrast results from neuromelanin as a byproduct of dopamine and noradrenalin metabolisms. They applied this technique to distinguish patients with schizophrenia and depression from healthy controls (1). They found increased signal intensity in the SN in patients with schizophrenia, which is consistent with elevated levels of dopamine, and reduced signal intensity in the locus ceruleus in patients with depression, which is consistent with dysfunction of the noradrenergic system. To image the SN in patients with Parkinson’s disease, Schwarz et al. (29) recently used a T1-weighted fast spin echo sequence with additional magnetization transfer contrast pulses. They found smaller regions of hyperintensity with reduced contrast in the SN in patients compared to controls, consistent with the loss of dopamine neurons in the SN pars compacta (SNc). Because neuromelanin is a byproduct of dopamine and noradrenalin synthesis, alterations to these catecholamines or loss of dopaminergic neurons could have an effect on images sensitive to neuromelanin. The resulting contrast is likely due to a combination of paramagnetic T1-shortening effects of neuromelanin and MTC leading to a hyperintense signal on T1-weighted images (29). However, the role of neuromelanin has not been confirmed with postmortem studies and should be a focus of future research. Nevertheless, the results of our study, together with those of Shibata et al (1) and Schwarz et al, (29) lend support to the accurate localization of the SN with magnetization transfer contrast as confirmed by us using histology in non-human primates. Our results indicate this imaging technique may be useful for studying or monitoring neurodegenerative and psychiatric disorders for which there is evidence of SN pathology, such as Parkinson’s disease and schizophrenia.
While this study was intended to explore the use of MTC to delineate the SN (incorporating the pars compacta and the pars reticulata), delineating the VTA in the same way would be of great importance. However, due to the morphology of the VTA and the resolution limitations of our MRI hardware, there was insufficient in-plane resolution in the MR images to make a definitive statement about the suitability of using MTC to image the VTA.
There are other considerations when using the magnetization transfer contrast. Acquisition times are lengthened requiring a reduction in the number of slices or in the image resolution. Longer acquisition times are an especially important consideration when studying patient populations. Furthermore, the additional MTC pulses result in increased power deposition, approaching specific absorption rate limits.
With advancing MRI technologies, there will be continued improvement in the visualization of the midbrain and other subcortical structures. Future studies will benefit from additional techniques such as diffusion tensor imaging, which has already been applied to the segmentation of SN subregions (30), as well as state-of-the-art high resolution and high field strength imaging of the midbrain (31). However, while comparing MR contrasts with published atlas data is certainly a valid technique, the ultimate test of any new MR contrast method will be to compare the MR data with co-registered histology from the same subjects, which will likely involve the use of appropriate animal models.
ACKOWLEDGEMENTS
This work was supported by NIH RO1 MH081014 (to ACL), NSF grant IOS 0622318 (to TJG), NIH RO1 MH66123 (to RCR) and NEI core grant P30 EY003039 (University of Alabama at Birmingham Vision Science Research Center). We would like to thank Joy K. Roche for histological assistance, and Debbie Whitten for veterinary assistance. We would like to thank Dr. Clinton Grubbs for the use of his Aperio slide scanner.
Footnotes
Publisher's Disclaimer: This is a PDF file of an unedited manuscript that has been accepted for publication. As a service to our customers we are providing this early version of the manuscript. The manuscript will undergo copyediting, typesetting, and review of the resulting proof before it is published in its final citable form. Please note that during the production process errors may be discovered which could affect the content, and all legal disclaimers that apply to the journal pertain.
FINANCIAL DISCLOSURES The authors report no biomedical financial interests or potential conflicts of interest.
REFERENCES
- 1.Shibata E, Sasaki M, Tohyama K, Otsuka K, Endoh J, Terayama Y, et al. Use of neuromelanin-sensitive MRI to distinguish schizophrenic and depressive patients and healthy individuals based on signal alterations in the substantia nigra and locus ceruleus. Biological psychiatry. 2008;64:401–406. doi: 10.1016/j.biopsych.2008.03.021. [DOI] [PubMed] [Google Scholar]
- 2.Manova ES, Habib CA, Boikov AS, Ayaz M, Khan A, Kirsch WM, et al. Characterizing the mesencephalon using susceptibility-weighted imaging. AJNR Am J Neuroradiol. 2009;30:569–574. doi: 10.3174/ajnr.A1401. [DOI] [PMC free article] [PubMed] [Google Scholar]
- 3.Menke RA, Scholz J, Miller KL, Deoni S, Jbabdi S, Matthews PM, et al. MRI characteristics of the substantia nigra in Parkinson’s disease: a combined quantitative T1 and DTI study. Neuroimage. 2009;47:435–441. doi: 10.1016/j.neuroimage.2009.05.017. [DOI] [PubMed] [Google Scholar]
- 4.Adachi M, Hosoya T, Haku T, Yamaguchi K, Kawanami T. Evaluation of the substantia nigra in patients with Parkinsonian syndrome accomplished using multishot diffusion-weighted MR imaging. AJNR Am J Neuroradiol. 1999;20:1500–1506. [PMC free article] [PubMed] [Google Scholar]
- 5.Enochs WS, Petherick P, Bogdanova A, Mohr U, Weissleder R. Paramagnetic metal scavenging by melanin: MR imaging. Radiology. 1997;204:417–423. doi: 10.1148/radiology.204.2.9240529. [DOI] [PubMed] [Google Scholar]
- 6.Tosk JM, Holshouser BA, Aloia RC, Hinshaw DB, Jr., Hasso AN, MacMurray JP, et al. Effects of the interaction between ferric iron and L-dopa melanin on T1 and T2 relaxation times determined by magnetic resonance imaging. Magn Reson Med. 1992;26:40–45. doi: 10.1002/mrm.1910260105. [DOI] [PubMed] [Google Scholar]
- 7.Sasaki M, Shibata E, Tohyama K, Takahashi J, Otsuka K, Tsuchiya K, et al. Neuromelanin magnetic resonance imaging of locus ceruleus and substantia nigra in Parkinson’s disease. Neuroreport. 2006;17:1215–1218. doi: 10.1097/01.wnr.0000227984.84927.a7. [DOI] [PubMed] [Google Scholar]
- 8.Gawne TJ. Stimulus selection via differential response latencies in visual cortical area V4. Neurosci Lett. 2008;435:198–203. doi: 10.1016/j.neulet.2008.02.036. [DOI] [PubMed] [Google Scholar]
- 9.Gawne TJ. The local and non-local components of the local field potential in awake primate visual cortex. J Comput Neurosci. 2010;29:615–623. doi: 10.1007/s10827-010-0223-x. [DOI] [PubMed] [Google Scholar]
- 10.Risner ML, Gawne TJ. The response dynamics of primate visual cortical neurons to simulated optical blur. Vis Neurosci. 2009;26:411–420. doi: 10.1017/S0952523809990174. [DOI] [PubMed] [Google Scholar]
- 11.Gamlin PD, Ward MK, Bolding MS, Grossmann JK, Twieg DB. Developing functional magnetic resonance imaging techniques for alert macaque monkeys. Methods. 2006;38:210–220. doi: 10.1016/j.ymeth.2005.08.004. [DOI] [PubMed] [Google Scholar]
- 12.Wolff SD, Eng J, Balaban RS. Magnetization transfer contrast: method for improving contrast in gradient-recalled-echo images. Radiology. 1991;179:133–137. doi: 10.1148/radiology.179.1.2006263. [DOI] [PubMed] [Google Scholar]
- 13.Wolff SD, Balaban RS. Magnetization transfer contrast (MTC) and tissue water proton relaxation in vivo. Magn Reson Med. 1989;10:135–144. doi: 10.1002/mrm.1910100113. [DOI] [PubMed] [Google Scholar]
- 14.Sternberg SR. Biomedical Image Processing. Computer. 1983;16:22–34. [Google Scholar]
- 15.Pizer SMA,EP, Austin JD. Adaptive Histogram Equalization and Its Variations. Computer Vision, Graphics, and Image Processing. 1987;39:355–368. [Google Scholar]
- 16.Menon MHN,DK. Applicability of Non-Rigid Medical Image Registration using Moving Least Squares. International Journal of Computer Applications. 2010;1:85–92. [Google Scholar]
- 17.Schaefer A, McPhail T, Warren J. Image deformation using moving least squares. ACM Transactions on Graphics. 2006;25:533–540. [Google Scholar]
- 18.Henkelman RM, Stanisz GJ, Graham SJ. Magnetization transfer in MRI: a review. NMR Biomed. 2001;14:57–64. doi: 10.1002/nbm.683. [DOI] [PubMed] [Google Scholar]
- 19.Koenig SH. Cholesterol of myelin is the determinant of gray-white contrast in MRI of brain. Magn Reson Med. 1991;20:285–291. doi: 10.1002/mrm.1910200210. [DOI] [PubMed] [Google Scholar]
- 20.Dixon WT, Engels H, Castillo M, Sardashti M. Incidental magnetization transfer contrast in standard multislice imaging. Magn Reson Imaging. 1990;8:417–422. doi: 10.1016/0730-725x(90)90050-c. [DOI] [PubMed] [Google Scholar]
- 21.Balaban RS, Ceckler TL. Magnetization transfer contrast in magnetic resonance imaging. Magn Reson Q. 1992;8:116–137. [PubMed] [Google Scholar]
- 22.Braffman BH, Grossman RI, Goldberg HI, Stern MB, Hurtig HI, Hackney DB, et al. MR imaging of Parkinson disease with spin-echo and gradient-echo sequences. AJR Am J Roentgenol. 1989;152:159–165. doi: 10.2214/ajr.152.1.159. [DOI] [PubMed] [Google Scholar]
- 23.Duguid JR, De La Paz R, DeGroot J. Magnetic resonance imaging of the midbrain in Parkinson’s disease. Ann Neurol. 1986;20:744–747. doi: 10.1002/ana.410200618. [DOI] [PubMed] [Google Scholar]
- 24.Drayer B, Burger P, Darwin R, Riederer S, Herfkens R, Johnson GA. MRI of brain iron. AJR Am J Roentgenol. 1986;147:103–110. doi: 10.2214/ajr.147.1.103. [DOI] [PubMed] [Google Scholar]
- 25.Rutledge JN, Hilal SK, Silver AJ, Defendini R, Fahn S. Study of movement disorders and brain iron by MR. AJR Am J Roentgenol. 1987;149:365–379. doi: 10.2214/ajr.149.2.365. [DOI] [PubMed] [Google Scholar]
- 26.Manz C, Godau J, Berg D, Bender B, Ernemann U, Klose U. The regional distribution of T2-relaxation times in MR images of the substantia nigra and crus cerebri. Neuroradiology. 2010;52:745–750. doi: 10.1007/s00234-009-0612-x. [DOI] [PubMed] [Google Scholar]
- 27.Hutchinson M, Raff U. Structural changes of the substantia nigra in Parkinson’s disease as revealed by MR imaging. AJNR Am J Neuroradiol. 2000;21:697–701. [PMC free article] [PubMed] [Google Scholar]
- 28.Oikawa H, Sasaki M, Tamakawa Y, Ehara S, Tohyama K. The substantia nigra in Parkinson disease: proton density-weighted spin-echo and fast short inversion time inversion-recovery MR findings. AJNR Am J Neuroradiol. 2002;23:1747–1756. [PMC free article] [PubMed] [Google Scholar]
- 29.Schwarz ST, Rittman T, Gontu V, Morgan PS, Bajaj N, Auer DP. T1-weighted MRI shows stage-dependent substantia nigra signal loss in Parkinson’s disease. Mov Disord. 2011;26:1633–1638. doi: 10.1002/mds.23722. [DOI] [PubMed] [Google Scholar]
- 30.Menke RA, Jbabdi S, Miller KL, Matthews PM, Zarei M. Connectivity-based segmentation of the substantia nigra in human and its implications in Parkinson’s disease. Neuroimage. 2010;52:1175–1180. doi: 10.1016/j.neuroimage.2010.05.086. [DOI] [PubMed] [Google Scholar]
- 31.Eapen M, Zald DH, Gatenby JC, Ding Z, Gore JC. Using high-resolution MR imaging at 7T to evaluate the anatomy of the midbrain dopaminergic system. AJNR Am J Neuroradiol. 2011;32:688–694. doi: 10.3174/ajnr.A2355. [DOI] [PMC free article] [PubMed] [Google Scholar]