

Abstract
New structural and functional neuroimaging methods continue to rapidly develop, offering promising tools for cognitive neuroscientists. In the last 20 years, advanced magnetic resonance imaging (MRI) techniques have provided invaluable insights into how language is represented and processed in the brain and how it can be disrupted by damage to, or dysfunction of, various parts of the brain. Current functional MRI (fMRI) approaches have also allowed researchers to purposefully investigate how individuals recover language after stroke. This paper presents recommendations for quantification of brain lesions derived from discussions among international researchers at the Neuroimaging in Aphasia Treatment Research Workshop held at Northwestern University (Evanston, Illinois, USA). Methods for detailing and characterizing the brain damage that can influence results of fMRI studies in chronic aphasic stroke patients are discussed. Moreover, we aimed to provide the reader with a set of general practical guidelines and references to facilitate choosing adequate structural imaging strategies that facilitate fMRI studies in aphasia treatment research.
Keywords: Structural anatomy, Language recovery, Stroke, Aphasia, Brain lesions
1. Introduction
Both functional imaging of healthy participants and lesion studies have shown that many brain areas beyond the classical Broca’s and Wernicke’s language areas are important for language comprehension and production (Naeser et al., 1987, Wise et al., 2001, Awad et al., 2007, Dronkers et al., 2007, Fridriksson et al., 2007). Therefore, a given language impairment can result from damage or dysfunction of several different brain regions (Hillis et al., 2004, Newhart et al., 2007, Prabhakaran et al., 2007, Bonilha and Fridriksson, 2009) due to the impact of the lesion not only on the function of the affected region but also on the many regions connected to it within the language network (Bonilha and Fridriksson, 2009). As such, determining not only the lesion site but also understanding the impact that the structural lesion can have on the function of other structurally intact brain areas is critical to our understanding of aphasia recovery. The present paper focuses on quantification of brain lesions in chronic stroke-induced aphasic individuals and conveys the consensus for minimum standards and ideals for characterizing the lesion (i.e., site and extent of infarcted tissue) that was reached during the Neuroimaging in Aphasia Treatment Research Workshop held at Northwestern University, a two-day meeting devoted to discussions among international researchers. Understanding neuroplasticity of language networks requires a full assessment of brain damage in order to identify tissue that is available to support language recovery. Here we briefly discuss standards that were generally (if not universally) agreed upon, with regard to selection of stroke participants for language recovery studies, specification and measurement of lesion volume and location. We also discuss appropriate imaging methods for identification of lesion-related participant variables.
2. Participant Variables: Inclusion and Exclusion Criteria
Aphasia can be caused by a variety of lesion types, such as stroke, tumor, abscess, surgical resection of lesions or epileptic foci, head injury, and neurodegenerative disease e.g., primary progressive aphasia. These etiologies have different consequences for recovery, and therefore should not be grouped together in studies of language recovery. For the purposes of this paper, we restrict our discussion to quantification of lesions in individuals who have suffered a stroke, the most common cause of aphasia. We note, however, that there are many different types of stroke: infarct from arterial occlusion, primary intracerebral hemorrhage, hemorrhagic infarct, subarachnoid hemorrhage, subdural hemorrhage, and venous infarct. These different types of stroke may differentially affect language, structure/function relationships, aphasia recovery and the neural mechanisms that support treatment-induced recovery. While this may be of interest, we suggest, at least in this early phase of aphasia research, limiting intra-studies, to individuals with one type of lesion, e.g. ischemic stroke resulting from arterial occlusion (with or without subsequent hemorrhagic conversion). When the primary question is the effects of aphasia treatment in order to control for spontaneous recovery another consideration may be recruiting only those who are at least 6 months post onset of stroke. Studies of early recovery provide important information about how the brain recovers from stroke and aphasia. However, fMRI research has shown that activation patterns change over time as a function of natural recovery as well as in response to behavioral treatment (Saur et al., 2006, Saur et al., 2010). Overall, these studies emphasize the dynamic reorganization of brain function that occurs following stroke. There is not yet evidence to suggest that aphasia treatment influences the progressive dynamics of brain reorganization during the early phases of recovery. Therefore studies targeting the early phases of spontaneous recovery may be best to use structural- and perfusion-weighted MRI to examine how structural damage or compromised cerebral perfusion influences early aphasia progression. Then after this initial natural history of recovery has been detailed fMRI may be more effective to characterize the neural changes associated with aphasia treatment outcome.
Functional imaging of acute stroke is also complicated by the fact that areas around the acute infarct may have compromised function due to low blood flow and may or may not proceed to infarct (see Figure 1). These hypoperfused areas may contribute to patient deficits (Hillis, 2005) and may not show a BOLD effect in fMRI studies even in the presence of activation (Prabhakaran et al., 2007, Altamura et al., 2009) because of exhausted vascular reserve (inability to show a hemodynamic response to activation). This could create a lack of sensitivity to the BOLD response that is not related to hypoperfusion in the absolute sense, but rather to the fact that increased blood during the resting state changes the relative amplitude.
Figure 1.
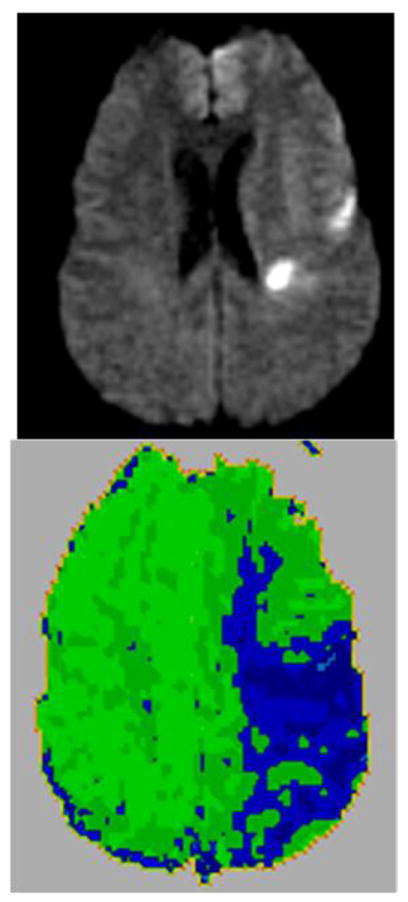
A Diffusion Weighted Image (top panel) and Dynamic Contrast Perfusion Weighted Image (PWI; lower panel) illustrate in an acute ischemic stroke patient an area of hypoperfusion (blue on PWI) surrounding the area of densely ischemic tissue (bright white on DWI). This area of hypoperfusion is dysfunctional tissue that is at risk for progressing to infarct if blood flow cannot be restored quickly.
Even in chronic stroke, it is worth noting that there may be individual cases where chronic hypoperfusion could affect the BOLD response to activation (Murata et al., 2006, Prabhakaran et al., 2007, Thompson et al., 2010). To minimize null BOLD effects in group fMRI studies of chronic stroke aphasics it is advisable to examine individual’ hemodynamic response functions (HRF), rather than to rely on the canonical HRF during statistical analysis of the fMRI data. In those in whom a poor BOLD signal is detected the individual’s baseline cerebral ischemic condition could also be assessed e.g. investigate if they also have significant hypoperfusion beyond the infarct as measured with computed tomography (CT) perfusion, MR dynamic-contrast perfusion (PWI), or arterial spin labeling (ASL) MRI. Investigators could collect additional information about study participant’s hemodynamic parameters by looking at stenosis of the internal carotid artery in the neck i.e., those with > 70 % stenosis are most at risk for chronic, functionally significant hypoperfusion (typically measured with magnetic resonance angiogram (MRA) or CT angiogram (CTA) of the circle of Willis), or those with impaired vascular reactivity (as measured with vascular response to acetyzolamide or CO2 challenge or breath-holding1). However, the question remains whether or not blood flow is a good marker of neural activity in these patients.
Although the functional magnetic resonance imaging (fMRI) blood oxygen level dependent (BOLD) signal is increasingly used to examine the neural correlates of aphasia treatment, its reliability in areas of hypoperfusion is uncertain. At the same time, the BOLD response and its relationship to diaschisis is not well understood. Cerebral infarction can cause diaschisis, a reduction of blood flow and metabolism in areas of the cortex distant from the site of the lesion. Therefore, converging evidence from different imaging methods may help to assess the validity of the coupling between neural activity, blood flow, and the BOLD response. One could compare positron emission tomography (PET) to BOLD activation, or alternatively, one could use a modality that doesn’t depend on blood flow, e.g., DTI, or EEG and then compare and contrast between modalities. For example, Fair and colleagues investigated the effect of chronic diaschisis as measured by resting PET on task-evoked BOLD responses during word-stem completion in a block design fMRI study in 3 patients, 6 months after a single left hemisphere stroke involving the inferior frontal gyrus and operculum. The BOLD responses were minimally affected in areas of chronic diaschisis. For the patients in this study, the mechanism underlying the BOLD signal, which includes a mismatch between neuronally driven increases in blood flow and a corresponding increase in oxygen use, appeared to be intact in areas of chronic diaschisis (Fair et al., 2009).
Currently, many fMRI studies of aphasia treatment exclude patients with hypoperfusion but perhaps this exclusionary criteria needs to be reconsidered. Rather, in cases with poor BOLD signal and chronic hypoperfusion researchers may choose to exclude the individuals from group fMRI studies and treat them as separate cases e.g. a case series approach. Alternatively, when a number of such rare cases are identified it may be appropriate to group them together and intra-study consider areas of hypoperfusion (as defined by stated threshold, using PWI or ASL) or impaired vascular reactivity as part of the lesion itself. For further and more in depth discussion of these approaches see section 2.1 on lesion identification and the paper on ‘Data Analysis’ by Meinzer et al., in this issue.
Other lesion-related participant variables to consider for studies examining recovery from aphasic stroke will depend on the question(s) being investigated e.g., whether to include or exclude individuals on the basis of old lesions, bilateral lesions or multiple lesions. Clinical intuition based on extensive experience represents an important aspect of aphasia treatment and management. Therefore a sensible approach for aphasia research may be to distinguish those lesions with no known clinical correlates and clinically relevant lesions. Many old lesions, such as lacunar strokes or periventricular white matter changes, may or may not influence language or its recovery. Research with stroke individuals is particularly vulnerable to this problem. The imaging threshold for identifying old lesions will be quite variable, depending on which MR sequences are used, for example, fluid-attenuated inversion-recovery (FLAIR) is more sensitive to detecting white matter lesions than T1 MRI. Nevertheless, it is important to define inclusionary and exclusionary criteria with respect to these variables in order to compare results across studies and offer insights into variability across patients with similar lesions (Basso et al., 1987, Arnold et al., 2008). If the extent and location of brain damage relates to brain plasticity and functional outcomes with different aphasia treatment approaches, then it is possible that clinical researchers may rely, in part, on individual’s structural neuroimaging data to design their fMRI studies and improve treatment outcomes.
2.1 Lesion Identification
Precise lesion identification in subjects with structural brain damage is essential for understanding lesion-deficit mappings in the human brain. The accuracy of the functional imaging data will be dependent on how well the lesion is identified and subsequently measured. High-resolution and high-definition imaging methods are likely to detect brain regions where anatomical damage is subtle or invisible to the eye. Most functional imaging studies will require at least a high resolution T1 image, e.g., high-resolution three-dimensional (3D) magnetization-prepared rapid acquisition with gradient echo (MPRAGE). This will improve not only the normalization of the functional images for each patient in a group fMRI study, but also will enable the description of each patient’s functional activation patterns in the context of their own structural damage e.g., superimpose their functional activations onto their own structural images to identify the ipsi-and contra-lesional activation. Brain regions activated during specific language tasks can then be compared to the lesion locations associated with impairment of the task of interest. The convergence of findings obtained from both lesion-deficit and functional neuroimaging approaches can offer strong support for hypotheses regarding brain-behavior relations and treatment effects.
The lesion-based approaches to the study of brain-behavior relations for language have focused primarily on the status of gray matter (i.e., the cortical and subcortical tissue), yet stroke rarely affects just the gray matter. It can damage white matter tracts, and other sequences such as T2* and FLAIR are better than T1 in visualizing white matter changes. There are mixed views regarding how to handle signal changes in the white matter, clinically best seen on FLAIR imaging (see Figure 2). White matter changes are common among people with diabetes and hypertension (people most at risk for stroke), and their significance is controversial. We suggest that in chronic aphasic stroke patients, non-specific white matter changes in isolation should not be identified as part of the stroke lesion unless they are the density of cerebrospinal fluid.
Figure 2.
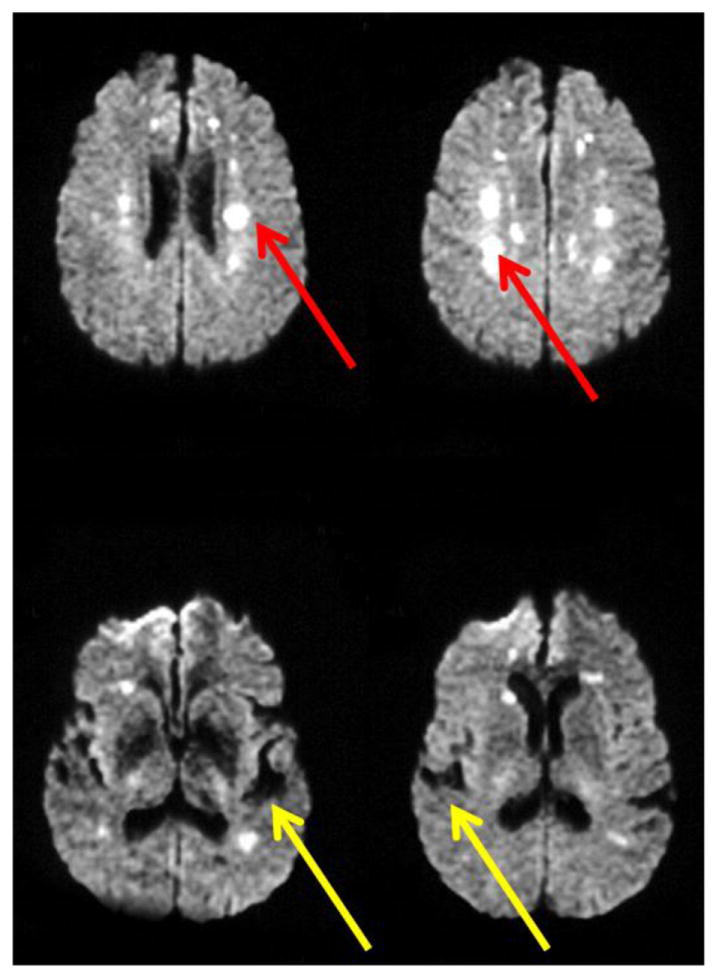
DWI sequences are ideal for distinguishing white matter hyperintensities from old stroke. White matter hyperintensities appear white (red arrows), whereas old strokes appear black (the density of cerebrospinal fluid; yellow arrows) on DWI sequences.
Where researchers are specifically investigating if white matter tracts have been damaged by the stroke, diffusion tensor imaging (DTI) to detect reduced white matter fractional anisotropy may be the most sensitive approach currently available (Martino et al.). An interesting application of diffusion tensor imaging (DTI) has been the study of Wallerian degeneration of clinically relevant white matter pathways, such as the corticospinal tract and the corpus callosum, following an ischemic stroke. The term Wallerian degeneration usually refers to the secondary degeneration of white matter fibers distant from the primary lesion, from two months to many years after stroke (Werring et al., 2000, Yu et al., 2009). How these secondary white matter diffusion changes impact on brain function and the BOLD response as measured with fMRI is currently a matter of intense investigation. In the area of aphasia, much of the focus of DTI has been on identifying white matter tracts that connect various nodes within language networks, such as components of “Broca’s area” or “Wernicke’s area” e.g., (Catani and Mesulam, 2008) and lesions within these tracts in aphasic individuals that relate to the language impairment. An alternative approach uses DTI to highlight that aphasia treatments can alter both function and structure of the brain areas that survived the stroke with corresponding positive behavioral outcomes. Gottfried Schlaug and colleagues (Schlaug et al., 2009) examined the density of white-matter fibers in the right hemisphere in six participants with chronic, non-fluent aphasia before and after receiving Melodic Intonation Aphasia Treatment. They found that the density of the white-matter tracts in the right hemisphere had increased among the participants upon completion of the treatment. The use of DTI in lesion analysis is still in the early stages but holds great promise to help advance our understanding of brain-behavior relationships as a means to evaluate the status of language networks, rather than simply considering the integrity of brain regions in isolation.
A variety of other approaches are available that provide insight regarding brain function, and additional lesion measures are rapidly developing. These include CT perfusion, MR spectroscopy, SPECT, positron emission tomography (PET) and may also contribute additional information when available. For example, Gradient Echo or Susceptibility-Weighted Images are very sensitive to old and new microhemorrhages that might influence overall recovery after stroke, while MR spectroscopy or PET can identify hypometabolic regions that contribute to the deficits. All of these different neuroimaging techniques might improve the description of the patient’s anatomical brain damage and its impact on their functional activation patterns in fMRI studies.
As mentioned earlier, when patients with chronic hypoperfusion are studied, MRA (or CTA), vascular reactivity measures, or perfusion imaging is particularly useful. In such cases, areas of hypoperfusion (as defined by a stated threshold, using PWI or ASL) or impaired vascular reactivity would also be considered as part of the lesion itself. For example, a 4 second delay in time to peak (TTP) arrival of contrast compared to the homologous region in the normal hemisphere on dynamic-contrast PWI is often considered dysfunctional tissue and might be included as part of the lesion (DeLeon et al., 2007). ASL provides a more absolute measure of regional cerebral flow (rCBF) than TTP; but rCBF can also be calculated from dynamic contrast PWI using arterial input function. However, to date ASL is more technically challenging than dynamic contrast PWI. As such, in many cases it can be lower resolution, with less brain coverage (fewer slices, unless using continuous ASL), and take longer in the scanner (requiring greater patient cooperation). Nevertheless, ASL has the distinct advantage that it does not require intravenous contrast. For an example see a recent study (Thompson et al., 2010) that used ASL with a modified PICORE/Q2TIPS sequence (Luh et al., 1999) to examine hypoperfused tissue in six individuals with chronic stroke-induced aphasia. These combined approaches hold considerable potential to provide a more comprehensive understanding of brain fMRI activity during language-processing tasks.
2.2 Lesion Site
One of the most important predictors for aphasia outcome is lesion site, although other factors such as lesion size, age, handedness, education, co-morbidity, and motivation may influence recovery patterns (see Rapp et al., this issue, for discussion). Brain damage following stroke is typically distributed in a complicated fashion, limited by the vascular anatomy rather than functional anatomy, affecting the structure and function of neighboring and distantly connected regions (Young et al., 2000, Thomalla et al., 2004). Each of these regions may have different degrees of structural damage and functional impairment (Young and Scannell, 2000, Rorden et al., 2007). There are presently many ways of identifying the site of lesion, including using anatomical landmarks such as specific gyri, or identifying approximate locations on an atlas of Brodmann’s areas, identifying the coordinates in a single brain e.g. Talairach space or average population based MNI Space (Mazziotta et al., 2001, Mori et al., 2008), specifying regions of interest (Mori et al., 2008), or identifying affected voxels on a given atlas to which the patient’s scans are registered. These methods provide convenient and automated means for macroanatomical labelling of multi-subject functional imaging data and do not require significant neuroanatomical experience. However, all methods have strengths and weaknesses and all are limited by individual variability of brain size and shape and variability of the sulci and gyri especially in higher order cortices, such as those involved in language processing. Therefore, any macroanatomical atlas based on a single brain such as the Talairach brain may often provide inaccurate information about functional localisation (Fischl et al., 2008).
While cytoarchitectonic probabilistic maps currently offer the most precise tool for the localization of brain functions as obtained from functional imaging studies, such maps do not cover the whole cortical surface and intrinsic variability in functional anatomy will also be observed because the anatomical ‘landmarks’ e.g., sulcal and gyral borders in structural MRI scans do not necessarily correspond to functionally relevant cytoarchitectural structure (Eickhoff et al., 2005, Amunts et al., 2007, Eickhoff et al., 2007). For example, the striking variations in the sulcal landmarks of Heschl’s Gyrus demonstrates that anatomic variability poses a serious obstacle for functional localisation based on macroanatomical labelling methods (Leonard et al., 1998). Nevertheless, currently, there is no evidence that any one of these structural labeling approaches is more valid than any other. Regardless of which method is selected, it is important that investigators specify clearly how they determined the site of lesions.
2.3 Lesion Volume
Although reporting the 3-D volume of a lesion would seem to be straightforward, it can vary considerably depending on the threshold of the lesion detection approach, type of MR sequence used as discussed above, and method of quantification. Stroke-induced lesions can affect both cortical and subcortical tissue. Therefore, lesion volume measurements need to include both. The challenge to investigators is that they must report how they define the borders of both cortical and subcortical lesions. As noted in the previous section, where indicated researchers also should consider as part of the “lesion” areas of tissue dysfunction, which can be addressed using a measure of hemodynamic function (e.g., regional cerebral blood flow (rCBF), blood volume, time to peak arrival of contrast agent). The “lesion” can then be defined either as a binary structural/function lesion or as continuous structural/functional lesion e.g. rCBF, white matter integrity-fractional anisotropy, or gray matter tissue density. Usually, the gold-standard method for lesion identification and volume measurement rests on the manual definition of abnormal brain tissue by a trained professional e.g.,(Bates et al., 2003). The volume is measured manually by extrapolating where normal brain would be present from the patient’s non-leisoned hemisphere or from an age-appropriate normal atlas. To determine the precise location and extent of damage, the lesion is demarcated on every slice and a lesion volume can then be generated. E.g. using the region of interest facility in Analyze software (Mayo Biomedical Imaging Resource, Mayo Clinic). This approach is laborious, operator-dependent e.g., (Filippi et al., 1995, Ashton et al., 2003), and time-consuming.
Alternatively, several semi-automated and fully automated procedures for lesion identification and volume measurements have been proposed. Automated methods nearly always have higher inter-rater and intra-rater reliability, but may fail to identify imaging artifacts that are appreciated by the human eye, which can lead to lower validity if not checked. They can be divided in two categories according to the nature of the MRI images used to identify the lesion: (i) multi-channel or multi-spectral methods that operate on several weighted MRI images, including T1, T2, PD, and FLAIR images, with or without contrast agents e.g., (Kabir et al., 2007); and (ii) mono-channel or monospectral methods that use only one contrast MRI image (e.g. T1 image) (Wilke et al., 2003, Stamatakis and Tyler, 2005). In functional MRI studies each participant usually has only one anatomical image (usually a T1 image). In this case, each image provides a continuous measure of brain composition in many thousands of voxels across the whole brain. These signal values can be converted into an estimate of gray, white, CSF and lesion density at every brain voxel e.g.,(Seghier et al., 2008). Using such a continuous measure of gray matter density can circumvent user-based errors introduced by the binary classification of whether an area appears damaged or not. If volume is measured with an automated method the investigator must specify the lesion detection thresholds used, e.g. 10 contiguous voxels with a tissue density value more than 2 s.d. below normal.
The lesion volume can then be measured using statistical analyses on a voxel-by-voxel basis ultimately providing brain maps indicating regions of significant tissue damage. Methods such as voxel-based morphometry that look at correlations between gray and white matter density in relation to behavioral factors (Ashburner, 2009) may be useful here to measure the lesion volume. With this approach the structural MRI scans are typically evaluated relative to a cohort of healthy brains. Statistical analyses on a voxel-by-voxel basis ultimately provide brain maps indicating regions of significant gray or white matter loss corresponding to the lesion location and volume. Analysis of an individual over time is also possible and can reveal subtle volumetric changes that would be difficult to identify otherwise (Good et al., 2001, Gorno-Tempini et al., 2004).
Ultimately, images can be produced that demonstrate lesion overlap in large patient cohorts, providing a powerful means to determine which cortical regions are likely to be essential for specific language processes. The 3-D images not only enable researchers to examine common and unique regions of brain damage across individuals, but also allow examination of the damaged regions for a cohort relative to their language behavior and functional brain responses (e.g. BOLD signal in fMRI). Schofield and colleagues adopted this approach to compare brain structure and function in two subgroups of 21 stroke subjects with either moderate or severe chronic speech comprehension impairment (Schofield et al., 2012). Both groups had damage to the supratemporal plane; however, the severely aphasic group suffered greater damage to two unimodal auditory areas: primary auditory cortex and the planum temporale. The effects of this damage were investigated using fMRI while subjects listened to speech and speech-like sounds. Pronounced changes in functional connectivity were found in both groups in undamaged parts of the auditory hierarchy. Compared to controls, moderate aphasics had significantly stronger feedback connections from planum temporale to primary auditory cortex bilaterally, while in severe aphasics this connection was significantly weaker in the undamaged right hemisphere. This result highlights that structural damage following stroke can have remote, bilateral functional effects in the task-related brain network that predicts language behavior and possibly aphasia treatment outcome. Understanding the lesion location and extent was key not only to understanding the severity of the aphasia but also the individual’s functional connectivity. Given this, it is possible that the beneficial effects of aphasia treatment may be expressed at the network level of functional connectivity of the remaining language system, rather than in any given region, be it in the left or right hemisphere.
Another approach is Voxel-based lesion-symptom mapping (VLSM) a method and software for analyzing relationships between behavioral deficits in neurological populations and lesion sites associated with those deficits (Bates et al., 2003). The major difference and advantage of VLSM over previous lesion-mapping methods is that it allows researchers to examine such data without stipulating behavioral cutoffs (e.g., impaired vs. spared performance), or identifying lesion sites of interests (e.g., parietal patients vs. inferior frontal patients). Instead VLSM calculates the statistical relationship between performance on a given task (such as naming or reading) and the status of a given brain voxel (damaged or healthy) across the whole brain. Patients are divided into two groups according to whether they do or do not have a lesion affecting a specific voxel. Behavioral scores are then compared for these two groups, yielding a t-statistic for that voxel. The procedure is then repeated several times for each voxel included in the analysis. Individuals with multiple strokes do not need to be excluded when using VLSM because it does not take into account how the effect of damage to one voxel depends on the effect of damage to other voxels. Rather, it looks for the most significant correlations between behavior and damage, irrespective of damage to other brain regions. VLSM maps can then be generated that show brain areas that are statistically related to a task of interest, can predict individual aphasic’s performance on fMRI tasks which may in turn be a biomarker for treatment outcome.
For example, Geva and colleagues used VLSM to determine the relation between inner and overt speech investigated previously using functional imaging (Geva et al., 2011). They showed that the neural inner speech abilities were affected by lesions to the left pars opercularis in the inferior frontal gyrus and to the white matter adjacent to the left supramarginal gyrus, over and above overt speech production and working memory. Their VLSM result suggests that inner speech cannot be assumed to be simply overt speech without a motor component and that the use of overt speech as a fMRI task to understand inner speech and vice versa might result in misleading conclusions, both in imaging studies of aphasia treatment and clinical practice. Combining differences in brain structure and function might explain this.
2.4 Reliability and other Considerations
Whatever methods the investigators choose to use to identify and characterize the lesion volume, site or other characteristics, intra-rater and inter-rater reliability must be reported. At least for lesion characterization purposes, MR scanner-to-scanner variability may not be a significant problem as long as magnet strength and sequences used are consistent, but these should be clearly specified. At least MR scanner-to-scanner variability is very small compared to the variability across individual brains.
For functional imaging studies of aphasia treatment, structural/functional lesions should ideally be defined by imaging at the same time or closely matched e.g., within 2 weeks before the onset of treatment and again directly following the end of treatment. Important structural as well as functional changes might occur over time, e.g. changes in gray matter density in response to relearning (Boyke et al., 2008, Driemeyer et al., 2008, Kloppel et al., 2010). In addition, when structural imaging measures (e.g. changes in gray matter density) are to be used as an outcome measure of aphasia therapy the pre and post therapy imaging, protocols must be identical.
3. Caveats and Future Directions
Whereas the previous paragraphs depict a relatively consistent and homogenous picture, several caveats should be kept in mind. First, the discussion of methods above assume in general that the structure of the chronic lesioned brain is a fixed entity, often neglecting that stroke damage to the cortex and/ or subcortical structures may continue to change over time, resulting in not only tissue loss in the core lesioned area but also Wallerian degeneration resulting in structural (Thomalla et al., 2004) and functional changes in remote regions. However, acquired language impairment is not always associated with obvious focal damage. For example, in cerebellar diachisis, left frontal lesions result in functional changes and tissue loss in right cerebellar regions (Shih et al., 2006). These secondary lesion effects may not be visible by eye, but can be detected using automated methods that detect gray and white matter volumetric changes in high resolution images and the cumulative effects of these structural changes may potentially impact language recovery. Second, whereas most work in the field focuses on studying the effects of treatment and language recovery on the BOLD response, some reports indicate that learning new skills in healthy subjects can result in increases in gray matter density (Draganski et al., 2004, Mechelli et al., 2004, Draganski and May, 2008). Similarly, language treatments in aphasic patients that improve performance may be expected to correlate with not only changes in the BOLD response, but also plasticity in gray matter density in the structurally intact cortices involved in the recovery process. Third, one caveat of many previous investigations has been the focus on short-term improvements in performance. More experiments are required to assess the effects of aphasia treatment on both structural and functional brain plasticity, their interaction with specific language learning and the extent to which improvements are retained in the long term. Finally, it should be kept in mind that the effects of treatment on language recovery in acute and chronic aphasic stroke cannot be assumed to be the same. The mechanisms underlying recovery at different stages after stroke are very likely to differ not only in their effects on cortical structure and function, but also the neural networks that subserve language processing and behavioral consequences. Clearly more work is needed in this area.
4. Summary
Detailed lesion characterization can contribute to the understanding of not only the structural mechanisms underlying aphasia, but also when combined with fMRI studies the structural and functional plasticity supporting language recovery. As such, every functional neuroimaging study of aphasia treatment should begin by adequately characterizing the lesions of the study participants. The results may critically depend on features of the lesion, such as location and volume. At present, there are no gold standards for characterizing lesions, but there are many methods that can be applied to provide sufficient information to use for evaluating changes in functional activation that occur as a result of treatment. There are few studies comparing both reliability and validity of different approaches to lesion localization or quantification. However, the accumulation and analysis of data to which various methods are consistently applied by the same or different investigators will allow more definitive guidelines to emerge in the future.
Data from fMRI studies will need to be integrated with those from high resolution structural MRI to advance our understanding of which individuals with aphasia are likely to recover after stroke and enhance our ability to predict which treatment approach may best benefit them. Despite limitations, including the scarcity of detailed anatomical data especially in population studies of aphasic stroke patients, work that has been already accomplished raises the exciting hypothesis that currently available noninvasive neuroimaging techniques –combining structural and functional MRI, could offer early biomarkers to recovery and help develop targeted treatment programs.
Highlights.
Recommendations for quantification of brain lesions following aphasic stroke
Methods for detailing and characterizing acquired brain damage
Discussion of how lesions influence results of fMRI studies in chronic aphasic stroke patients
Acknowledgments
The authors wish to thank the School of Communication and the Vice President for Research at Northwestern University for providing funds to support the Neuroimaging in Aphasia Treatment Research Workshop held at Northwestern University, July 2009. Participants of the workshop, who contributed to the ideas in this paper include: Ana Ansaldo, Roelien Bastiaanse, Pelagie Beeson, Stephano Cappa, David Caplin, Leora Cherney, David Copland, Jenny Crinion, Bruce Crosson, Dirk den Ouden, Susan Edwards, Evy Fitch-Brink, Julius Fridriksson, Argye Hillis, Audrey Holland, Chien-Ju Hsu, Aneta Kielar, Monique King, Swathi Kiran, Jim Kloet, Sladjana Lukic, Marcus Meinzer, Charis Price, Ellyn Riley, Steve Small, Benda Rapp, Dorothee Saur, Marion Smits, Yasmeen Faroqi-Shah, Cynthia Thompson, Eisha Wali.
This work was supported by the UK Medical Research Council Clinical Scientist Fellowship G0701888 (JC), the Australian Research Council Discovery grant (DP0880556) and National Health and Medical Research Council Career Development Award (DC), and the National Institutes of Health, Institute on Deafness and other Communication Disorders: R01DCOI948-17 and R01DC007213 (CT), and R01DC05375 (AH).
Footnotes
These challenges are not recommended for individuals with impaired vascular reserve purely for research purposes, however, because they could, at least theoretically, cause cerebral ischemia.
Publisher's Disclaimer: This is a PDF file of an unedited manuscript that has been accepted for publication. As a service to our customers we are providing this early version of the manuscript. The manuscript will undergo copyediting, typesetting, and review of the resulting proof before it is published in its final citable form. Please note that during the production process errors may be discovered which could affect the content, and all legal disclaimers that apply to the journal pertain.
References
- Altamura C, Reinhard M, Vry MS, Kaller CP, Hamzei F, Vernieri F, Rossini PM, Hetzel A, Weiller C, Saur D. The longitudinal changes of BOLD response and cerebral hemodynamics from acute to subacute stroke. A fMRI and TCD study. BMC Neurosci. 2009;10:151. doi: 10.1186/1471-2202-10-151. [DOI] [PMC free article] [PubMed] [Google Scholar]
- Amunts K, Schleicher A, Zilles K. Cytoarchitecture of the cerebral cortex--more than localization. Neuroimage. 2007;37:1061–1065. doi: 10.1016/j.neuroimage.2007.02.037. discussion 1066-1068. [DOI] [PubMed] [Google Scholar]
- Arnold M, Halpern M, Meier N, Fischer U, Haefeli T, Kappeler L, Brekenfeld C, Mattle HP, Nedeltchev K. Age-dependent differences in demographics, risk factors, co-morbidity, etiology, management, and clinical outcome of acute ischemic stroke. J Neurol. 2008;255:1503–1507. doi: 10.1007/s00415-008-0949-9. [DOI] [PubMed] [Google Scholar]
- Ashburner J. Computational anatomy with the SPM software. Magn Reson Imaging. 2009;27:1163–1174. doi: 10.1016/j.mri.2009.01.006. [DOI] [PubMed] [Google Scholar]
- Ashton EA, Takahashi C, Berg MJ, Goodman A, Totterman S, Ekholm S. Accuracy and reproducibility of manual and semiautomated quantification of MS lesions by MRI. J Magn Reson Imaging. 2003;17:300–308. doi: 10.1002/jmri.10258. [DOI] [PubMed] [Google Scholar]
- Awad M, Warren JE, Scott SK, Turkheimer FE, Wise RJ. A common system for the comprehension and production of narrative speech. J Neurosci. 2007;27:11455–11464. doi: 10.1523/JNEUROSCI.5257-06.2007. [DOI] [PMC free article] [PubMed] [Google Scholar]
- Basso A, Bracchi M, Capitani E, Laiacona M, Zanobio ME. Age and evolution of language area functions. A study on adult stroke patients. Cortex. 1987;23:475–483. doi: 10.1016/s0010-9452(87)80008-4. [DOI] [PubMed] [Google Scholar]
- Bates E, Wilson SM, Saygin AP, Dick F, Sereno MI, Knight RT, Dronkers NF. Voxel-based lesion-symptom mapping. Nat Neurosci. 2003;6:448–450. doi: 10.1038/nn1050. [DOI] [PubMed] [Google Scholar]
- Bonilha L, Fridriksson J. Subcortical damage and white matter disconnection associated with non-fluent speech. Brain. 2009;132:e108. doi: 10.1093/brain/awn200. [DOI] [PMC free article] [PubMed] [Google Scholar]
- Boyke J, Driemeyer J, Gaser C, Buchel C, May A. Training-induced brain structure changes in the elderly. J Neurosci. 2008;28:7031–7035. doi: 10.1523/JNEUROSCI.0742-08.2008. [DOI] [PMC free article] [PubMed] [Google Scholar]
- Catani M, Mesulam M. The arcuate fasciculus and the disconnection theme in language and aphasia: History and current state. Cortex. 2008;44:953–961. doi: 10.1016/j.cortex.2008.04.002. [DOI] [PMC free article] [PubMed] [Google Scholar]
- DeLeon J, Gottesman RF, Kleinman JT, Newhart M, Davis C, Heidler-Gary J, Lee A, Hillis AE. Neural regions essential for distinct cognitive processes underlying picture naming. Brain. 2007;130:1408–1422. doi: 10.1093/brain/awm011. [DOI] [PubMed] [Google Scholar]
- Draganski B, Gaser C, Busch V, Schuierer G, Bogdahn U, May A. Neuroplasticity: changes in grey matter induced by training. Nature. 2004;427:311–312. doi: 10.1038/427311a. [DOI] [PubMed] [Google Scholar]
- Draganski B, May A. Training-induced structural changes in the adult human brain. Behav Brain Res. 2008;192:137–142. doi: 10.1016/j.bbr.2008.02.015. [DOI] [PubMed] [Google Scholar]
- Driemeyer J, Boyke J, Gaser C, Buchel C, May A. Changes in gray matter induced by learning--revisited. PLoS One. 2008;3:e2669. doi: 10.1371/journal.pone.0002669. [DOI] [PMC free article] [PubMed] [Google Scholar]
- Dronkers NF, Plaisant O, Iba-Zizen MT, Cabanis EA. Paul Broca’s historic cases: high resolution MR imaging of the brains of Leborgne and Lelong. Brain. 2007;130:1432–1441. doi: 10.1093/brain/awm042. [DOI] [PubMed] [Google Scholar]
- Eickhoff SB, Paus T, Caspers S, Grosbras MH, Evans AC, Zilles K, Amunts K. Assignment of functional activations to probabilistic cytoarchitectonic areas revisited. Neuroimage. 2007;36:511–521. doi: 10.1016/j.neuroimage.2007.03.060. [DOI] [PubMed] [Google Scholar]
- Eickhoff SB, Stephan KE, Mohlberg H, Grefkes C, Fink GR, Amunts K, Zilles K. A new SPM toolbox for combining probabilistic cytoarchitectonic maps and functional imaging data. Neuroimage. 2005;25:1325–1335. doi: 10.1016/j.neuroimage.2004.12.034. [DOI] [PubMed] [Google Scholar]
- Fair DA, Snyder AZ, Connor LT, Nardos B, Corbetta M. Task-evoked BOLD responses are normal in areas of diaschisis after stroke. Neurorehabilitation and neural repair. 2009;23:52–57. doi: 10.1177/1545968308317699. [DOI] [PMC free article] [PubMed] [Google Scholar]
- Filippi M, Horsfield MA, Bressi S, Martinelli V, Baratti C, Reganati P, Campi A, Miller DH, Comi G. Intra- and inter-observer agreement of brain MRI lesion volume measurements in multiple sclerosis. A comparison of techniques. Brain. 1995;118(Pt 6):1593–1600. doi: 10.1093/brain/118.6.1593. [DOI] [PubMed] [Google Scholar]
- Fischl B, Rajendran N, Busa E, Augustinack J, Hinds O, Yeo BT, Mohlberg H, Amunts K, Zilles K. Cortical folding patterns and predicting cytoarchitecture. Cereb Cortex. 2008;18:1973–1980. doi: 10.1093/cercor/bhm225. [DOI] [PMC free article] [PubMed] [Google Scholar]
- Fridriksson J, Bonilha L, Rorden C. Severe Broca’s aphasia without Broca’s area damage. Behav Neurol. 2007;18:237–238. doi: 10.1155/2007/785280. [DOI] [PMC free article] [PubMed] [Google Scholar]
- Geva S, Jones PS, Crinion JT, Price CJ, Baron JC, Warburton EA. The neural correlates of inner speech defined by voxel-based lesion-symptom mapping. Brain : a journal of neurology. 2011;134:3071–3082. doi: 10.1093/brain/awr232. [DOI] [PMC free article] [PubMed] [Google Scholar]
- Good CD, Johnsrude IS, Ashburner J, Henson RN, Friston KJ, Frackowiak RS. A voxel-based morphometric study of ageing in 465 normal adult human brains. Neuroimage. 2001;14:21–36. doi: 10.1006/nimg.2001.0786. [DOI] [PubMed] [Google Scholar]
- Gorno-Tempini ML, Murray RC, Rankin KP, Weiner MW, Miller BL. Clinical, cognitive and anatomical evolution from nonfluent progressive aphasia to corticobasal syndrome: a case report. Neurocase. 2004;10:426–436. doi: 10.1080/13554790490894011. [DOI] [PMC free article] [PubMed] [Google Scholar]
- Hillis AE. Brain/language relationships identified with diffusion and perfusion MRI: Clinical applications in neurology and neurosurgery. Ann N Y Acad Sci. 2005;1064:149–161. doi: 10.1196/annals.1340.027. [DOI] [PubMed] [Google Scholar]
- Hillis AE, Work M, Barker PB, Jacobs MA, Breese EL, Maurer K. Re-examining the brain regions crucial for orchestrating speech articulation. Brain. 2004;127:1479–1487. doi: 10.1093/brain/awh172. [DOI] [PubMed] [Google Scholar]
- Kabir Y, Dojat M, Scherrer B, Forbes F, Garbay C. Multimodal MRI segmentation of ischemic stroke lesions. Conf Proc IEEE Eng Med Biol Soc. 2007;2007:1595–1598. doi: 10.1109/IEMBS.2007.4352610. [DOI] [PMC free article] [PubMed] [Google Scholar]
- Kloppel S, Mangin JF, Vongerichten A, Frackowiak RS, Siebner HR. Nurture versus nature: long-term impact of forced right-handedness on structure of pericentral cortex and basal ganglia. J Neurosci. 2010;30:3271–3275. doi: 10.1523/JNEUROSCI.4394-09.2010. [DOI] [PMC free article] [PubMed] [Google Scholar]
- Leonard CM, Puranik C, Kuldau JM, Lombardino LJ. Normal variation in the frequency and location of human auditory cortex landmarks. Heschl’s gyrus: where is it? Cereb Cortex. 1998;8:397–406. doi: 10.1093/cercor/8.5.397. [DOI] [PubMed] [Google Scholar]
- Luh WM, Wong EC, Bandettini PA, Hyde JS. QUIPSS II with thin-slice TI1 periodic saturation: A method for improving accuracy of quantitative perfusion imaging using pulsed arterial spin labeling. Magn Reson Med. 1999;41:1246–1254. doi: 10.1002/(sici)1522-2594(199906)41:6<1246::aid-mrm22>3.0.co;2-n. [DOI] [PubMed] [Google Scholar]
- Martino D, Draganski B, Cavanna A, Church A, Defazio G, Robertson MM, Frackowiak RS, Giovannoni G, Critchley HD. Anti-basal ganglia antibodies and Tourette’s syndrome: a voxel-based morphometry and diffusion tensor imaging study in an adult population. J Neurol Neurosurg Psychiatry. 2008;79:820–822. doi: 10.1136/jnnp.2007.136689. [DOI] [PubMed] [Google Scholar]
- Mazziotta J, Toga A, Evans A, Fox P, Lancaster J, Zilles K, Woods R, Paus T, Simpson G, Pike B, Holmes C, Collins L, Thompson P, MacDonald D, Iacoboni M, Schormann T, Amunts K, Palomero-Gallagher N, Geyer S, Parsons L, Narr K, Kabani N, Le Goualher G, Boomsma D, Cannon T, Kawashima R, Mazoyer B. A probabilistic atlas and reference system for the human brain: International Consortium for Brain Mapping (ICBM) Philos Trans R Soc Lond B Biol Sci. 2001;356:1293–1322. doi: 10.1098/rstb.2001.0915. [DOI] [PMC free article] [PubMed] [Google Scholar]
- Mechelli A, Crinion JT, Noppeney U, O’Doherty J, Ashburner J, Frackowiak RS, Price CJ. Structural plasticity in the bilingual brain - Proficiency in a second language and age at acquisition affect grey-matter density. Nature. 2004;431:757–757. doi: 10.1038/431757a. [DOI] [PubMed] [Google Scholar]
- Mori S, Oishi K, Jiang H, Jiang L, Li X, Akhter K, Hua K, Faria AV, Mahmood A, Woods R, Toga AW, Pike GB, Neto PR, Evans A, Zhang J, Huang H, Miller MI, van Zijl P, Mazziotta J. Stereotaxic white matter atlas based on diffusion tensor imaging in an ICBM template. Neuroimage. 2008;40:570–582. doi: 10.1016/j.neuroimage.2007.12.035. [DOI] [PMC free article] [PubMed] [Google Scholar]
- Murata Y, Sakatani K, Hoshino T, Fujiwara N, Kano T, Nakamura S, Katayama Y. Effects of cerebral ischemia on evoked cerebral blood oxygenation responses and BOLD contrast functional MRI in stroke patients. Stroke; a journal of cerebral circulation. 2006;37:2514–2520. doi: 10.1161/01.STR.0000239698.50656.3b. [DOI] [PubMed] [Google Scholar]
- Naeser MA, Helm-Estabrooks N, Haas G, Auerbach S, Srinivasan M. Relationship between lesion extent in ‘Wernicke’s area’ on computed tomographic scan and predicting recovery of comprehension in Wernicke’s aphasia. Arch Neurol. 1987;44:73–82. doi: 10.1001/archneur.1987.00520130057018. [DOI] [PubMed] [Google Scholar]
- Newhart M, Ken L, Kleinman JT, Heidler-Gary J, Hillis AE. Neural networks essential for naming and word comprehension. Cogn Behav Neurol. 2007;20:25–30. doi: 10.1097/WNN.0b013e31802dc4a7. [DOI] [PubMed] [Google Scholar]
- Prabhakaran V, Raman SP, Grunwald MR, Mahadevia A, Hussain N, Lu H, Van Zijl PC, Hillis AE. Neural substrates of word generation during stroke recovery: the influence of cortical hypoperfusion. Behav Neurol. 2007;18:45–52. doi: 10.1155/2007/430402. [DOI] [PMC free article] [PubMed] [Google Scholar]
- Rorden C, Karnath HO, Bonilha L. Improving lesion-symptom mapping. J Cogn Neurosci. 2007;19:1081–1088. doi: 10.1162/jocn.2007.19.7.1081. [DOI] [PubMed] [Google Scholar]
- Saur D, Lange R, Baumgaertner A, Schraknepper V, Willmes K, Rijntjes M, Weiller C. Dynamics of language reorganization after stroke. Brain. 2006;129:1371–1384. doi: 10.1093/brain/awl090. [DOI] [PubMed] [Google Scholar]
- Saur D, Ronneberger O, Kummerer D, Mader I, Weiller C, Kloppel S. Early functional magnetic resonance imaging activations predict language outcome after stroke. Brain. 2010;133:1252–1264. doi: 10.1093/brain/awq021. [DOI] [PubMed] [Google Scholar]
- Schlaug G, Marchina S, Norton A. Evidence for plasticity in white-matter tracts of patients with chronic Broca’s aphasia undergoing intense intonation-based speech therapy. Annals of the New York Academy of Sciences. 2009;1169:385–394. doi: 10.1111/j.1749-6632.2009.04587.x. [DOI] [PMC free article] [PubMed] [Google Scholar]
- Schofield TM, Penny WD, Stephan KE, Crinion JT, Thompson AJ, Price CJ, Leff AP. Changes in auditory feedback connections determine the severity of speech processing deficits after stroke. The Journal of neuroscience : the official journal of the Society for Neuroscience. 2012;32:4260–4270. doi: 10.1523/JNEUROSCI.4670-11.2012. [DOI] [PMC free article] [PubMed] [Google Scholar]
- Seghier ML, Ramlackhansingh A, Crinion J, Leff AP, Price CJ. Lesion identification using unified segmentation-normalisation models and fuzzy clustering. Neuroimage. 2008;41:1253–1266. doi: 10.1016/j.neuroimage.2008.03.028. [DOI] [PMC free article] [PubMed] [Google Scholar]
- Shih WJ, Huang WS, Milan PP. F-18 FDG PET demonstrates crossed cerebellar diaschisis 20 years after stroke. Clin Nucl Med. 2006;31:259–261. doi: 10.1097/01.rlu.0000210526.50300.f7. [DOI] [PubMed] [Google Scholar]
- Stamatakis EA, Tyler LK. Identifying lesions on structural brain images--validation of the method and application to neuropsychological patients. Brain Lang. 2005;94:167–177. doi: 10.1016/j.bandl.2004.12.010. [DOI] [PubMed] [Google Scholar]
- Thomalla G, Glauche V, Koch MA, Beaulieu C, Weiller C, Rother J. Diffusion tensor imaging detects early Wallerian degeneration of the pyramidal tract after ischemic stroke. Neuroimage. 2004;22:1767–1774. doi: 10.1016/j.neuroimage.2004.03.041. [DOI] [PubMed] [Google Scholar]
- Thompson CK, den Ouden DB, Bonakdarpour B, Garibaldi K, Parrish TB. Neural plasticity and treatment-induced recovery of sentence processing in agrammatism. Neuropsychologia. 2010;48:3211–3227. doi: 10.1016/j.neuropsychologia.2010.06.036. [DOI] [PMC free article] [PubMed] [Google Scholar]
- Werring DJ, Toosy AT, Clark CA, Parker GJM, Barker GJ, Miller DH, Thompson AJ. Diffusion tensor imaging can detect and quantify corticospinal tract degeneration after stroke. J Neurol Neurosur Ps. 2000;69:269–272. doi: 10.1136/jnnp.69.2.269. [DOI] [PMC free article] [PubMed] [Google Scholar]
- Wilke M, Kassubek J, Ziyeh S, Schulze-Bonhage A, Huppertz HJ. Automated detection of gray matter malformations using optimized voxel-based morphometry: a systematic approach. Neuroimage. 2003;20:330–343. doi: 10.1016/s1053-8119(03)00296-9. [DOI] [PubMed] [Google Scholar]
- Wise RJ, Scott SK, Blank SC, Mummery CJ, Murphy K, Warburton EA. Separate neural subsystems within ‘Wernicke’s area’. Brain. 2001;124:83–95. doi: 10.1093/brain/124.1.83. [DOI] [PubMed] [Google Scholar]
- Young MP, Hilgetag CC, Scannell JW. On imputing function to structure from the behavioural effects of brain lesions. Philos Trans R Soc Lond B Biol Sci. 2000;355:147–161. doi: 10.1098/rstb.2000.0555. [DOI] [PMC free article] [PubMed] [Google Scholar]
- Young MP, Scannell JW. Brain structure-function relationships: advances from neuroinformatics. Philos Trans R Soc Lond B Biol Sci. 2000;355:3–6. doi: 10.1098/rstb.2000.0545. [DOI] [PMC free article] [PubMed] [Google Scholar]
- Yu CS, Zhu CZ, Zhang YJ, Chen H, Qin W, Wang ML, Li KC. A longitudinal diffusion tensor imaging study on Wallerian degeneration of corticospinal tract after motor pathway stroke. Neuroimage. 2009;47:451–458. doi: 10.1016/j.neuroimage.2009.04.066. [DOI] [PubMed] [Google Scholar]