Abstract
The effect of activation of liver X receptor by N-(2,2,2-trifluoroethyl)-N-[4-[2,2,2-trifluoro-1-hydroxy-1(trifluoromethyl)ethyl]phenyl] benzenesulfonamide (T0901317) on high fat diet (HFD)-induced obesity and insulin resistance was examined in C57BL/6 mice. When on HFD continuously for 10 weeks, C57BL/6 mice became obese with an average body weight of 42 g, insulin resistant, and glucose intolerant. Twice weekly intraperitoneal injections of T0901317 at 50 mg/kg in animals on the same diet completely blocked obesity development, obesity-associated insulin resistance, and glucose intolerance. Quantitative real-time PCR analysis showed that T0901317-treated animals had significantly higher mRNA levels of genes involved in energy metabolism, including Ucp-1, Pgc1a, Pgc1b, Cpt1a, Cpt1b, Acadm, Acadl, Aox, and Ehhadh. Transcription activation of Cyp7a1, Srebp-1c, Fas, Scd-1, and Acc-1 genes was also seen in T0901317-treated animals. T0901317 treatment induced reversible aggregation of lipids in the liver. These results suggest that liver X receptor could be a potential target for prevention of obesity and obesity-associated insulin resistance.
Electronic supplementary material
The online version of this article (doi:10.1208/s12248-012-9429-3) contains supplementary material, which is available to authorized users.
KEY WORDS: diabetes, high fat diet-induced obesity, liver X receptor, nuclear receptor, T0901317
INTRODUCTION
With changes in lifestyle and dietary structure, obesity has become a major health problem (1). In the USA, approximately 70% of adults are overweight and among them 30% are obese (2). It is estimated that there are more than one billion overweight and 300 million obese adults in the world. Given the current trends, the World Health Organization predicts that by 2015, approximately 2.3 billion adults will be overweight and more than 700 million will be obese (3). In addition, obesity has been recognized as a major risk factor for many severe diseases such as diabetes, cardiovascular disease, arthritis, and non-alcoholic fatty liver disease (4). Studies have shown that obesity is primarily caused by unbalanced energy intake and energy expenditure, resulting in an excessive fat accumulation in the adipose tissue (5).
Nuclear receptors represent a class of transcription factors capable of sensing exogenous and endogenous chemical signals and regulating the expression of related genes (6). Studies in recent years have suggested that nuclear receptors are intimately linked to the physiology of diabetes (6–8). Thiazolidinedione, a ligand of peroxisome proliferator-activated receptor-gamma (9), and ligand of retinoid X receptor have been shown to lower glucose levels in diabetic rodents (10).
Liver X receptors (LXR) are nuclear receptors that play a key role in regulating cholesterol, fatty acid, and glucose metabolism (11). Activation of LXR has been shown to regulate gene expression linked to carbohydrate homeostasis and serves as the molecular target for the treatment of hyperglycemia and insulin resistance (12). Treatment of diabetic rodents with LXR agonist, N-(2,2,2-trifluoroethyl)-N-[4-[2,2,2-trifluoro-1-hydroxy-1 (trifluoromethyl) ethyl]phenyl] benzenesulfonamide (T0901317), resulted in dramatic reduction of plasma glucose (13). In insulin-resistant Zucker (fa/fa) rats, T0901317 significantly improved insulin sensitivity by inhibiting expression of phosphoenolpyruvate carboxykinase gene (Pepck) (14). It was also shown in C57BL/KsJ-obese db/db mice that T0901317 suppresses expression of glucocorticoid receptor gene and improved the phenotype of type 2 diabetes (13). These observations raise the possibility for beneficial metabolic effects of LXR activation on glucose homeostasis and diabetes. However, little is known about LXR activation on prevention of high fat diet-induced obesity and insulin resistance.
In this study, we examined the potent effects of chronic activation of LXR by its agonist T0901317 on protection of mice from development of high fat diet-induced obesity and insulin resistance. We also investigated the possible role of T0901317 in blocking fat accumulation in the adipose tissue. Finally, we tested the direct effects of T0901317 on expression of genes responsible for maintaining metabolic homeostasis.
MATERIALS AND METHODS
Animals and Animal Treatments
Male C57BL/6 mice were purchased from Charles River (Wilmington, MA) and housed under a 12-h light–dark cycle. The mice were divided into two groups (n = 5) and fed with HFD from Bio-Serv (Frenchtown, NJ) for 10 weeks. Beginning in week 1, one group of animals (treated group) was intraperitoneally (i.p.) given T0901317 (Cayman Chemical, structure shown in Fig. 1) solubilized in DMSO twice weekly at a dose of 50 mg/kg. The second group was given the same volume of DMSO as a control, and named as control group. The food intake and body weight of the mice in both groups were determined twice weekly. The BMI value was calculated as body weight (grams) divided by the square of the anal–nasal length (centimeters) (15). The body composition was analyzed using EchoMRI-100 from Echo Medical Systems (Houston, TX). Animals were sacrificed at the end of 10 weeks for histological and biochemical analysis.
Fig. 1.
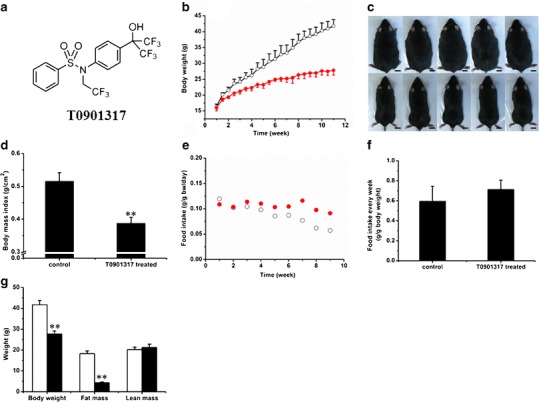
Effect of T0901317 treatment on animal growth, food intake, and body composition. a Structure of T0901317. b Growth curves of control (open circle) and T0901317-treated (solid circle) animals. c Photo images of mice from control (upper panel) and T0901317-treated (lower panel) animals. (Bar length = 1 cm). d Body mass index. (n = 5, **P < 0.01). e Average weekly food intake. f Food intake per week for control (open circle) and T0901317-treated (solid circle) animals. g Body composition for control (white) and T0901317-treated (black) animals (n = 5, **P < 0.01)
To test the reversibility of T0901317-induced lipid accumulation in the liver, the mice were divided into three groups (n = 5), including a control, T0901317 treated, and T0901317 withdrawal group. On day 1, the T0901317-treated group was put on high fat diet and started daily treatment with T0901317 (i.p., 50 mg/kg) for 7 days, while the control group was on high fat diet and treated with DMSO. Mice in the T0901317 withdrawal group were first given T0901317 (i.p., 50 mg/kg) daily for 7 days, stayed treatment free for additional 7 days, and then sacrificed. The use of mice in this study was compliant with relevant federal guidelines and institutional policies, and the animal protocol was approved by the IACUC at the University of Georgia, Athens, GA.
IPGTT and ITT
During the last week of the experiment, the intraperitoneal glucose tolerance test (IPGTT) and insulin tolerance test (ITT) were performed after the last T0901317 treatment. For IPGTT, mice were fasted overnight before the injection of glucose (2 g/kg, i.p.), and the blood glucose level was measured at the predetermined time points using glucose test strips and glucose meters. For ITT, the mice fasted for 4 h before the injection of insulin (Humulin, 0.5 U/kg) from Eli Lilly (Indianapolis, IN), and the blood glucose level was measured at predetermined time points using the same method as above. The Homeostasis Model of Assessment–Insulin Resistance (HOMA-IR) value was calculated using previously established formula: HOMA-IR = [fasting insulin (nanograms per milliliter) × fasting plasma glucose (milligrams per deciliter)/405] (16).
Gene Expression Analysis
Total RNA was isolated using a TRIZOL reagent from Invitrogen. RT-PCR was performed using a Superscript RT III enzyme kit from Invitrogen. The quantitative real-time PCR (qRT-PCR) was performed using SYBR Green as the detection reagent. All of the primers for real-time PCR were synthesized at Sigma (St. Louis, MO). The name of genes, their functions, and the primer sequences for qPCR amplification are listed in Supplementary Table 1. Melting curve analyses of all real-time PCR products were performed and shown to produce a single DNA duplex. Quantitative measurements were determined using the ∆∆Ct method, and the GAPDH mRNA was used as an internal control.
Western Blot Analysis
The tissue lysates were prepared using a lysis buffer containing 50 mmol/L Tris, 150 mmol/L NaCl, 0.02% sodium azide, 1% SDS, and the cocktail protease inhibitors (pH 8.0), and then centrifuged at 12,000 rpm for 20 min at 4°C. The protein concentration in supernatant was determined by the Bradford assay. Fifty micrograms of total proteins was separated on 12% SDS–PAGE gel and then transferred to PVDF membrane. After being blocked with 5% non-fat milk overnight at 4°C, the transferred membrane was incubated with primary antibodies against UCP-1 (Abcam, Cambridge, MA) for 1 h at room temperature and then washed in TBST buffer three times. After washing, the membrane was incubated with a secondary antibody (Santa Cruz, CA) for 1 h and washed again using PBST buffer three times. The protein bands were visualized using an ECL kit according to manufacturer’s instruction (Pierce, Rockford, IL). The film was scanned, and protein bands were quantified using Bio-Rad Quantity One 1-D analysis software. GAPDH (Santa Cruz, CA) was used as an internal reference.
Histochemistry Analysis
Freshly collected tissue samples were fixed in 4% formaldehyde. After dehydration with gradient ethanol solution, the samples were processed twice using xylene and embedded in paraffin. Tissue sections (6 μm in thickness) were made, spread on a slide, and baked at 60°C for 1 h. The slides were stained with hematoxylin and eosin (H&E), mounted with Permount medium (Fisher Scientific), and examined under an optical microscope.
Frozen Section and Oil-Red O Staining
The tissue was placed in an optimal cutting temperature chamber overnight at −80°C, and 6-μm sections were made. Tissue slices were rinsed with PBS, raised with 60% isopropanol, and stained with freshly prepared Oil-red O working solution for 15 min. Tissue slices were rinsed with 60% isopropanol again and counterstained with hematoxylin for nucleus. The slides were mounted and examined under an optical microscope.
Immunohistochemistry Staining
The procedure for tissue section preparation is the same as that of H&E staining. The sections were immersed in 10 mmol/L citrate buffer (pH 6.0) and processed in a thermostatic water bath for antigen retrieval and incubated in 3% H2O2 for 15 min at room temperature. Tissue sections were blocked in 10% normal serum and 1% BSA in TBS buffer for 2 h at room temperature following the manufacturer’s instructions on the IHC kit (Millipore, Billerica, MA). The primary antibodies used were anti-UCP-1 and anti-insulin antibodies (Abcam, Cambridge, MA).
Statistical Analysis
Statistical analysis was performed using the Student’s t test and ANOVA. The results were expressed as the mean ± SD. A P value below 0.05 (P < 0.05) was considered significantly different.
RESULTS
Effect of T0901317 on Animal Growth, Food Intake, and Body Composition
Effect of T0901317 on HFD-fed animals was examined. Biweekly injections of T0901317 (i.p.) significantly slowed down the weight gain of C57/BL6 mice compared to the control animals receiving only carrier solution (Fig. 1b). In a period of 10 weeks, each animal in the control group gained about 2.3 ± 0.6 g per week, reaching a body weight of 41.8 ± 2.0 g at the end of experiment. In contrast, T0901317-treated animals gained an average of 0.9 ± 0.6 g per week with a final body weight of 28.7 ± 1.5 g, 33.5 ± 3.6% less than that of control animals. The size difference between the two groups is easily recognized even with the naked eye (Fig. 1c). The body mass index is 5.2 ± 0.3 for control and 3.8 ± 0.2 for treated animals (Fig. 1d).
The average food intake by each animal was examined twice weekly with measurements of food consumption and plotted as the function of time. Figure 1e showed that animals ate an average of 0.05–0.1 g of HFD food per day, per gram of body weight. Food consumption tends to decrease slightly with an increase in time. The average food consumption per week, per gram of body weight is 0.6 ± 0.2 g/g in the control group and 0.7 ± 0.1 g/g in the T0901317-treated group (Fig. 1f). No statistical difference is seen in food consumption between these two groups. Body composition analysis (Fig. 1g) reveals a similar lean mass for both groups of animals (20.2 ± 1.2 g for control and 21.2 ± 1.6 g for the treated) and significant difference in fat mass (18.2 ± 1.4 g for control animals and 4.3 ± 0.5 g for treated animals). Each of the T0901317-treated animals had approximately 14 g less fat than each of the control animals. These results suggest that the T0901317 treatment blocked fat accumulation in HFD-fed animals.
Effect of T0901317 Treatment on Adipose Tissue
The effect of T0901317 treatment on adipose tissue was examined. Figure 2a shows gross appearance of the white epididymal and perirenal adipose tissue, and brown adipose tissue (BAT). Figure 2b shows that the average epididymal fat in control animals is 2.8 ± 0.3 g and 0.5 ± 0.2 g in T0901317-treated animals. The average perirenal fat is 1.2 ± 0.3 and 0.2 ± 0.0 g, respectively. No difference (0.2 ± 0.0 g) was seen in brown fat between the treated and control groups. These results suggest that T0901317 blocks the growth of white adipose tissue (WAT).
Fig. 2.
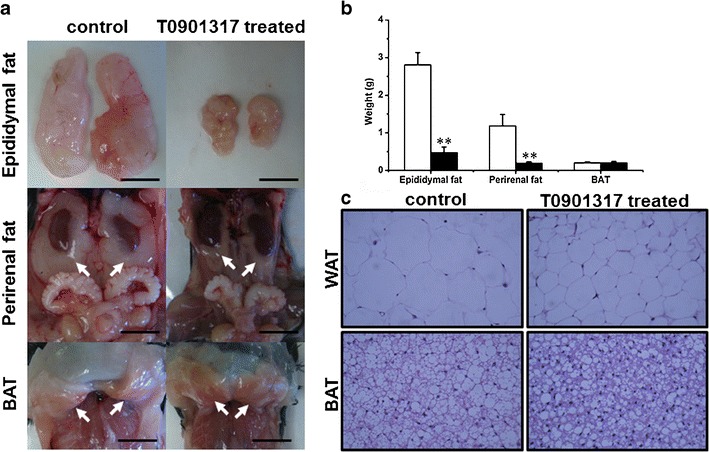
Effect of T0901317 treatment on fat accumulation in adipose tissues. a Photo images of adipose tissues. Arrows in the middle and lower panel point to perirenal WAT and interscapular BAT, respectively. (Bar length = 1 cm). b Weight of adipose tissues (white, control; black, T0901317-treated; n = 5, **P < 0.01). c Results of H&E staining on tissue sections from the epididymal WAT (×400, upper panel) and intrascapular BAT (×400, lower panel)
H&E staining was performed on both WAT and BAT, and the results are shown in Fig. 2c. It is evident that the cell volume of WAT in control animals is significantly larger than that in T0901317-treated animals. Again, no obvious difference in BAT was seen between the two animal groups.
The Effect of T0901713 Treatment on Glucose Metabolism
Insulin resistance and glucose intolerance are usually consequences of obesity. Therefore, we checked the glucose metabolism of the mice using IPGTT and ITT. In IPGTT, treated animals showed peak levels at 263 ± 35 mg/dL compared to 451 ± 32 mg/dL for control animals (Fig. 3a) 30 min after glucose injection, suggesting a low response to glucose challenge in control animals. In the profile of ITT (Fig. 3b), the glucose level of treated animals, upon insulin injection, dropped from 100% to 43.3 ± 3.7% in 60 min, but the level in control animals remained at 60.0 ± 2.9% of the initial glucose level in the same time period, suggesting that the T0901317-treated animals were more sensitive to insulin. In addition, Fig. 3c shows the insulin concentration at 2.8 ± 0.6 ng/mL in control animals, significantly higher than 0.9 ± 0.1 ng/mL in treated animals. The calculated HOMA-IR value reflecting the status of insulin resistance is 1.5 ± 0.4 for control and 0.4 ± 0.0 for T0901317-treated animals (Fig. 3d). T0901317-treated mice showed higher levels of Glut4 expression in WAT, BAT, and muscle compared to control mice (Fig. 3e). These results suggest that biweekly injections of T0901317 prevented obesity-associated insulin resistance and glucose intolerance.
Fig. 3.
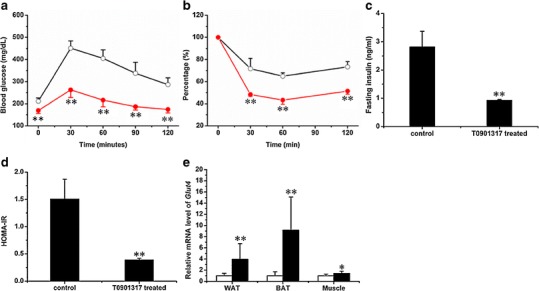
Effect of T0901317 treatment on glucose metabolism. a Profile of the intraperitoneal glucose tolerance test for control (open circle) and T0901317-treated (solid circle) animals. b Profile of the insulin tolerance test for control (open circle) and T0901317-treated (solid circle) animals. b Concentration of fasting insulin. d Homeostasis values from insulin resistance test. e Expression of Glut4 in WAT, BAT, and muscle (white, control; black, T0901317-treated; n = 5 for each group; **P < 0.01)
The Effect of T0901317 Treatment on the Pancreas
It has been hypothesized that activation of LXR is associated with pancreatic lipogenesis (17). To check the influence of T0901317 treatment on the pancreas, we weighed the pancreas of each mouse and performed the H&E and IHC staining against insulin with the tissue sections. The average pancreas weight was 0.2 ± 0.0 g for control and 0.2 ± 0.0 g for treated animals (Fig. 4a), and there was no significant difference between the control and treated groups. The islet sizes of both groups were also similar. IHC staining (Fig. 4b) showed no abnormality with the insulin levels for both groups. These results suggest that T0901317 treatment in HFD-fed animals did not induce a detectable change in pancreatic structure and insulin secretion.
Fig. 4.
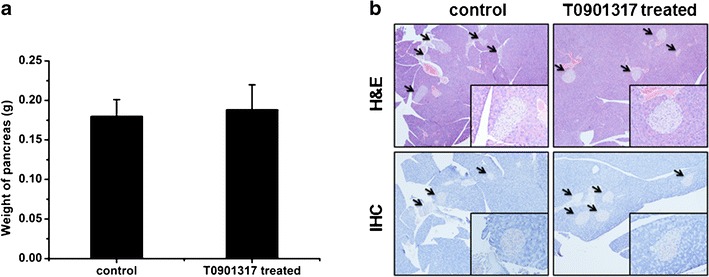
Pancreatic effect of T0901317 treatment. a Weight of pancreas (n = 5). b H&E staining of islet (upper panel) and immunohistochemistry staining against insulin in pancreas (lower panel)
Influence of T0901317 Treatment on Expression of Genes Involved in Energy Metabolism
UCP-1 is an important protein in thermogenesis and plays an important role in energy metabolism and obesity (18–20). To explore the possibility of its involvement in T0901317-mediated inhibition of obesity development, we examined the UCP-1 level in WAT and BAT using qRT-PCR, IHC staining, and Western blot. No significant difference was seen in mRNA level in BAT, but its mRNA level in WAT was approximately 89-fold higher in treated animals (Fig. 5a). IHC staining of BAT revealed a higher UCP-1 level in T0901317-treated animals (Fig. 5b), and confirmed by Western blot (Fig. 5c). The UCP-1 protein level in BAT of treated animals was approximately 1.4 ± 0.1-fold higher than that of control animals (Fig. 5d). Unfortunately, we could not detect any UCP-1 protein in WAT by either IHC or Western blot.
Fig. 5.
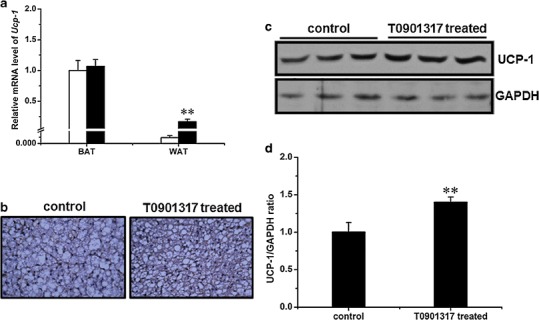
Influence of T0901317 treatment on Ucp-1 gene expression. a Expression level of Ucp-1 in interscapular BAT and epididymal WAT (white, control group; black, T0901317-treated; n = 4, **P < 0.01). b Immunohistochemistry staining against UCP-1 in interscapular BAT (×400). c Result of Western blot demonstrating UCP-1 level in interscapular BAT (upper panel, UCP-1; lower panel, GAPDH as internal reference). d Semiquantitative analysis of Western blot result (n = 3, **P < 0.01)
Pgc-1a and Pgc-1b are pivotal regulators for mitochondria biogenesis and energy metabolism (21,22). We therefore measured their expression levels in several tissues including the WAT, BAT, and muscle. Results in Fig. 6 show an elevated level of Pgc-1a (1.9 ± 0.4-fold) in BAT and Pgc-1b in WAT (2.6 ± 0.5-fold).
Fig. 6.
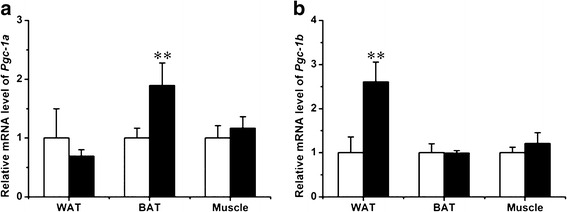
Effect of T0901317 treatment on Pgc1-a and Pgc-1b expression. a Expression level of Pgc-1a in WAT, BAT, and muscle (white, control; black, T0901317-treated; n = 4, **P < 0.01). b Expression level of Pgc-1b in WAT, BAT, and muscle. (n = 4, **P < 0.01)
T0901317 Aggravated Lipid Aggregation in the HFD-Induced Fatty Liver
The HFD-induced fatty liver has been well documented (23), and the LXR activation is known to increase liver lipogenesis (24). To investigate the fat accumulation status in the liver, we determined the liver weight and performed H&E and Oil-red O staining on liver sections. Livers from T0901713-treated animals are larger than those of control animals, with an average liver weight of 1.3 ± 0.1 and 2.0 ± 0.2 g for the control and treated animals, respectively (Fig. 7a). The liver density was 1.1 ± 0.0 g/mL for the control group and 1.0 ± 0.1 g/mL for the T0901317-treated group (Fig. 7b). More lipid droplets were evident in the liver tissue slices from the treated group, which was confirmed by Oil-red O staining (Fig. 7c). These results suggest that chronic activation of LXR by T0901317 induced significant fat accumulation in the liver. Expression of Cyp7a1, a target gene of LXR, was significantly increased (7.0 ± 0.9-fold) in treated mice (Fig. 7d). At the transcriptional level, T0901317 treatment elevated the expression of genes responsible for lipogenesis and fatty acid β oxidation, including Srebp-1c (3.5 ± 0.9-fold), Fas (7.0 ± 3.5-fold), Scd-1 (9.5 ± 2.5-fold), Acc-1 (4.3 ± 0.7-fold), Cpt1a (2.5 ± 0.2-fold), Cpt1b (2.3 ± 0.5-fold), Acadm (2.1 ± 0.2-fold), Acadl (1.7 ± 0.2-fold), Aox (3.0 ± 0.5-fold), and Ehhadh (7.9 ± 1.3-fold; Fig. 7e, f).
Fig. 7.
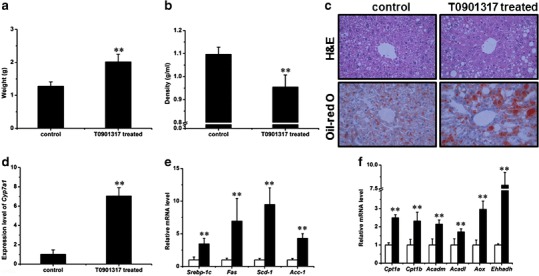
T0901317 aggregated the HFD-induced fatty liver. a Liver weight. (n = 5, **P < 0.01). b Liver density. (n = 5, **P < 0.01). c H&E (upper panel) and Oil-red O (lower panel) staining of tissue sections of the liver (×400). d Expression of Cyp7a1 in the liver (n = 4, **P < 0.01). e Expression levels of selected genes involved in lipogenesis in the liver (white, control; black, T0901317-treated; n = 4, **P < 0.01). f Expression levels of selected genes involved in fatty acid β oxidation in the liver (n = 4, **P < 0.01)
T0901317-Induced Lipid Aggregation in the Liver is Reversible
To explore the nature of T0901317-induced lipid accumulation in the liver, we treated mice with T0901317 daily for 7 days to establish lipid buildup in the liver and then withdrew T0901317 treatment for 7 days. Figure 8a shows a marked increase in lipid accumulation in the liver in T091317-treated animals compared to those of control and those animals with treatment withdrawn. The ratio of liver to body weight was significantly higher in T0901317-treated mice (8.4 ± 0.2%) than that of control mice (4.7 ± 0.3%), and reached to normal range (5.4 ± 0.7%) 7 days after T0901317 withdrawal for 7 days (Fig. 8b). Liver triglyceride levels in these mice exhibited a similar trend (Fig. 8c). Collectively, these data suggest that the T0901317 treatment-induced lipid buildup in the liver is reversible.
Fig. 8.
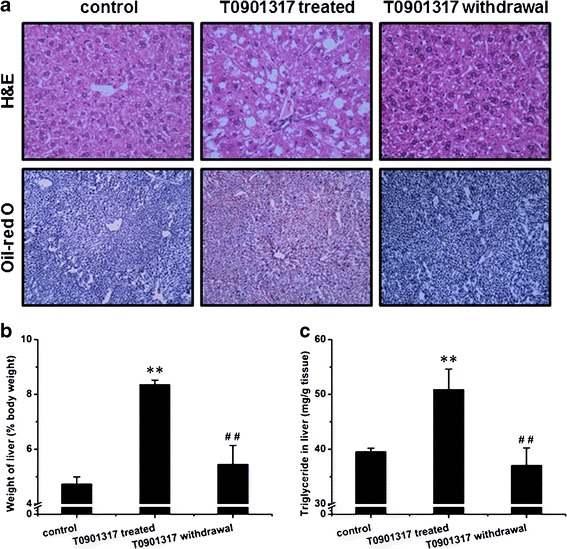
T0901317-induced lipid aggregation in the liver is reversible. a H&E staining (upper panel) and Oil-red O staining (lower panel) of tissue sections from the liver. b Ratio of liver to body weight (n = 5, **P < 0.01 vs control, ## P < 0.01 vs T0901317-treated). c Triglyceride level in the liver (n = 5, **P < 0.01 vs control, ## P < 0.01 vs T0901317-treated)
DISCUSSION
In this study, we demonstrated that twice weekly injections into mice on HFD with LXR activator, T0901317, blocked the development of obesity (Fig. 1), obesity-associated insulin resistance, and glucose intolerance (Fig. 3). The T0901317 effect was correlated with transcription elevation of not only the LXR target genes (Fig. 7d) but also genes that are directly involved in energy metabolism (Figs. 5a, 6, and 7f). Judging by the H&E and IHC staining, T0901317 treatment did not affect the pancreatic structure and function (Fig. 4). However, T0901317 treatment resulted in reversible lipid accumulation in the liver (Fig. 7c).
LXR plays important roles in the metabolism of cholesterol, glucose, and fatty acids (11). Since activation of LXR can accelerate the reverse transport of cholesterol via increasing the expression of Abca1 and Abcg1, this nuclear receptor has been recognized as a potential target for treatment of atherosclerosis (11). Additionally, LXR is critical for glucose homeostasis in vivo (25). In the liver, activation of LXR can suppress the expression of Pepck and G6p, two rate-limiting enzymes in the pathway of gluconeogenesis, thereby suppressing glucose production and decreasing blood glucose (26). In peripheral tissues including muscle and adipose tissue, activation of LXR can increase the expression of Glut4, thereby enhancing insulin sensitivity and accelerating glucose absorption into tissue cells (26,27). Based on its function in glucose metabolism, LXR has also been identified as a target for anti-diabetic drug development (28). However, the function of LXR in adipogenesis and adipolysis, which is tightly correlated with the development of obesity and diabetes, is still not clear.
Results in Fig. 1 show that T0901317 treatment prevented the development of obesity without affecting food intake (Fig. 1d), suggesting that the beneficial effect of T0901317 treatment is primarily achieved by modulating energy metabolism. The elevated expression of genes involved in fatty acid β oxidation (Cpt1a, Cpt1b, Acadm, Acadl, Aox, and Ehhadh; Fig. 7f) is in support of such conclusion and in agreement with a previous study by Hu et al. (29). T0901317 treatment elevated the expression of Pgc-1a and Pgc-1b (Fig. 6), further supporting that LXR activation upregulates the energy metabolism. Pgc1a is a co-activator that enhances the activity of many nuclear receptors and coordinates transcriptional programs important for energy metabolism and energy homeostasis (21). Pgc-1b is a recently discovered homolog of Pgc1a and is believed to control mitochondrial oxidative energy metabolism (21,22). Although additional work is needed for understanding the underlying mechanism, an increase in mRNA of UCP-1 in WAT which is for fat storage and protein levels in BAT which is for thermogenesis (Fig. 5) indicates that LXR regulates UCP-1 activity differently in WAT and BAT. The discrepancy between mRNA level and protein level of UCP-1 may be caused by posttranscriptional regulation as proposed by previous studies (30,31).
The improved glucose homeostasis in T0901317-treated mice could be attributed to the activity of T0901317 in maintaining insulin sensitivity as LXR activation did not affect the structure and function of pancreatic islets (Figs. 3 and 4). Previously, Choe and colleagues reported chronic activation of LXR caused lipotoxicity in cultured pancreatic β cells in vitro (17). In the present study, however, we did not see any noticeable change in the pancreas between animals with or without T0901317 treatment (Fig. 4). The obvious difference between these two studies is that our study is in vivo, while the previous study was conducted in vitro using isolated pancreatic β cells.
T0901317-induced lipogenesis in the liver has been shown in the db/db diabetic mice (32). Results in Fig. 7 suggest that such induction also occurs in normal animals and those fed with high fat diet. Data in Fig. 7e show that elevated lipid accumulation in the liver by T0901317 is caused by elevated expression of genes responsible for lipogenesis including Srebp-1c, Acc-1, Fas, and Scd-1. This conclusion is in agreement with the known function of LXR in regulating lipogenesis in the liver (24,33). Although expression of genes for fatty acid oxidation in the liver was also induced by LXR activation (Fig. 7f), the net result tilted toward lipid accumulation resulting in elevated lipid accumulation in the liver. However, the lipid level in the liver decreases with withdrawal of T0901317 treatment (Fig. 8), suggesting lipid aggregation is caused by LXR activation and is liver-specific and reversible. To preserve the benefits of T0901317 treatment against HFD-induced obesity and avoid its adverse effect, it is desirable to employ a schedule when a drug-free period is provided periodically.
In summary, in this study we demonstrated that T0901317-induced LXR activation protected C57BL/6 mice from HFD-induced obesity and prevented obesity-associated insulin resistance and glucose intolerance. The T0901317 effect is achieved at least in part by its activity in increasing expression of genes involved in energy metabolism. Further studies are still needed to elucidate detailed mechanisms by which the high fat diet-induced obesity and insulin resistance are prevented by activation of LXR. For example, we cannot exclude the possibility that these T0901317 effects involve not only LXR but also other nuclear receptors such as pregnane X receptor. In addition, the fact that T0901317 induces significant fat accumulation in liver suggests that T0901317 may not be a good candidate as a therapeutic agent. Developing a new, potent, and effective nuclear receptor agonist without the undesirable side effects will benefit clinical usage of the approach demonstrated in the current study.
Electronic Supplementary Materials
Below is the link to the electronic supplementary material.
(DOCX 18 kb)
Acknowledgments
We thank Ms. Ryan Fugett for proofreading this manuscript. The study was supported in part by grants from NIH (RO1EB007357 and RO1HL098295).
Conflict of Interest
The authors claim no conflict of interest.
References
- 1.Yanovski SZ, Yanovski JA. Obesity prevalence in the United States—up, down, or sideways? N Engl J Med. 2011;364(11):987–989. doi: 10.1056/NEJMp1009229. [DOI] [PMC free article] [PubMed] [Google Scholar]
- 2.Wang Y, Beydoun MA. The obesity epidemic in the United States—gender, age, socioeconomic, racial/ethnic, and geographic characteristics: a systematic review and meta-regression analysis. Epidemiol Rev. 2007;29:6–28. doi: 10.1093/epirev/mxm007. [DOI] [PubMed] [Google Scholar]
- 3.Suzuki K, Simpson KA, Minnion JS, Shillito JC, Bloom SR. The role of gut hormones and the hypothalamus in appetite regulation. Endocr J. 2010;57(5):359–372. doi: 10.1507/endocrj.K10E-077. [DOI] [PubMed] [Google Scholar]
- 4.Zimmet P, Alberti KGMM, Shaw J. Global and societal implications of the diabetes epidemic. Nature. 2001;414(6865):782–787. doi: 10.1038/414782a. [DOI] [PubMed] [Google Scholar]
- 5.Kaiyala KJ, Schwartz MW. Toward a more complete (and less controversial) understanding of energy expenditure and its role in obesity pathogenesis. Diabetes. 2011;60(1):17–23. doi: 10.2337/db10-0909. [DOI] [PMC free article] [PubMed] [Google Scholar]
- 6.Grun F, Blumberg B. Perturbed nuclear receptor signaling by environmental obesogens as emerging factors in the obesity crisis. Rev Endocr Metab Disord. 2007;8(2):161–171. doi: 10.1007/s11154-007-9049-x. [DOI] [PubMed] [Google Scholar]
- 7.Chiang JY. Nuclear receptor regulation of lipid metabolism: potential therapeutics for dyslipidemia, diabetes, and chronic heart and liver diseases. Curr Opin Investig Drugs. 2005;6(10):994–1001. [PubMed] [Google Scholar]
- 8.Liu YY, Brent GA. Thyroid hormone crosstalk with nuclear receptor signaling in metabolic regulation. Trends Endocrinol Metab. 2010;21(3):166–173. doi: 10.1016/j.tem.2009.11.004. [DOI] [PMC free article] [PubMed] [Google Scholar]
- 9.Chen Z, Vigueira PA, Chambers KT, Hall AM, Mitra MS, Qi N, et al. Insulin resistance and metabolic derangements in obese mice are ameliorated by a novel peroxisome proliferator-activated receptor gamma-sparing thiazolidinedione. J Biol Chem. 2012;287(28):23537–23548. doi: 10.1074/jbc.M112.363960. [DOI] [PMC free article] [PubMed] [Google Scholar]
- 10.Miyazaki S, Taniguchi H, Moritoh Y, Tashiro F, Yamamoto T, Yamato E, et al. Nuclear hormone retinoid X receptor (RXR) negatively regulates the glucose-stimulated insulin secretion of pancreatic ss-cells. Diabetes. 2010;59(11):2854–2861. doi: 10.2337/db09-1897. [DOI] [PMC free article] [PubMed] [Google Scholar]
- 11.Faulds MH, Zhao C, Dahlman-Wright K. Molecular biology and functional genomics of liver X receptors (LXR) in relationship to metabolic diseases. Curr Opin Pharmacol. 2010;10(6):692–697. doi: 10.1016/j.coph.2010.07.003. [DOI] [PubMed] [Google Scholar]
- 12.Edwards PA, Kast HR, Anisfeld AM. BAREing it all: the adoption of LXR and FXR and their roles in lipid homeostasis. J Lipid Res. 2002;43(1):2–12. [PubMed] [Google Scholar]
- 13.Liu Y, Yan C, Wang Y, Nakagawa Y, Nerio N, Anghel A, et al. Liver X receptor agonist T0901317 inhibition of glucocorticoid receptor expression in hepatocytes may contribute to the amelioration of diabetic syndrome in db/db mice. Endocrinology. 2006;147(11):5061–5068. doi: 10.1210/en.2006-0243. [DOI] [PubMed] [Google Scholar]
- 14.Cao GQ, Liang Y, Broderick CL, Oldham BA, Beyer TP, Schmidt RJ, et al. Antidiabetic action of a liver X receptor agonist mediated by inhibition of hepatic gluconeogenesis. J Biol Chem. 2003;278(2):1131–1136. doi: 10.1074/jbc.M210208200. [DOI] [PubMed] [Google Scholar]
- 15.Babaya N, Fujisawa T, Nojima K, Itoi-Babaya M, Yamaji K, Yamada K, et al. Direct evidence for susceptibility genes for type 2 diabetes on mouse chromosomes 11 and 14. Diabetologia. 2010;53(7):1362–1371. doi: 10.1007/s00125-010-1737-5. [DOI] [PubMed] [Google Scholar]
- 16.Hirata A, Maeda N, Hiuge A, Hibuse T, Fujita K, Okada T, et al. Blockade of mineralocorticoid receptor reverses adipocyte dysfunction and insulin resistance in obese mice. Cardiovasc Res. 2009;84(1):164–172. doi: 10.1093/cvr/cvp191. [DOI] [PubMed] [Google Scholar]
- 17.Choe SS, Choi AH, Lee JW, Kim KH, Chung JJ, Park J, et al. Chronic activation of liver X receptor induces beta-cell apoptosis through hyperactivation of lipogenesis—liver X receptor-mediated lipotoxicity in pancreatic beta-cells. Diabetes. 2007;56(6):1534–1543. doi: 10.2337/db06-1059. [DOI] [PubMed] [Google Scholar]
- 18.Porter RK. A new look at UCP 1. BBA-Bioenergetics. 2006;1757(5–6):446–448. doi: 10.1016/j.bbabio.2006.04.012. [DOI] [PubMed] [Google Scholar]
- 19.Kajimura S, Seale P, Kubota K, Lunsford E, Frangioni JV, Gygi SP, et al. Initiation of myoblast to brown fat switch by a PRDM16-C/EBP-beta transcriptional complex. Nature. 2009;460(7259):1154–1158. doi: 10.1038/nature08262. [DOI] [PMC free article] [PubMed] [Google Scholar]
- 20.Cheng Y, Meng QS, Wang CX, Li HK, Huang ZY, Chen SH, et al. Leucine deprivation decreases fat mass by stimulation of lipolysis in white adipose tissue and upregulation of uncoupling protein 1 (UCP1) in brown adipose tissue. Diabetes. 2010;59(1):17–25. doi: 10.2337/db09-0929. [DOI] [PMC free article] [PubMed] [Google Scholar]
- 21.Ventura-Clapier R, Garnier A, Veksler V. Transcriptional control of mitochondrial biogenesis: the central role of PGC-1alpha. Cardiovasc Res. 2008;79(2):208–217. doi: 10.1093/cvr/cvn098. [DOI] [PubMed] [Google Scholar]
- 22.Liang H, Ward WF. PGC-1alpha: a key regulator of energy metabolism. Adv Physiol Educ. 2006;30(4):145–151. doi: 10.1152/advan.00052.2006. [DOI] [PubMed] [Google Scholar]
- 23.Carmiel-Haggai M, Cederbaum AI, Nieto N. A high-fat diet leads to the progression of non-alcoholic fatty liver disease in obese rats. FASEB J. 2005;19(1):136–138. doi: 10.1096/fj.04-2291fje. [DOI] [PubMed] [Google Scholar]
- 24.Cha JY, Repa JJ. The liver X receptor (LXR) and hepatic lipogenesis. The carbohydrate-response element-binding protein is a target gene of LXR. J Biol Chem. 2007;282(1):743–751. doi: 10.1074/jbc.M605023200. [DOI] [PubMed] [Google Scholar]
- 25.Gerin I, Dolinsky VW, Shackman JG, Kennedy RT, Chiang SH, Burant CF, et al. LXRbeta is required for adipocyte growth, glucose homeostasis, and beta cell function. J Biol Chem. 2005;280(24):23024–23031. doi: 10.1074/jbc.M412564200. [DOI] [PubMed] [Google Scholar]
- 26.Laffitte BA, Chao LC, Li J, Walczak R, Hummasti S, Joseph SB, et al. Activation of liver X receptor improves glucose tolerance through coordinate regulation of glucose metabolism in liver and adipose tissue. Proc Natl Acad Sci U S A. 2003;100(9):5419–5424. doi: 10.1073/pnas.0830671100. [DOI] [PMC free article] [PubMed] [Google Scholar]
- 27.Dalen KT, Ulven SM, Bamberg K, Gustafsson JA, Nebb HI. Expression of the insulin-responsive glucose transporter GLUT4 in adipocytes is dependent on liver X receptor alpha. J Biol Chem. 2003;278(48):48283–48291. doi: 10.1074/jbc.M302287200. [DOI] [PubMed] [Google Scholar]
- 28.Steffensen KR, Gustafsson JA. Putative metabolic effects of the liver X receptor (LXR) Diabetes. 2004;53(Suppl 1):S36–S42. doi: 10.2337/diabetes.53.2007.S36. [DOI] [PubMed] [Google Scholar]
- 29.Hu T, Foxworthy P, Siesky A, Ficorilli JV, Gao H, Li S, et al. Hepatic peroxisomal fatty acid beta-oxidation is regulated by liver X receptor alpha. Endocrinology. 2005;146(12):5380–5387. doi: 10.1210/en.2005-0591. [DOI] [PubMed] [Google Scholar]
- 30.Harris RBS, Apolzan JW. Changes in glucose tolerance and leptin responsiveness of rats offered a choice of lard, sucrose, and chow. Am J Physiol Regul Integr. 2012;302(11):R1327–R1339. doi: 10.1152/ajpregu.00477.2011. [DOI] [PMC free article] [PubMed] [Google Scholar]
- 31.Nolan MA, Sikorski MA, McKnight GS. The role of uncoupling protein 1 in the metabolism and adiposity of RII beta-protein kinase A-deficient mice. Mol Endocrinol. 2004;18(9):2302–2311. doi: 10.1210/me.2004-0194. [DOI] [PubMed] [Google Scholar]
- 32.Chisholm JW, Hong J, Mills SA, Lawn RM. The LXR ligand T0901317 induces severe lipogenesis in the db/db diabetic mouse. J Lipid Res. 2003;44(11):2039–2048. doi: 10.1194/jlr.M300135-JLR200. [DOI] [PubMed] [Google Scholar]
- 33.Joseph SB, Laffitte BA, Patel PH, Watson MA, Matsukuma KE, Walczak R, et al. Direct and indirect mechanisms for regulation of fatty acid synthase gene expression by liver X receptors. J Biol Chem. 2002;277(13):11019–11025. doi: 10.1074/jbc.M111041200. [DOI] [PubMed] [Google Scholar]
Associated Data
This section collects any data citations, data availability statements, or supplementary materials included in this article.
Supplementary Materials
(DOCX 18 kb)


