

Abstract
Decitabine (DAC) is used for treatment of patients with myelodysplastic syndromes and acute myeloid leukemia (AML). Following cellular uptake, DAC is activated to DAC-triphosphate (TP) and incorporated into DNA. Once incorporated into the DNA, DAC-TP binds and inactivates DNA methyltransferases (DNMTs), thereby leading to hypomethylation and re-expression of epigenetically silenced tumor suppressor genes and ultimately antileukemia activity. However, direct evidence of in vivo DAC-TP occurrence in DAC-treated patients has been difficult to demonstrate due to a lack of suitable validated analytical methodology. Thus, we developed and validated a nonradioactive sensitive and specific LC-MS/MS assay for quantification of DAC-TP. The assay is linear from 50 to 1,000 nM and from 1 to 10 μM and has a lower limit of quantitation of 50 nM and a coefficient of variation for both within- and between-day precision <20%. Following DAC treatment, we detected DAC-TP in parental and DAC-resistant AML cells (in vitro) and bone marrow (BM) and spleen of normal and leukemic mice (in vivo). Downregulation of DNMTs and correlation of DAC-TP concentration with proteins involved in mechanisms of DAC resistance were also demonstrated. The clinical applicability of this method was proven by measuring DAC-TP level in BM and blood mononuclear cells from DAC-treated AML patients. Higher levels are seemingly associated with clinical response. Monitoring the DAC-TP intracellular level may serve as a novel pharmacological endpoint for designing more effective DAC-based regimens.
KEY WORDS: acute myeloid leukemia, decitabine, metabolite, quantification method, triphosphate
INTRODUCTION
Decitabine (DAC) is a deoxycytidine analog with activity in myelodysplastic syndromes (MDS) and acute myeloid leukemia (AML) (1–5). For pharmacological activity, DAC is transported into cells by human equilibrative transporters (hENTs) and phosphorylated by deoxycytidine kinase (dCK) to its active metabolite DAC-triphosphate (DAC-TP), which competes with endogenous deoxycytidine-triphosphate for DNA incorporation (6–8). At low dose, DAC-TP/DNA complex binds to and inactivates DNA methyltransferases (DNMTs) leading to hypomethylation and re-expression of epigenetically silenced tumor suppressor genes and eventually antileukemia activity (9–12). Intracellular DAC and DAC-TP are inactivated by metabolizing enzymes such as cytidine deaminase (CDA) (7).
We reported low-dose DAC pharmacokinetics in AML patients (1,13), but the DAC plasma level did not correlate with disease response. Differential activation of mechanisms for DAC resistance involving decreased nucleoside transport (via hENTs dowregulation) and/or modified metabolism (via dCK downregulation or CDA upregulation) may ultimately reduce DAC activity (7,8). Therefore, we postulated that DAC-TP quantification may correlate with DAC pharmacological activity thereby helping to understand mechanisms of therapeutic DNA hypomethylation and design more effective DAC regimens. However, a validated sensitive and specific chemical analytical method for DAC-TP has been lacking. Thus, we developed and validated a DAC-TP quantification method readily applicable in vitro and in vivo and measured intracellular levels of DAC-TP and further delineated how they are related to DNMT expression levels.
MATERIALS AND METHODS
Chemicals and Reagents
DAC was provided by the National Cancer Institute (Bethesda, MD, USA). DAC-TP was obtained from Jena Bioscience (Germany). The internal standard 2-chloroadenosine-5′-triphosphate (2-Cl-ATP), N,N-dimethylhexylamine (DMHA) and formic acid (90%) were purchased from Sigma-Aldrich (St. Louis, MO, USA). S-(4-nitrobenzyl)-6-thioinosine (NBTI) was purchased from Santa Cruz Biotechnology (Santa Cruz, CA, USA). 2-Thio-2′-deoxycytidine was obtained from Berry & Associates, Inc. (Dexter, MI, USA). Tetrahydrouridine (THU) was purchased from EMD Millipore (Billerica, MA, USA). High-performance liquid chromatography (HPLC)-grade methanol and acetonitrile were purchased from Fisher Scientific (Pittsburgh, PA, USA).
Cell Culture
MV4-11, K562, THP-1, and FDC-P1/Kitmut cells were cultured in RPMI 1640 (MV4-11, K562, and THP-1) or DMEM (FDC-P1/Kitmut) supplemented with 10% fetal bovine serum and 1% penicillin–streptomycin (Invitrogen, Carlsbad, CA, USA). The DAC-resistant MV4-11 cells was established in our laboratory (unpublished data) and maintained in the presence of 10 μM DAC. Cells were grown in a drug-free media for 3 days prior to the experiment to avoid possible drug accumulation.
Mouse and Patient Samples
C57BL/6 and FDC-P1/Kitmut cells-engrafted NOD/SCID mice were used as in vivo models according to a protocol approved by the Ohio State University Institutional Animal Care and Use Committee. All experiments were conducted in accordance with the guidelines of the Association for Assessment and Accreditation of Laboratory Animal Care. They were treated with one dose of 6.5 mg/kg DAC or vehicle via tail–vein and tissue samples were collected 4 or 24 h post-injection.
Mononuclear cells (MNCs) were obtained from bone marrow (BM) and blood (PB) of AML patients treated with 20 mg/m2/day DAC intravenously over 1 h for 10 days (1,2). Samples (5 mL of both PB and BM aspirate) were collected within 3 h after completion of DAC infusion on days 1 and 5. BM or PB MNCs were prepared by Ficoll-Hypaque (Amersham Pharmacia Biotech) gradient centrifugation at 250×g for 30 min at room temperature. The resulting cell pellets were washed with ice-cold phosphate-buffered saline, counted, and aliquoted. The resuspended cells were deproteinized with 70% methanol and quickly frozen in liquid nitrogen for DAC-TP quantification. The washing step was previously found not to change the cell viability in human leukemia cell lines and it was therefore assumed to preserve the cell integrity, including minimal leakage of ionic substance such as DAC-TP. Deproteinization inactivated metabolizing enzymes and rapid freezing help to minimize DAC-TP degradation. All experiments with these cells were performed in accordance with the protocols approved by The Ohio State University Institutional Review Board.
Quantification of DAC-TP and DAC
A liquid chromatography-tandem mass spectrometry (LC-MS/MS) quantification assay for intracellular DAC-TP was developed by adapting a method that was previously developed by our group for dNTPs/NTPs (14). A SIL-10ADvp Shimadzu HPLC system consisted of binary pump and autosampler was used for solvent and sample delivery. DAC-TP and 2-Cl-ATP were separated on BDS hypersil phenyl column (150 × 2.1 mm ID, 5 μm) coupled to an Aquasil C18 guard column (10 × 2.1 mm ID, 5 μm). The mobile phases consisted of water (5 mM DMHA, pH 7.0) and 50% ACN/50% water (5 mM DMHA in the mixture). Cell extracts were centrifuged at 1,000×g for 5 min at 4°C and the supernatants were separated and evaporated under a stream of nitrogen. The residues were reconstituted with 200 μL of mobile phase and the internal standard (final concentration 1 μM) was added. A 50 μL aliquot was then injected into the column and eluted with a gradient program at a flow rate of 0.2 mL/min. A Thermo Finnigan LCQ ion-trap mass spectrometer with an electrospray ionization source (ESI) was used for mass analysis and detection. ESI was performed in negative ion mode with selected reaction monitoring. The ESI high voltage was set at 3.2 kV and the temperature of the heated capillary was set at 250°C. The capillary voltage and tube lens offset voltage were set at −30 and 10 V, respectively. Nitrogen was used sheath gas (flow rate at 90 arbitrary units) and auxiliary gas (flow rate at 35 arbitrary units) and helium was used as collision gas. The ion transitions at m/z 467.1 > 369.1 and m/z 540.1 > 442.0 were used for DAC-TP and 2-Cl-ATP, respectively. Collision energy values were optimized to 46% for DAC-TP and 42% for 2-Cl-ATP. The detector was controlled by the Finnigan Xcalibur (version 1.2) software running on a computer with Windows NT 4.0 system. DAC level was measured by our previously reported assay (13)
The volume of the standard solution added to the blank cells lysate is 20 μL and we used 10 million (107) cells for cell lysate preparation. Thus we used the formula, concentration in nanomolar × 20 μL × 10−4 = picomole/million (106) cells, to convert the concentration from nanomolar into picomole/106 cells for both DAC and DAC-TP.
Assay Validation
The lower limit of quantification (LLOQ), linearity, within-day, between-day precision, and accuracy in cell lysate were evaluated under the appropriate conditions. Three criteria were selected to determine the LLOQ: the signal to noise ratio (S/N) of peak area of LLOQ is greater than 20, the within-day and between-day precision of LLOQ is less than 20% and the accuracy of LLOQ is between 80 and 120%. Appropriate volumes of stock standard solution were added (spiked) along with fixed volume of the internal standard in a total volume of 0.2 mL post-extraction cell lysate to prepare the calibration and quality control standards. The linearity was assessed in a concentration range from the LLOQ to at least two orders of magnitude higher. Within-day accuracy and precision were determined by 6 replicates on 1 day at three quality control (QC) levels (50, 500, and 5,000 nM). The between-day precision was determined on three different days at three QC levels. The accuracy was assessed by comparing the measured concentrations with the nominal concentrations. DAC-TP was stable in frozen biosamples up to 14 days with <15% variation and all our samples were analyzed in this stability period.
Western Blotting
Antibody to hDNMT1 was purchased from New England Biolabs (Ipswich, MA); to mDNMT1 and DNMT3a and dCK from Santa Cruz Biotechnology; to DNMT3b and CDA from Abcam (Boston, MA) and to β-actin from Sigma. The gel pictures were scanned by HPscanjet 3970 with a resolution of 300 dpi and saved as JPEG files for data presentation.
Quantitative RT-PCR
Total RNA was isolated by Trizol reagent (Invitrogen) and cDNA was then synthesized using reverse transcriptase (Invitrogen). The mRNA levels of hENT1 and hENT2 were measured by Taqman gene expression assays (Applied Biosystems, Carlsbad, CA) and normalized by the internal control 18S. The data were expressed as a percentage of the parental cell line (arbitrarily set at 100).
Statistical Analysis
Data were presented as mean ± SE of the experiments performed in triplicate and analyzed by two-tailed t test; a p value <0.05 was considered statistically significant.
RESULTS
DAC-TP Quantification Assay
A mixed water solution of DAC-TP and the internal standard 2-Cl-ATP, was infused (10 μL/min) into the mass spectrometer for tuning the instrument. DAC-TP and 2-Cl-ATP exhibited higher signals under electrospray negative ion mode than the positive ion mode with the deprotonated molecular ions [M-H]− as the major species (Fig. 1a, b). The ion transition channels at m/z 467.1 > 369.1 and m/z 540.1 > 442.0 were selected for monitoring DAC-TP and 2-Cl-ATP, respectively.
Fig. 1.
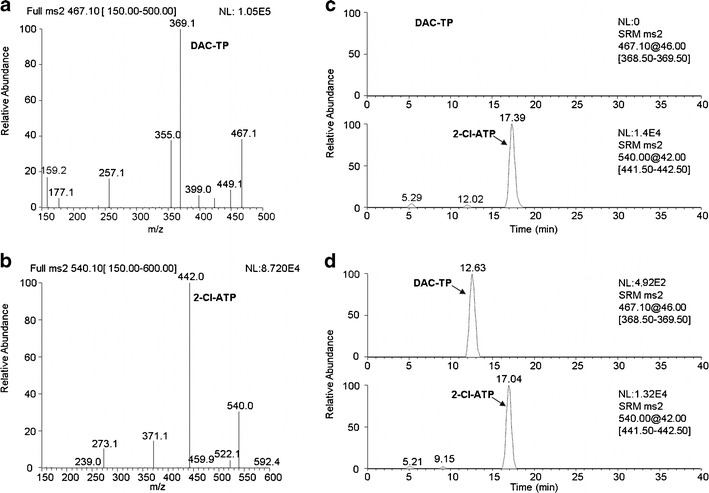
LC-MS/MS assay development and validation for DAC-TP quantification. Full-scan product spectra of the deprotonated molecular ions of a DAC-TP and b the internal standard 2-Cl-ATP used for establishing selected reaction monitoring. Representative selected reaction monitoring chromatograms for demonstration of assay specificity in cell lysate spiked with c 1 μM 2-Cl-ATP; and d 50 nM DAC-TP and 1 μM 2-Cl-ATP
The assay was validated using K562 and MV4-11 cell lysate. DAC-TP was mass and chromatographically resolved from the internal standard (Fig. 1). No endogenous interference peaks were found by comparing the chromatogram of blank cell lysate (Fig. 1c) with that spiked with 50 nM DAC-TP (Fig. 1d) supporting the assay specificity. Based on the aforementioned criteria, the LLOQ of the assay for DAC-TP was determined to be 50 nM. The calibration curves using the ratio of DAC-TP/2-Cl-ATP peak areas versus DAC-TP concentrations were found to be linear in two concentration ranges (50–1,000 and 1,000–10,000 nM) with regression coefficients r2 > 0.99 (data not shown).
The assay exhibited excellent accuracy and precision when using three QC DAC-TP concentrations (50, 500, and 5,000 nM) spiked into MV4-11 cell lysate. The accuracy values were 83.7–109.4%, as determined by calculating the percentage of measured DAC-TP relative to the respective nominal concentrations of the QC samples. The within-day coefficients of variation (CVs) were 19.9% (n = 6) at the LLOQ and 4.7–7.0% between 500 and 5,000 nM; the between-day CVs (n = 3) were 15.2% at the LLOQ and 7.5–10.2% between 500 and 5,000 nM. DAC-TP was found to be stable in frozen bio-samples up to 14 days with <15% variation.
Intracellular DAC-TP Accumulation
The intracellular DAC and DAC-TP levels in AML cells were dose-dependent. Following incubation with 2.5 μM DAC (15,16), DAC-TP reached peak levels (0.8, 1.4, and 0.5 pmol/106 cells) in 1–4 h in MV4-11, THP-1, and FDC-P1/Kitmut cells, respectively (Fig. 2a–c). DAC-TP levels then declined to only ∼20% of the peak levels after 24 h (Fig. 2a–c). DAC levels in general decreased more rapidly than DAC-TP, except in FDC-P1/Kitmut cells (Fig. 2a–c).
Fig. 2.
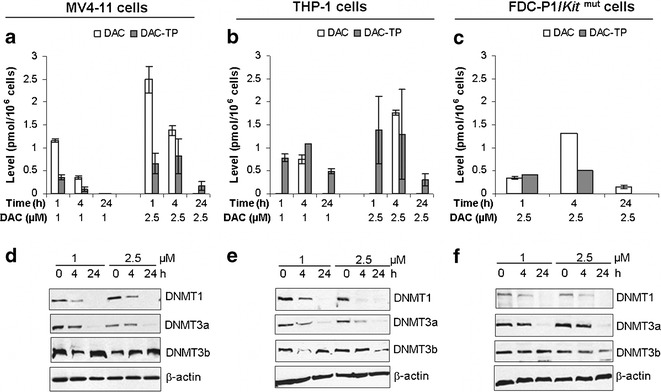
Intracellular DAC and DAC-TP levels and DNMTs downregulation in leukemia cell lines. MV4-11, THP-1, or FDC-P1/Kit mut cells were incubated with 1 or 2.5 μM of DAC for the indicated times (1, 4, 24 h) and subjected for analysis: a–c DAC and DAC-TP levels; and d–f protein expression of DNMT1, DNMT3a and DNMT3b in DAC-treated MV4-11, THP-1 and FDC-P1/Kit mut cells, respectively. Data for DAC and DAC-TP levels are presented as mean ± SE. β-actin is a loading control for immunoblotting. For 2b, it is possible that at 1 h, all detectable DAC was converted to DAC-TP but at 4 h the amount of influx DAC exceed the rate of phosphorylation by the kinase dCK, resulting in the appearance of DAC. At longer time (24 h), all detectable DAC (intracellular and extracellular) had probably been exhausted by metabolism including deamination, leading to again the disappearance of DAC. The kinetics of these processes may be cell dependent
DNA-incorporated DAC-TP is expected to trap DNMTs in large complexes thereby making them undetectable by immunoblotting. DNMT1 and DNMT3a were both sensitive to DAC-TP following DAC treatment (Fig. 2d–f). Even at DAC-TP concentrations as low as 0.1–1.3 pmol/106 cells, DNMT1 and DNMT3a protein levels decreased after 4-h DAC incubation (Fig. 2). DNMT1 were seemingly more sensitive to DAC-TP than DNMT3a (Fig. 2d–f), possibly due to the difference in the isoforms’ half-lives (DNMT1 t1/2 = 6 h (11); DNMT3a t1/2 = 8 h (17)). No significant DNMT3b downregulation was observed with these in vitro experiments (Fig. 2d–f).
Mechanisms for DAC-TP Accumulation
We next delineated the roles of nucleoside transporters (e.g., hENT1 and hENT2) and activating (e.g., dCK) and catabolizing (e.g., CDA) enzymes in determining the intracellular DAC-TP levels. We found that inhibition of hENT1 by its specific inhibitor NBTI completely depleted DAC-TP in cells (Fig. 3a). The dCK inhibitor 2-thio-2′-deoxycytidine also dramatically reduced DAC-TP accumulation by 80% in MV4-11 cells (Fig. 3a). However, the DAC-TP decay was blocked by THU-induced inhibition of CDA (Fig. 3b). These data not only established a role for hENT1, dCK and CDA in determining intracellular accumulation of DAC-TP but also suggested that the physiological time-dependent decrease in DAC-TP level is partly due to the activity of CDA (Figs. 2 and 3b).
Fig. 3.
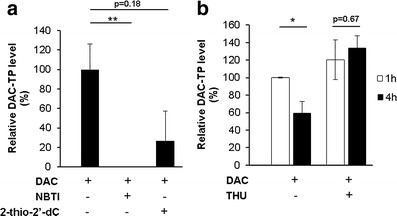
Roles of hENTs, dCK and CDA activity in the intracellular accumulation of DAC-TP. MV4-11 cells were pretreated 1 h with 10 μM NBTI, 10 μM 2-thio-2′-deoxycytidine (2-thio-2′-dC) or 100 μM THU, respectively, followed by incubation with 2.5 μM DAC for additional 1 h (and 4 h for THU-pretreatment experiment) and subjected for determination of DAC-TP level. a Inhibition of hENT1 with NBTI or dCK with 2-thio-2′-dC reduces DAC-TP accumulation in leukemia cells. **p < 0.01 when compared with DAC-only treated samples. b Inhibition of CDA with THU blocks time-dependent decrease of the intracellular DAC-TP level. Data are expressed as percentage of the DAC-TP level measured after 1 h exposure to DAC alone and presented as mean ± SE. *p < 0.05 when comparing the 4 h with the 1 h post-treatment samples. The lack of a decrease in DAC-TP following THU treatment could possibly be due to the CDA-inhibition of DAC deamination, which resulted in formation of DAC-TP from DAC, or direct inhibition of DAC-TP deamination by CDA or both
We then measured the DAC-TP level in DAC-resistant cells. DAC-resistant MV4-11 cells were established in our laboratory by stepwise exposure of the MV4-11 cells to increasing DAC concentrations over a period of 6 months (unpublished data). The cells resistance was indicated by a significant increase in the DAC IC50 when comparing with the parental cells (IC50 = 0.17 ± 0.04 μM for parental MV4-11 cells; IC50 = 86.37 ± 47.24 μM for DAC-resistant MV4-11 cells, unpublished data). We observed that the intracellular DAC-TP levels were lower in DAC-resistant MV4-11 cells than in their parental counterparts (p < 0.05, Fig. 4a). These data suggested that reduced accumulation of DAC-TP likely contributes to the development of DAC resistance. Indeed, consistent with previous studies (7,8), we showed low dCK and hENTs but not CDA expression levels in the DAC-resistant cells (Fig. 4b–d).
Fig. 4.
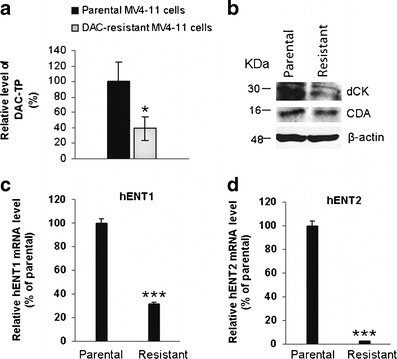
Mechanisms for the reduced DAC-TP accumulation in DAC-resistant cells. a Intracellular DAC-TP level decreased in DAC-resistant MV4-11 cells. Parental- and DAC-resistant MV4-11 cells were treated with 2.5 μM DAC for 4 h and collected for analysis. Data were normalized as the percentage of parental cells. Data are presented as mean ± SE. *p < 0.05, as compared to the parental cells. b–d Comparison of the expression levels of metabolizing enzymes and nucleoside transporters in DAC-resistant cells with their parental counterparts: b protein levels of dCK and CDA; c hENT1 mRNA; d hENT2 mRNA. β-actin is a loading control and molecular weights are indicated on the left side of the blots. Data for mRNA levels are expressed as percentage of the levels in the parental cells (set at 100%) and presented as mean ± SE of two experiment performed in triplicate. ***p < 0.001, as compared with the level in parental cells
In Vivo DAC-TP Levels
We focused on measuring DAC-TP in BM and spleen from DAC-treated mice as these two organs were the primary sites of leukemia infiltration in murine models of AML (18,19). The initial experiments were conducted in normal mouse (C57BL/6) and the DAC dose for mouse treatment was 6.5 mg/kg, which is equivalent to 20 mg/m2 used in human (1,20,21). Four hours after DAC administration, the DAC-TP level was 0.4 pmol/106 cells in BM and 142.3 pmol/g tissue in spleen. The level decreased over time but was still measurable at 24 h (Fig. 5a, b). The estimated decay rates of DAC-TP in BM and spleen, were kBM = −0.02 pmol/106 cells × h and kspleen = −1.63 pmol/g tissue × h, respectively. The observed DAC-TP reduction was likely due to DNA incorporation and the degradation by CDA. We then conducted similar experiments in FDC-P1/Kitmut cells-engrafted mice that developed AML-like disease (22). The DAC-TP levels in these leukemic mice were comparable to those of C57BL/6 mice (Fig. 5 c, d), 0.3 pmol/106 cells in BM and 199.2 pmol/g tissue in spleen at 4 h and 0.2 pmol/106 cells in BM and 165.3 pmol/g tissue in spleen at 24 h. The estimated decay rates were kBM = −0.01 pmol/106 cells × h and kspleen = −1.70 pmol/g tissue × h, respectively. The spleen DAC-TP levels were relatively stable and decreased only ∼20% from 4 to 24 h following DAC treatment (Fig. 5b, d). No significant statistical difference in DAC-TP levels was observed between normal and diseased mice. Furthermore, we showed that DAC-TP-induced DNMTs’ downregulation occurred in BM MNCs from FDC-P1/Kitmut cells-engrafted mice (Fig. 5e). Different from the in vitro experiments, not only DNMT1 and DNMT3a but also DNMT3b protein decreased in BM (Fig. 5e).
Fig. 5.
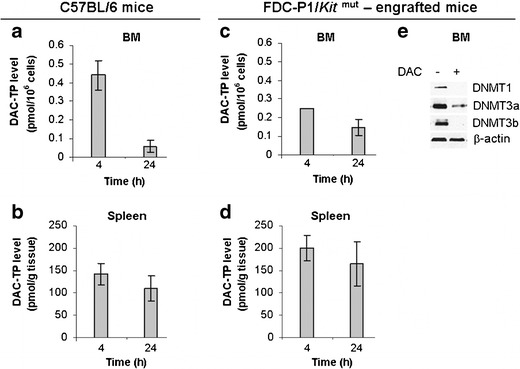
Intracellular/tissue level of DAC-TP and DNMTs downregulation in vivo. a–b C57BL/6 mice (n = 8) were treated with 6.5 mg/kg DAC i.v. bolus dose through tail vein and tissues were collected 4 and 24 h post-injection: a BM levels of DAC-TP, b Spleen levels of DAC-TP. c–e FDC-P1/Kit mut cells-engrafted mice (n = 3) were injected with an i.v. bolus dose of DAC at 6.5 mg/kg and tissues were collected for analysis: c BM DAC-TP levels; d Spleen DAC-TP levels. DAC-TP levels are presented as mean ± SE. e DAC-induced DNMTs downregulation in BM MNCs
We next proved the clinical feasibility of our method by measuring the intracellular levels of DAC-TP in BM and PB MNCs from DAC-treated AML patients. In BM samples, the mean DAC-TP levels were 0.8 ± 0.6 (day 1) and 0.9 ± 0.5 pmol/106 cells (∼day 5) in complete responsive (CR) patients; and 0.4 ± 0.3 (day 1) and 0.12 ± 0.02 pmol/106 cells (∼day 5) in non-responsive (NR) patients. In PBMC samples, the mean DAC-TP levels were 0.5 ± 0.2 (day 1) and 1.2 ± 0.4 pmol/106 cells (∼day 5) in CR patients; and 0.02 ± 0.02 (day 1) and 0.21 ± 0.04 pmol/106 cells (∼day 5) in NR patients. Our data suggested that the intracellular DAC-TP concentration is relatively steady through the treatment course. Furthermore, although a formal statistical analysis could not be performed because of the small number of patients, in this explorative study CR patients showed higher DAC-TP level than NR patients, especially on ∼day 5 of treatment (Fig. 6).
Fig. 6.
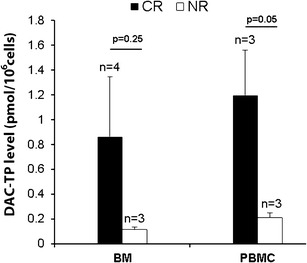
Intracellular DAC-TP levels in BM and PB MNCs (PBMC) obtained on treatment ∼day 5 from DAC-treated AML patients that either showed complete response (CR) or nonresponsiveness (NR). AML patients were treated with DAC at 20 mg/m2 daily over 1 h intravenous infusion for 10 days and samples were collected within 3 h after completion of DAC infusion on the indicated day. DAC-TP levels are presented as mean ± SE. The number (n) for each type of patient samples and the p values comparing DAC-TP level between CR and NR patients are shown on the graph
Altogether, these results showed that pharmacologically active DAC-TP concentrations (0.1–1.4 pmol/106 cells) achieved in our in vitro experiments (Fig. 2) were also reachable in vivo in treated healthy and diseased mice BM (0.4 pmol/106 cells in C57BL/6 mice; 0.3 pmol /106 cells in FDC-P1/Kitmut-engrafted mice, Fig. 5a, c) and in human BM and PBMC (Fig. 6).
DISCUSSION
DAC is a deoxycytidine analog that requires phosphorylation to its active metabolite DAC-TP after transporting into the cell. Therefore, it is critical to quantify DAC-TP in order to optimize dosing and schedule of the parent compound in leukemia patients. Previously, we have developed a nonradioactive LC-MS/MS method for quantification of dNTPs/NTPs (14). We adapted this method for quantification of the intracellular DAC-TP given that the structure and chemical characteristics of DAC-TP are similar to those of the endogenous nucleotides albeit molecular weight and mass fragmentation are different. Our method was specific for DAC-TP quantification, as no interference from endogenous molecules was demonstrated. Indeed, the major transition for the nucleotides is the neutral loss of a phosphate and such will be the same for dCTP and 13C dCTP, the latter of which may seemingly generate interference for DAC-TP assay. However, the transition of dCTP is significantly lower than that for DAC-TP (unpublished), presumably because of their structural difference. This, together with the lower abundance of 13C isotope (1%), makes the potential interference rather minimal. Additionally, the naturally abundance of dCTP is also rather low in the low picomoles per million cell region, thereby further decreasing the interference potential for DAC-TP. The assay was sensitive with an LLOQ of 50 nM, reproducible, fully validated in cell lysates and essentially met most of the established US Food and Drug Administration validation criteria (23,24).
Thus, based on these results, we were well poised to apply our validated analytical tool to the in vitro and in vivo AML models to determine whether measurable intracellular levels of DAC-TP were achievable and how they relate to DNMTs downregulation. We showed that DAC-TP was quickly converted from DAC and decreases over time in AML cells, normal and leukemic mice, consistent with metabolic elimination of the parent drug and the active metabolite. The decay of DAC species was believed to be due to the incorporation of DAC-TP into DNA and formation of drug–DNA complexes which ultimately bound DNMT proteins (Figs. 2d–f and 5e). However, DAC/DAC-TP is also a substrate for catabolizing enzymes such as CDA, which is involved in the metabolism of cytidine and deoxycytidine and analogs to uridine and deoxyuridine and their analogs, respectively (7). Therefore, we postulated that the decrease over time of the intracellular DAC-TP levels was also dependent on the CDA activity. We indeed showed that the CDA inhibitor, THU blocked the time-dependent decrease of DAC-TP level (Fig. 3b), supporting a dual mechanism of the intracellular decay of DAC-TP, incorporation into nascent DNA- and CDA-mediated metabolic degradation.
Furthermore, we showed that inhibition of hENTs or dCK dramatically reduced or depleted the intracellular level of DAC-TP in DAC-sensitive AML cells, thereby providing a direct evidence for the roles of these nucleotide transporters and kinases in the accumulation of the DAC active metabolite (Fig. 3a). Indeed, to our knowledge, we were the first to demonstrate that the DAC-TP accumulation was significantly decreased in DAC-resistant cell line (Fig. 4a) that harboring significantly downregulated hENTs and dCK expression (Fig. 4b–d; 7,8).
Having demonstrated that intracellular levels of DAC-TP are measurable, next we applied our newly developed method in vivo. We showed that DAC-TP is measurable in BM and spleen up to 24 h after systemic administration of DAC in both healthy and AML mice. Importantly, we also showed accumulation of DAC-TP in BM and PB MNCs from AML patients treated with a 10-day regimen of DAC given 20 mg/m2/day i.v. over 1 h (2). In these patients, DAC-TP levels appeared relatively stable from day 1 to ∼5. Interestingly, patients who eventually achieved CR had higher DAC-TP levels in both BM and PB MNCs (especially on ∼day 5 of treatment) than those who failed to respond to the treatment. However, the number of patients available for analysis was small and there is significant variability of DAC-TP levels across DAC-treated patients so that definitive conclusions could not be drawn (Table I). Nevertheless, these data may be utilized for early identification of those individuals who are unlikely to respond to current DAC treatment and should receive either higher doses of DAC or switch to other therapies. Recently, Jansen et al. also quantified DAC-TP using LC-MS/MS (25). Although no biological correlates with expression of DNMTs and other proteins potentially mediating mechanisms of resistance were obtained, they reported the DAC-TP levels in three MDS patients treated with DAC 15 mg/m2/q8 h × 3 days (25). They noted a trend similar to what we observed in our study; higher levels of DAC-TP were detected in the patients who had clinical response. However, like in our study, the number of patients analyzed was small. Collectively, these data support further investigation of DAC-TP levels as a potentially useful pharmacodynamic endpoint to optimize DAC-based regimens in AML and MDS in future larger clinical trials.
Table I.
Clinical Characteristics and DAC-TP Levels of DAC-Treated AML Patients
| Patient # | WHO subtype | Disease type | Karyotype | Clinical response | DAC-TP (pmol/106 cells) | DAC-TP (pmol/106 cells) | ||
|---|---|---|---|---|---|---|---|---|
| Day 1 | ∼Day 5 | Day 1 | ∼Day 5 | |||||
| BM | PBMC | |||||||
| 1 | AML with maturation | Secondary prior MDS | Complex; 46XX | CR | 2.70 | 2.30 | NA | NA |
| 2 | AML with maturation | Secondary therapy related | t(3;21)(q26;q22); 46XY | CR | 0.28 | 0.31 | 0.91 | 0.83 |
| 3 | AML without maturation | Primary | +8; 47XY | RF | 0.70 | 0.14 | 0 | 0.26 |
| 4 | AML without maturation | Primary | Complex; 46XY | CR | 0 | 0.58 | 0.13 | 1.92 |
| 5 | AML | Primary | 46XX | CR | 0.15 | 0.26 | 0.57 | 0.84 |
| 6 | AML | Secondary | Complex; 46XY | RF | 0.08 | 0.13 | 0.03 | 0.24 |
| 7 | AML with maturation | Primary | 46XY | RF | NA | 0.08 | NA | 0.13 |
WHO World Health Organization classification, AML acute myeloid leukemia, MDS myelodysplastic syndrome, CR complete response, RF refractory, NA not available
CONCLUSION
Although more extensive studies are needed for correlating DAC-TP levels with disease response and resistance to DAC, the intracellular levels of DAC-TP may serve as an early and novel pharmacoanalytical biomarker to optimizing dose/schedule and monitoring onset of resistance in individual DAC-treated AML patients.
Acknowledgments
This work was supported by grants UO1-CA76576 (KKC, GM, RBK and WB), NO1-CM-2011-00070 (MAV), SPORE-CA140158 (GM and JCB), and RO1-CA102031 (GM and KKC) from the National Cancer Institute.
Footnotes
Hongyan Wang and Ping Chen equal contributed to this paper. Moreover, Kenneth K. Chan and Guido Marcucci are senior authors with equal contribution to this study.
Contributor Information
Kenneth K. Chan, Phone: +1-614-2928294, FAX: +1-614-2927766, Email: chan.56@osu.edu
Guido Marcucci, Phone: +1-614-3662261, FAX: +1-614-2932695, Email: guido.marcucci@osumc.edu.
References
- 1.Blum W, Klisovic RB, Hackanson B, Liu Z, Liu S, Devine H, et al. Phase I study of decitabine alone or in combination with valproic acid in acute myeloid leukemia. J Clin Oncol. 2007;25(25):3884–3891. doi: 10.1200/JCO.2006.09.4169. [DOI] [PubMed] [Google Scholar]
- 2.Blum W, Garzon R, Klisovic RB, Schwind S, Walker A, Geyer S, et al. Clinical response and miR-29b predictive significance in older AML patients treated with a 10-day schedule of decitabine. Proc Natl Acad Sci USA. 2010;107(16):7473–7478. doi: 10.1073/pnas.1002650107. [DOI] [PMC free article] [PubMed] [Google Scholar]
- 3.Cashen AF, Schiller GJ, O’Donnell MR, DiPersio JF. Multicenter, phase II study of decitabine for the first-line treatment of older patients with acute myeloid leukemia. J Clin Oncol. 2010;28(4):556–561. doi: 10.1200/JCO.2009.23.9178. [DOI] [PubMed] [Google Scholar]
- 4.Lubbert M, Suciu S, Baila L, Ruter BH, Platzbecker U, Giagounidis A, et al. Low-dose decitabine versus best supportive care in elderly patients with intermediate- or high-risk myelodysplastic syndrome (MDS) ineligible for intensive chemotherapy: final results of the randomized phase III study of the European Organisation for Research and Treatment of Cancer Leukemia Group and the German MDS Study Group. J Clin Oncol. 2011;29(15):1987–1996. doi: 10.1200/JCO.2010.30.9245. [DOI] [PubMed] [Google Scholar]
- 5.Lubbert M, Ruter BH, Claus R, Schmoor C, Schmid M, Germing U, et al. A multicenter phase II trial of decitabine as first-line treatment for older patients with acute myeloid leukemia judged unfit for induction chemotherapy. Haematologica. 2012;97(3):393–401. doi: 10.3324/haematol.2011.048231. [DOI] [PMC free article] [PubMed] [Google Scholar]
- 6.Arner ES, Eriksson S. Mammalian deoxyribonucleoside kinases. Pharmacol Ther. 1995;67(2):155–186. doi: 10.1016/0163-7258(95)00015-9. [DOI] [PubMed] [Google Scholar]
- 7.Qin T, Jelinek J, Si J, Shu J, Issa JP. Mechanisms of resistance to 5-aza-2′-deoxycytidine in human cancer cell lines. Blood. 2009;113(3):659–667. doi: 10.1182/blood-2008-02-140038. [DOI] [PMC free article] [PubMed] [Google Scholar]
- 8.Qin T, Castoro R, El Ahdab S, Jelinek J, Wang X, Si J, et al. Mechanisms of resistance to decitabine in the myelodysplastic syndrome. PLoS One. 2011;6(8):e23372. doi: 10.1371/journal.pone.0023372. [DOI] [PMC free article] [PubMed] [Google Scholar]
- 9.Wu JC, Santi DV. Kinetic and catalytic mechanism of HhaI methyltransferase. J Biol Chem. 1987;262(10):4778–4786. [PubMed] [Google Scholar]
- 10.Schermelleh L, Spada F, Easwaran HP, Zolghadr K, Margot JB, Cardoso MC, et al. Trapped in action: direct visualization of DNA methyltransferase activity in living cells. Nat Methods. 2005;2(10):751–756. doi: 10.1038/nmeth794. [DOI] [PubMed] [Google Scholar]
- 11.Patel K, Dickson J, Din S, Macleod K, Jodrell D, Ramsahoye B. Targeting of 5-aza-2′-deoxycytidine residues by chromatin-associated DNMT1 induces proteasomal degradation of the free enzyme. Nucleic Acids Res. 2010;38(13):4313–4324. doi: 10.1093/nar/gkq187. [DOI] [PMC free article] [PubMed] [Google Scholar]
- 12.Whitman SP, Hackanson B, Liyanarachchi S, Liu S, Rush LJ, Maharry K, et al. DNA hypermethylation and epigenetic silencing of the tumor suppressor gene, SLC5A8, in acute myeloid leukemia with the MLL partial tandem duplication. Blood. 2008;112(5):2013–2016. doi: 10.1182/blood-2008-01-128595. [DOI] [PMC free article] [PubMed] [Google Scholar]
- 13.Liu Z, Marcucci G, Byrd JC, Grever M, Xiao J, Chan KK. Characterization of decomposition products and preclinical and low dose clinical pharmacokinetics of decitabine (5-aza-2′-deoxycytidine) by a new liquid chromatography/tandem mass spectrometry quantification method. Rapid Commun Mass Spectrom. 2006;20(7):1117–1126. doi: 10.1002/rcm.2423. [DOI] [PubMed] [Google Scholar]
- 14.Chen P, Liu Z, Liu S, Xie Z, Aimiuwu J, Pang J, et al. A LC-MS/MS method for the analysis of intracellular nucleoside triphosphate levels. Pharm Res. 2009;26(6):1504–1515. doi: 10.1007/s11095-009-9863-9. [DOI] [PMC free article] [PubMed] [Google Scholar]
- 15.Garzon R, Liu S, Fabbri M, Liu Z, Heaphy CE, Callegari E, et al. MicroRNA-29b induces global DNA hypomethylation and tumor suppressor gene reexpression in acute myeloid leukemia by targeting directly DNMT3A and 3B and indirectly DNMT1. Blood. 2009;113(25):6411–6418. doi: 10.1182/blood-2008-07-170589. [DOI] [PMC free article] [PubMed] [Google Scholar]
- 16.Liu S, Liu Z, Xie Z, Pang J, Yu J, Lehmann E, et al. Bortezomib induces DNA hypomethylation and silenced gene transcription by interfering with Sp1/NF-kappaB-dependent DNA methyltransferase activity in acute myeloid leukemia. Blood. 2008;111(4):2364–2373. doi: 10.1182/blood-2007-08-110171. [DOI] [PMC free article] [PubMed] [Google Scholar]
- 17.Sharma S, De Carvalho DD, Jeong S, Jones PA, Liang G. Nucleosomes containing methylated DNA stabilize DNA methyltransferases 3A/3B and ensure faithful epigenetic inheritance. PLoS Genet. 2011;7(2):e1001286. doi: 10.1371/journal.pgen.1001286. [DOI] [PMC free article] [PubMed] [Google Scholar]
- 18.Rawat VP, Cusan M, Deshpande A, Hiddemann W, Quintanilla-Martinez L, Humphries RK, et al. Ectopic expression of the homeobox gene Cdx2 is the transforming event in a mouse model of t(12;13)(p13;q12) acute myeloid leukemia. Proc Natl Acad Sci USA. 2004;101(3):817–822. doi: 10.1073/pnas.0305555101. [DOI] [PMC free article] [PubMed] [Google Scholar]
- 19.Carter BZ, Mak DH, Shi Y, Fidler JM, Chen R, Ling X, et al. MRx102, a triptolide derivative, has potent antileukemic activity in vitro and in a murine model of AML. Leukemia. 2012;26(3):443–450. doi: 10.1038/leu.2011.246. [DOI] [PMC free article] [PubMed] [Google Scholar]
- 20.Christman JK. 5-Azacytidine and 5-aza-2′-deoxycytidine as inhibitors of DNA methylation: mechanistic studies and their implications for cancer therapy. Oncogene. 2002;21(35):5483–5495. doi: 10.1038/sj.onc.1205699. [DOI] [PubMed] [Google Scholar]
- 21.Schrump DS, Fischette MR, Nguyen DM, Zhao M, Li X, Kunst TF, et al. Phase I study of decitabine-mediated gene expression in patients with cancers involving the lungs, esophagus, or pleura. Clin Cancer Res. 2006;12(19):5777–5785. doi: 10.1158/1078-0432.CCR-06-0669. [DOI] [PubMed] [Google Scholar]
- 22.Liu S, Wu LC, Pang J, Santhanam R, Schwind S, Wu YZ, et al. Sp1/NFkappaB/HDAC/miR-29b regulatory network in KIT-driven myeloid leukemia. Cancer Cell. 2010;17(4):333–347. doi: 10.1016/j.ccr.2010.03.008. [DOI] [PMC free article] [PubMed] [Google Scholar]
- 23.Shah VP, Midha KK, Dighe S, McGilveray IJ, Skelly JP, Yacobi A, et al. Analytical methods validation: bioavailability, bioequivalence and pharmacokinetic studies. Conference report. Eur J Drug Metab Pharmacokinet. 1991;16(4):249–255. doi: 10.1007/BF03189968. [DOI] [PubMed] [Google Scholar]
- 24.Shah VP, Midha KK, Findlay JW, Hill HM, Hulse JD, McGilveray IJ, et al. Bioanalytical method validation—a revisit with a decade of progress. Pharm Res. 2000;17(12):1551–1557. doi: 10.1023/A:1007669411738. [DOI] [PubMed] [Google Scholar]
- 25.Jansen RS, Rosing H, Wijermans PW, Keizer RJ, Schellens JH, Beijnen JH. Decitabine triphosphate levels in peripheral blood mononuclear cells from patients receiving prolonged low-dose decitabine administration: a pilot study. Cancer Chemother Pharmacol. 2012;69(6):1457–1466. doi: 10.1007/s00280-012-1850-x. [DOI] [PubMed] [Google Scholar]