

Abstract
The availability of highly sensitive immunoassays enables the detection of antidrug antibody (ADA) responses of various concentrations and affinities. The analysis of the impact of antibody status on drug pharmacokinetics (PK) is confounded by the presence of low-affinity or low-concentration antibody responses within the dataset. In a phase 2 clinical trial, a large proportion of subjects (45%) developed ADA following weekly dosing with AMG 317, a fully human monoclonal antibody therapeutic. The antibody responses displayed a wide range of relative concentrations (30 ng/mL to >13 μg/mL) and peaked at various times during the study. To evaluate the impact of immunogenicity on PK, AMG 317 concentration data were analyzed following stratification by dose group, time point, antibody status (positive or negative), and antibody level (relative concentration). With dose group as a stratifying variable, a moderate reduction in AMG 317 levels (<50%) was observed in antibody-positive subjects when compared to antibody-negative subjects, but the difference was not statistically significant in all dose groups. The most significant reduction in AMG 317 levels was revealed when antibody data was stratified by both time point and antibody level. In general, high ADA concentrations (>500 ng/mL) and later time points (week 12) were associated with significantly (up to 97%) lower trough AMG 317 concentrations. The use of quasi-quantitative antibody data and appropriate statistical methods was critical for the most comprehensive evaluation of the impact of immunogenicity on PK.
KEY WORDS: antidrug antibodies, immunogenicity, pharmacokinetics
INTRODUCTION
The administration of any large-molecule therapeutic has the potential of eliciting an unwanted immune response, culminating in the development of antidrug antibodies (ADAs). The immunogenic potential of a molecule is dependent upon a variety of factors related to the product (sequence, posttranslational modifications, and the presence of contaminants or aggregates), target patient population (immune status, genetic background, and concomitant medications), and treatment regimen (dose, route, and frequency of administration) (1–3). For monoclonal antibody (mAb) therapeutics, the goal of reducing the immunogenic risk of murine antibodies has led to advances in antibody engineering technologies that have enabled the generation of fully human molecules using transgenic mice or phage display libraries. Currently, many human mAbs are in clinical development and several are being marketed in the USA (4). Although, theoretically, these fully human therapeutics have a low risk of sequence-related immunogenicity, epitopes within the complementarity-determining regions (CDRs) and other nonsequence-related factors may still elicit an immune response to these molecules. Indeed, there are several examples of fully human mAb therapeutics that have triggered ADA development in the clinic (5–8). The clinical consequences of these unwanted immune responses are unpredictable and highly variable. The presence of ADAs may affect pharmacokinetics (PK; by enhancing or, in rare cases, decreasing clearance), safety (by inducing infusion reactions or hypersensitivity), or efficacy (by clearing the drug from circulation or neutralizing its effect on the target). Characteristics of the ADA response, including concentration, epitopes, affinity, isotype, duration, and persistence, may all influence the degree of clinical impact.
Due to the potentially significant effects of ADA development, the monitoring of clinical immunogenicity and its association with PK, safety, and efficacy is a regulatory requirement (9). Guidance documents have been published by regulatory agencies and industry leaders providing recommendations for the optimization and validation of methods for ADA detection (10–12). The immunogenicity testing strategy employed by most companies is a three-tiered approach comprised of antibody screening, confirmation, and characterization (including the determination of neutralizing capability). As mAb therapeutics are generally dosed at high concentrations, the main challenge is the ability to detect ADA in samples containing high levels of the therapeutic (drug interference). Advances in bioanalytical methods have included acid-dissociation techniques for the improvement of drug tolerance (13), highly sensitive bridging electrochemiluminescence (ECL)-based assays for the detection of low-level ADAs (14), and no-wash biosensor-based methods for the detection of low-affinity ADAs (15). These improvements have made the screening and confirmation assays capable of detecting all types of antibodies induced by drug administration. However, one criticism of this approach is that many of these responses, although detectable, have no clinical relevance because they may include transient responses of low affinity and concentration. The importance of ADA characterization assays, then, is to identify those responses that are more likely to impact the PK, safety, and efficacy.
In terms of the PK, mature antibody responses characterized by high affinity and concentration that persist through the duration of treatment are theoretically more likely to enhance drug clearance. Methods to assess the affinity and binding kinetics of antibodies using biosensor-based technology are available (16), but the determination of ADA affinity remains challenging. Subject ADA responses may be polyclonal, and therefore, only aggregate affinity of the entire response can be measured. ADA quasi-quantitation using titer- or mass-based (relative concentration) approaches has its own challenges, including the absence of a reference standard and inaccurate measurement due to drug interference (12,17). Despite these challenges, the availability of quasi-quantitative data may be critical for differentiating between low-level antibody responses that may have no clinical impact and high-level antibody responses that may clear drug and influence efficacy outcomes.
In this manuscript, ADA data from a phase 2 clinical trial of AMG 317, a fully human mAb-targeting interleukin receptor IL-4Rα, was used to evaluate the importance of ADA stratification by antibody level on the assessment of PK impact.
MATERIALS AND METHODS
Clinical Study Design and Sample Collection
In a phase 2 clinical study, asthma patients received weekly subcutaneous (s.c.) injections of placebo or AMG 317 (75, 150, or 300 mg) for 12 weeks (18). Plasma samples for the determination of AMG 317 concentration at trough were collected prior to dosing at baseline and at weeks 4, 8, 11, and 16. Serum samples for the detection of antidrug antibodies were collected prior to dosing at baseline and at weeks 4, 8, 12, and 16 (drug washout).
Anti-AMG 317 Antibody Detection Assay
Samples were analyzed for the presence of binding (neutralizing and non-neutralizing) ADA using a validated ECL-based immunoassay. Briefly, study serum samples or controls were diluted 1:20 in 300 mM acetic acid to enable antibody complex dissociation prior to analysis. Diluted acid-treated serum samples were added to a polypropylene plate containing 1 M Tris, pH 9.5 and a conjugate mixture [1 μg/mL biotin–AMG 317 and 1 μg/mL ruthenium–AMG 317 in assay diluent (1% (w/v) bovine serum albumin (BSA) in 1× phosphate-buffered saline (PBS))]. The mixture was preincubated overnight at ambient temperature on an orbital shaker and transferred to the wells of a blocked (5% (w/v) BSA in 1× PBS) and washed [wash buffer (1× PBS, 0.05% (v/v) Tween 20, 0.25 mM thimerosal)] Avidin High Bind MSD 6000 plate. Following a 2- to 3-h incubation at ambient temperature on an orbital shaker, plate wells were washed using wash buffer and a final solution of 2× MSD Read Buffer T (containing tripropylamine) was added. Voltage was applied within the MSD Sector Imager 6000 instrument. In the presence of tripropylamine, ruthenium participated in a chemiluminescent reaction, producing an ECL signal. The signal to noise (S/N) ratio was calculated by dividing each sample’s or control’s mean ECL by the negative control’s mean ECL. The net ECL was calculated by subtracting the negative control’s mean ECL from each sample’s or control’s mean ECL.
All samples that produced an S/N value above the assay cut point (95th percentile from healthy human serum S/N values) were analyzed in the absence or presence of excess AMG 317 to confirm specificity. A sample was reported as positive for ADA if the net ECL or S/N value of the drug-treated sample displayed a reduction when compared to the untreated sample. The ratio of each sample’s net ECL divided by the net ECL of the positive control was multiplied by the positive control’s concentration to calculate the relative ADA concentration.
Assay sensitivity was validated at ∼34.3 ng/mL of ADA, and drug tolerance (at 94 and 500 ng/mL of ADA) was determined to be 29 and 108 μg/mL of AMG 317, respectively.
AMG 317 Concentration Assay
The concentration of AMG 317 in plasma samples was determined using a validated enzyme-linked immunosorbent assay, as previously described (19). After pretreatment to a dilution factor of 50 with SuperBlock® T20 Buffer (Thermo Fisher Scientific/Pierce), study samples, standards, and quality controls (prepared in human K2-EDTA plasma pool) were added to microplate wells coated with human IL-4R fused to recombinant human Fc (IL-4R:Fc). The following reagents were added sequentially to the plate (with incubation and washing in between each reagent addition): biotinylated IL-4R:Fc, horseradish peroxidase polymer-conjugated streptavidin (Thermo Fisher Scientific/Pierce), and 3,3′,5,5′-tetramethybenzidine (TMB) substrate solution (BioFx). A reaction of TMB solution with the peroxide resulted in a colorimetric signal proportional to the amount of drug bound by the capture reagent. After stopping the reaction, the optical density (OD) was measured at 450 to 650 nm. A computer software mediated comparison to a standard curve analyzed on the same plate (regressed according to a logistic (auto-estimate) [four-parameter] regression model with a weighting factor of 1/Y using the Watson data reduction package version 7.0.0.01) was used to convert sample and quality control OD units to concentrations. The lower limit of quantification of the assay was 10 ng/mL.
Subject Antibody Status Classification and Data Stratification
Immune responses were classified as either preexisting (antibody positive prior to dosing, regardless of postdose antibody status) or developing (negative prior to dosing, positive postdose). Developing antibody responses were further classified as transient (negative at the last available antibody time point) or persistent (positive at the last available antibody time point). These classifications were based on the result of the qualitative ADA result (negative or positive). The denominators for antibody incidences were based on the number of subjects with available antibody samples (total incidence), baseline antibody samples (preexisting incidence), or postdose antibody samples (developing antibody incidences). For the stratification of samples according to relative antibody concentration, the result of the semiquantitative measurement (based on the comparison of the sample signal to the positive control signal) and the following categories were used: negative, ADA positive at <100 ng/mL (low), ADA positive at 100 to 500 ng/mL (medium), and ADA positive at >500 ng/mL (high). The cutoffs (100 and 500 ng/mL) for the category ranges were based on assay validation data (100 ng/mL = validated lower limit of reliable detection) and regulatory guideline (500 ng/mL = upper limit of ADA level considered more likely to be clinically meaningful (20)). To account for potential errors in sample collection, antibody sample time points were corrected based on the time difference between the first (predose) sample collection date and subsequent sample collection dates according to the following observed time limits: day 24 to 40 (week 4), day 50 to 69 (week 8), day 80 to 103 (week 12), and >day 105 (week 16). For PK samples, actual collection times were used in the analysis, and samples collected at times >10% outside the designated sample collection times were excluded. Out of 217 subjects in the dataset, 80 subjects had at least one missing AMG 317 concentration result (19 subjects at baseline, 30 subjects at week 4, 6 subjects at week 8, and 25 subjects at week 12). All available data at each time point (subject to the sampling error exclusions described above) were used in the analysis, and the number of observations for each dose group is annotated in the figures.
Statistical Analysis of the Impact of ADA on Trough AMG 317 Concentration
The dataset for the determination of the impact of antibodies on AMG 317 trough concentrations excluded placebo, baseline, and week 16 samples (due to low drug levels present at washout). The association between antibody status or relative antibody concentration (four categories of negative, low, medium, and high) and trough AMG 317 concentration was evaluated by applying an analysis of variance (ANOVA) model to each dose group at each time point. The model included antibody status or relative concentration as a fixed effect and assumed residual variance heterogeneity across different antibody statuses or concentrations. The trough AMG 317 concentration as the response variable was logarithmically transformed. The difference in AMG 317 concentration between patients of different antibody status or relative ADA concentration categories was reported as the percent reduction in the AMG 317 concentration geometric mean (relative to antibody-negative patients) and its 95% confidence interval.
The association between AMG 317 concentrations and ADA concentration for each dose group at each time point was evaluated by the Jonckheere–Terpstra (JT) trend test and by the Spearman’s correlation test. The JT test was used to evaluate whether there is a statistically significant downward trend across two antibody statuses (negative to positive) or across increasing relative antibody concentration categories for each time point and/or dose group. The Spearman’s correlation test was used to evaluate the nonlinear correlation between AMG 317 concentrations and relative antibody concentrations for each dose group at each time point. In consideration of the nonlinear relationship between AMG 317 concentration and ADA, Spearman’s correlation coefficient was used instead of Pearson’s correlation coefficient. Multiplicity in testing was not corrected, since the study is exploratory in nature and conclusions are drawn overall, i.e., not from individual tests.
Population PK Analysis of the Impact of ADA on AMG 317 Clearance
Concentration–time data from three phase 1 (N = 102) and one phase 2 (N = 192) trials (healthy subjects and asthma patients given as single or multiple weekly i.v. or s.c. injection) were pooled for population PK analysis using a nonlinear mixed-effects modeling approach. The greater frequency of PK sampling for the phase 1 studies permitted the estimation of population parameters with good precision. All pooled studies used comparable bioanalytical methods, had similar ADA incidences, and included populations (healthy and asthmatic subjects) with similar PK. A two-compartment model with quasi-steady-state approximation of target-mediated drug disposition and first-order absorption rate was used to describe the PK of the compound (21). The population PK analysis model development and evaluation were performed as described previously (19). The ADA effect on drug elimination parameters was investigated by direct testing of ADA status (e.g., negative or positive) as a covariate in the PK model. In the current work, post hoc individual PK parameter estimates were compared among subjects with different ADA levels (negative, low, medium, and high) after including inter-occasion variability (IOV) in the model, in which each occasion was defined by the ADA sample collection weeks (i.e., weeks 4, 8, 12, and 16). IOV is an additional level of random effect that allows flexibility of exploring changes in parameters across different occasions. In contrast, testing the time-dependent effect of antibody status directly on drug elimination parameters is a more definitive way of identifying whether or not ADA status is a significant source of intersubject variability.
RESULTS
Antibody Response Characteristics
In a phase 2 placebo-controlled clinical trial, AMG 317 was administered by s.c. injection once weekly for 12 weeks to asthma patients (18). Serum samples for the measurement of ADA were collected at baseline, prior to dosing every 4 weeks (weeks 4, 8, and 12) and at drug washout (week 16). A validated ECL-based immunoassay was used to analyze the samples for binding antibodies. All samples testing positive were analyzed further using a cell-based bioassay to detect neutralizing antibodies. Despite the fully human nature of AMG 317, binding and neutralizing antibodies were detected in 51% (Table I) and 8% (data not shown) of dosed subjects, respectively. Although a minority of subjects (6%) tested positive for binding antibodies at the baseline (predose) time point, most of the subjects (45%) tested positive only following drug administration. Some of these developing antibody responses were transient (22%), but most persisted until the end of the study (78%). The incidence of antibody-positive subjects was slightly higher and tended to persist longer in the lower-dose groups (75 and 150 mg) than in the highest-dose group (300 mg).
Table I.
Incidence of Binding Antibodies in the AMG 317 Phase 2 Clinical Trial
| Placebo (N = 74) | AMG 317 | All dosed cohorts (N = 218) | |||
|---|---|---|---|---|---|
| 75 mg QW (N = 72) | 150 mg QW (N = 74) | 300 mg QW (N = 72) | |||
| Total antibody incidence | 10/74 (14%) | 39/72 (54%) | 43/74 (58%) | 28/72 (39%) | 110/218 (51%) |
| Preexisting antibody incidence | 8/74 (11%) | 5/71 (7%) | 6/74 (8%) | 2/72 (3%) | 13/217 (6%) |
| Developing antibody incidence | 2/73 (3%) | 34/72 (47%) | 37/74 (50%) | 26/71 (37%) | 97/217 (45%) |
| Transient | 1/2 (50%) | 5/34 (15%) | 7/37 (19%) | 9/26 (35%) | 21/97 (22%) |
| Persistent | 1/2 (50%) | 29/34 (85%) | 30/37 (81%) | 17/26 (65%) | 76/97 (78%) |
Subject antibody responses were classified as preexisting (antibody positive prior to dosing, regardless of postdose antibody status), developing transient (negative prior to dosing, positive postdose, and negative at last available time point), or developing persistent (negative prior to dosing, positive postdose, and positive at the last available time point)
To characterize the antibody responses observed in the study, the concentration of ADA relative to the rabbit positive control was determined in samples testing positive for binding antibodies. Antibody levels detected in patient samples varied widely between patients, time points, and dose groups (30 ng/mL to ∼13 μg/mL in 75 mg, 30 ng/mL to ∼6 μg/mL in 150 mg, and 30 ng/mL to ∼1.5 μg/mL in 300 mg dose groups; Fig. 1a). Interestingly, the highest postdose median antibody level in positive subjects was observed in the lowest-dose group (75 mg) at the last sampling time point (week 16). In all dose groups, the highest postdose antibody concentrations were observed in subjects with developing persistent antibody responses, while developing transient responses were characterized by lower peak antibody levels that became undetectable by the end of the study (Fig. 1b). Subjects who tested positive at baseline (preexisting antibodies) had low levels of cross-reacting ADA at the predose time point, which in some cases matured to higher levels following dosing (Fig. 2a). In developing persistent subjects, ADA levels increased over time and reached the highest concentration at different times of the study depending on the dose (Fig. 2b). In the 75- and 150-mg dose groups, the majority of subjects had the highest observed ADA level at later time points (week 12 or 16), while in the 300-mg dose group, most of the subjects had the highest response earlier (week 4).
Fig. 1.

Concentration characteristics of the ADA response observed following weekly administration of AMG 317. a Relative ADA concentration detected in antibody-positive samples during the course of the study. A wide range of antibody concentrations was observed, with highest median and individual antibody levels detected in the lowest (75 mg) dose group at week 16. b Maximum ADA concentration in subjects classified as preexisting, developing transient, and developing persistent. The highest postdose peak ADA concentrations were detected in subjects with a persistent antibody response. Each box plot shows the distribution of ADA concentrations as lower extreme (lower whisker), first quartile (lower hinge), median (solid circle), third quartile (upper hinge), and upper extreme (upper whisker). The outliers (>1.5 times the box length) are shown as open circles. One value (>10,000 ng/mL) in the 75-mg dose group (week 16 and developing persistent) not shown
Fig. 2.
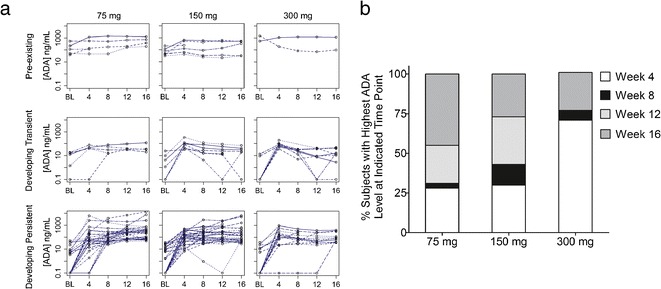
Timing characteristics of the ADA response observed following weekly administration of AMG 317. a Individual ADA concentration time profiles for preexisting and developing persistent subjects. In most subjects, antibody levels increased over time and preexisting antibody responses matured to higher level responses in some subjects following dosing. b Percentages of developing persistent subjects with the highest ADA response detected at the indicated time points. The highest concentration was observed at later time points (weeks 12 and 16) for the majority of subjects in the 75- and 150-mg dose groups and at the earliest time point (week 4) for the majority of subjects in the 300-mg dose group
Impact of Antidrug Antibodies on Trough AMG 317 Levels
Early phase studies indicated nonlinear PK for AMG 317 (19), most likely due to target-mediated elimination. The phase 2 study incorporated only sparse pharmacokinetic sampling from all subjects at baseline and prior to dosing at weeks 4, 8, 11, and 16. Therefore, AMG 317 concentration measurements were only available at drug trough and washout (Table II) and were observed to be highly variable. The binding of antibodies to drug and subsequent formation of immune complexes may further enhance the clearance of drug from circulation in antibody-positive subjects. With the high incidence of antibodies observed in the clinical study, the effect of the presence of ADA on AMG 317 PK was investigated using several statistical methods with stratification by dose group, time point, antibody status (positive or negative), and antibody level (relative concentration). Baseline, week 16, and placebo samples were excluded from the analysis dataset.
Table II.
Trough Drug Concentration Measurements in the AMG 317 Phase 2 Clinical Trial
| Plasma AMG 317 concentration in ng/mL | |||
|---|---|---|---|
| Median (mean [SD]) | |||
| 75 mg (N = 41–53) | 150 mg (N = 44–59) | 300 mg (N = 39–52) | |
| Baseline | 0 (0 [NA]) | 0 (0 [NA]) | 0 (0 [NA]) |
| Week 4 | 81.5 (234 [324]) | 833 (1,110 [1,200]) | 4,440 (5,610 [4,140]) |
| Week 8 | 51.3 (249 [453]) | 686 (1,260 [1,740]) | 4,550 (6,310 [5,580]) |
| Week 11 | 40.2 (253 [451]) | 762 (1,290 [1,530]) | 4,710 (5,500 [4,760]) |
| Week 16 | 0 (0 [NA]) | 0 (0 [NA]) | 0 (142 [817]) |
When samples were stratified only by dose group and antibody status (positive versus negative), the JT trend test indicated a statistically significant association between antibody-positive status and lower trough AMG 317 concentration in all dose groups (Fig. 3). Although trough AMG 317 measurements were highly variable in both antibody-negative and antibody-positive subjects, the trough AMG 317 concentrations in antibody-positive subjects were reduced by 28%, 52%, and 16% in the 75, 150, and 300 mg dose groups, respectively, compared to antibody-negative subjects. A mixed-effect ANOVA that took into account a two-way interaction between antibody status and time point indicated that ignoring the potential contribution of time point may potentially mask the reduction of AMG 317 levels associated with antibody status (data not shown).
Fig. 3.
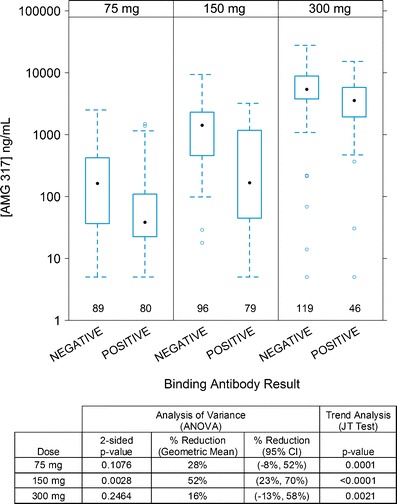
Trough AMG 317 concentrations in antibody-negative and antibody-positive samples by dose group. Each box plot shows the distribution of trough drug concentrations as lower extreme (lower whisker), first quartile (lower hinge), median (solid circle), third quartile (upper hinge), and upper extreme (upper whisker). The outliers (>1.5 times the box length) are shown as open circles
When the dataset was stratified further by time point, there was no significant association between antibody status (positive or negative) and AMG 317 concentration at week 4 in the 75- and 150-mg dose groups (Fig. 4). At later time points, however, a statistically significant strong downward trend in AMG 317 concentration was observed in antibody-positive subjects (JT test). Consistent with this result, the reduction in AMG 317 concentrations in antibody-positive subjects relative to antibody-negative subjects was moderate at week 4 in the 75- and 150-mg dose groups (35% and 53%, respectively), but became significant at later time points (weeks 8 and 12). In the 75-mg dose group, the mean AMG 317 concentration was reduced by 69% at week 8 and 67% at week 12. In the 150-mg dose group, significant reductions of 87% at week 8 and 84% at week 12 were identified. Conversely, in the highest-dose group (300 mg), an association between lower trough concentrations and antibody-positive status was only observed at earlier time points. Moderate reductions of 44% at week 4 and 53% at week 8 in drug concentrations in antibody-positive subjects relative to antibody-negative subjects were detected, with only a minimal reduction of 4% at week 12. The greatest impact of ADA on PK was found at time points when high ADA concentrations were detected for each dose group (Figs. 1 and 2). Therefore, AMG 317 concentrations in antibody-positive subjects were further stratified by four antibody levels of negative, low (<100 ng/mL of ADA), medium (100 to 500 ng/mL of ADA), or high (>500 ng/mL of ADA). The 300-mg dose group was excluded from this analysis because antibody level measurements were deemed unreliable in samples containing higher levels of drug.
Fig. 4.
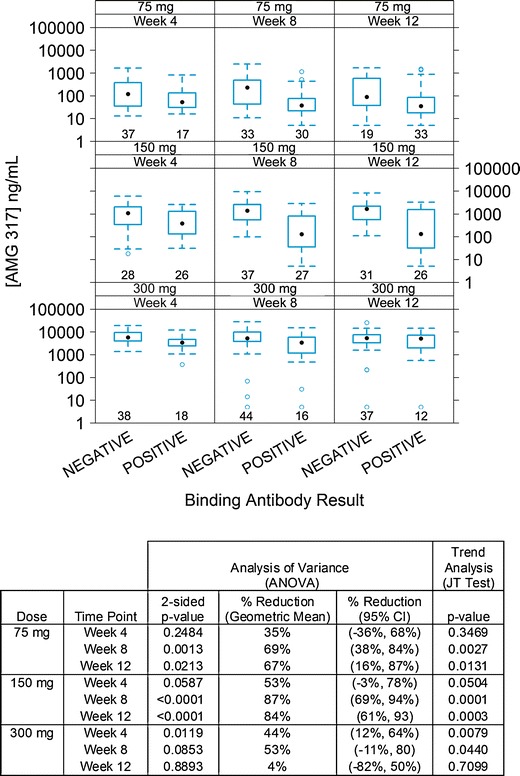
Trough AMG 317 concentrations in antibody-negative and antibody-positive samples by dose group and time point. Each box plot shows the distribution of trough drug concentrations as lower extreme (lower whisker), first quartile (lower hinge), median (solid circle), third quartile (upper hinge), and upper extreme (upper whisker). The outliers (>1.5 times the box length) are shown as open circles
Stratification of antibody-positive samples by antibody level revealed that higher ADA concentrations and later time points in general correlated with decreased trough AMG 317 concentrations (Fig. 5). The JT trend test indicated a strong downward trend in trough AMG 317 measurements across four antibody level categories for the 75- and 150-mg dose groups at weeks 8 and 12 (p value ≤ 0.01), and Spearman’s correlation analysis confirmed a statistically significant correlation between higher antibody concentration and lower AMG 317 level (p value ≤ 0.01; for details, see Fig. 5). In the 75-mg dose group, reductions were relatively moderate at week 4 regardless of antibody level, while significant reductions (>80%) in trough concentrations were identified in the medium and high antibody level categories at weeks 8 and 12. In the 150-mg dose group, samples with medium antibody level had reductions of 62% (week 4), 90% (week 8), or 72% (week 12). Samples with a high antibody level did not show a significant reduction at week 4, but AMG 317 concentrations were reduced by 93% and 97% at weeks 8 and 12, respectively. In both dose groups, there appeared to be an association between trough AMG 317 reduction and antibody concentration for weeks 8 and 12, and this association was less obvious for week 4.
Fig. 5.
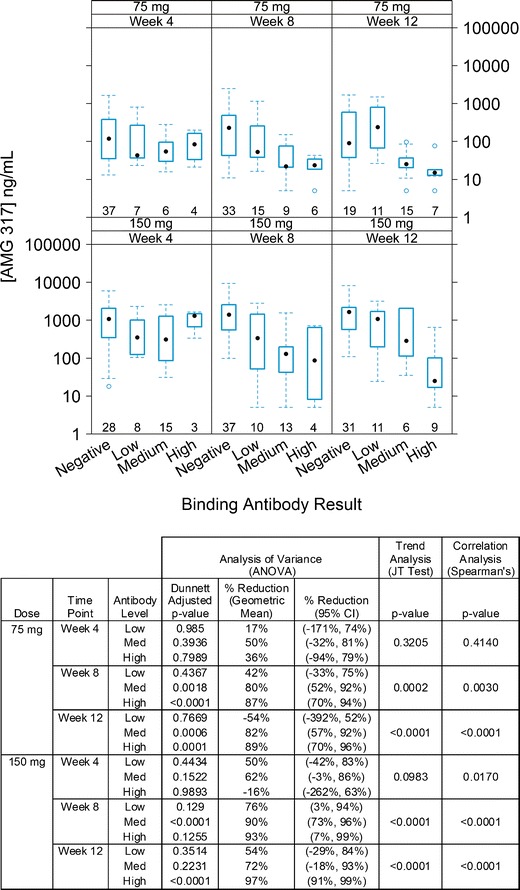
Trough AMG 317 concentrations in antibody-negative and antibody-positive (low, medium, and high antibody level) samples by dose group and time point. Each box plot shows the distribution of trough drug concentrations as lower extreme (lower whisker), first quartile (lower hinge), median (solid circle), third quartile (upper hinge), and upper extreme (upper whisker). The outliers (>1.5 times the box length) are shown as open circles
Impact of Antidrug Antibodies on AMG 317 Clearance
Frequent sampling for AMG 317 measurement was not available for this study; therefore, population PK modeling using data from phase 1 and phase 2 studies was used to assess the effect of ADA level on clearance. The population PK analysis accounted for drug elimination due to catabolism, target binding, as well as elimination due to ADA. The post hoc individual PK parameter estimates were generated after including the IOV component. In particular, distributions of the linear clearance parameter CL at four occasions (weeks 4, 8, 12, and 16) were compared for patients whose ADA responses were negative, low, medium, and high (Fig. 6). There was a slightly increasing trend from ADA-negative status to high-level ADA-positive status. The trend appeared to be more evident as the trial progressed; however, the high shrinkage in IOV estimate (∼54–90%) and small sample size of those patients with medium and high ADA responses in later occasions restricts the scope of the conclusion.
Fig. 6.
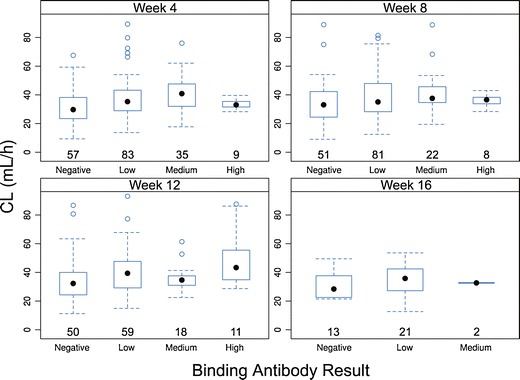
AMG 317 clearance (CL) based on population PK modeling in antibody-negative and antibody-positive (low, medium, and high antibody level) subjects by time point. Each box plot shows the distribution of CL as lower extreme (lower whisker), first quartile (lower hinge), median (solid circle), third quartile (upper hinge), and upper extreme (upper whisker). The outliers (>1.5 times the box length) are shown as open circles
DISCUSSION
Antibody responses to therapeutic proteins are diverse and progressive, and their nature is dependent on dose, frequency, and duration of administration. Robust immune responses, characterized by isotype switching and affinity maturation, require T cell-dependent activation of B cells, which leads to B cell proliferation and differentiation and subsequent production of increased levels of high affinity antibodies (3). Although the induction of an immune response against a therapeutic protein is influenced by many factors (2), the absence of nonhuman sequences is expected to reduce immunogenic risk. Despite this expectation, a large number of subjects in a phase 2 clinical trial of AMG 317 developed antibodies. An investigation into manufacturing- or stability-related factors did not identify any issues that could have contributed to the molecule’s immunogenic potential. In silico analysis of the light and heavy chain sequences suggested the presence of agretopes predicted to bind to HLA class II alleles (T. Goletz, personal communication). Therefore, it is possible that the protein sequence contributed to the observed clinical immunogenicity. Nevertheless, the reasons for this unexpectedly high rate of ADA development remain unclear.
The large dataset of antibody-positive subjects was used to explore the characteristics of the ADA response (incidence, timing, and level) and to evaluate its impact on PK. The analysis used quasi-quantitative ADA data derived from the comparison of the sample signal to the signal produced by a single concentration of the positive control shown to produce a response within the linear range of the assay (single-point calibration). Other methods for ADA quasi-quantitation include titer (the reciprocal of the dilution testing at the assay/titer cut point) and relative concentration (interpolation of sample signal from a positive control standard dose–response curve) (12). None of methods for ADA level assessment are completely quantitative due to the absence of a reference standard.
The diversity of potential antibody responses against a protein therapeutic was exemplified in this clinical trial by the high variability in the timing and concentration of ADA responses observed between subjects and dose groups. Interestingly, subjects in the high-dose group (300 mg) had the lowest ADA incidence and the lowest postdose median ADA relative concentration that tended to peak at earlier times in the study. Prior to drawing definite conclusions regarding study data, the limitations of the bioanalytical ADA method must be considered. The assay used acid dissociation to minimize drug interference and was validated to be able to detect low levels of ADA in the presence of higher levels of AMG 317 than were observed at the time of study sampling. Therefore, the inverse relationship between ADA incidence and dose level is probably not due to the interference of circulating drug with ADA detection. Instead, repeated dosing at higher levels may have induced immunological tolerance in the highest-dose group (22) or the drug’s mechanism of action may have resulted in an attenuated immune response at the highest dose. Nevertheless, drug interference may have played a role in the observations related to antibody concentration. For this reason, the 300-mg dose group was excluded from quasi-quantitative analysis to account for the possibility of inaccurate ADA level measurements due to drug interference. Similarly, neutralizing antibody-positive status was not utilized as a covariate. Due to the nature of the neutralizing antibody assay (i.e., detection of mature antibody responses with neutralizing capability) and assay sensitivity and drug tolerance limitations, the neutralizing antibody assay is already predisposed to the identification of only higher-level and high-affinity ADAs that have impacted drug clearance.
The mechanism for ADA-associated enhanced clearance is proposed to involve the formation of drug–ADA immune complexes (23). Serum and imaging analysis of infliximab nonresponders showed the formation of immune complexes within the first hour of infusion and faster clearance and higher liver and spleen uptake (24). If the immune complexes are sufficiently cross-linked, rapid clearance may be mediated by the complement pathway or Fcγ receptors. Complement opsonization and interaction with complement receptor 1 results in the deposition of immune complexes on the surface of erythrocytes, which transport the complexes to the liver and spleen for macrophage phagocytosis (25). In addition, immune complexes may be eliminated through the interaction with Fcγ receptors located on macrophages, monocytes, and neutrophils (26). Both of these elimination pathways are influenced by the extent of immune complex cross-linking. An ADA response that is robust (high in affinity/concentration and persistent) and involves multiple drug-binding sites is more likely to affect drug clearance. In this study, a stronger association between trough AMG 317 reduction and ADA concentration was detected at weeks 8 and 12 for the 75- and 150-mg dose groups, while a weaker relationship was observed at week 4. This observation may be due to affinity maturation of the ADA response at later time points, leading to the formation of more stable immune complexes and increased drug clearance.
Although the analysis of the impact of immunogenicity on PK is a regulatory expectation for marketing applications, there are currently no guidance documents on how to conduct this analysis. Utilizing only qualitative ADA results (antibody positive or negative) does not take into account the potential diversity of ADA responses in terms of concentration, affinity, or timing. Performing the impact analysis using quantitative ADA data leads to a more accurate assessment that can be included in the product label, providing physicians with information about the potential consequences of antibody development for their patients. Subject stratification prior to assessment of impact has been performed for several therapeutic molecules. In the case of adalimumab, patients with a high titer of anti-adalimumab antibodies had lower adalimumab trough concentrations and inferior clinical response (27,28). For natalizumab, subjects were stratified by type of ADA response (transient versus persistent), and persistently positive subjects were found to have decreased trough drug concentrations, impaired clinical efficacy, and a higher incidence of infusion-related adverse events (29). In this study, ADA responses were categorized into low, medium, and high groups, and the JT test was used to evaluate whether there is a statistically significant downward trend associated with increasing relative antibody concentration. An additional method that does not require separating ADA levels into distinct groups (Spearman’s correlation analysis) was also used to assess the nonlinear correlation between AMG 317 concentrations and relative antibody concentrations. Both analyses revealed that higher antibody levels present at later time points were, in general, associated with lower AMG 317 trough levels. When therapeutic proteins are administered at high concentrations as is the case for most mAbs, the impact of ADA may be more pronounced on trough levels than on other aspects of the PK profile (e.g., Cmax or AUC). A population PK approach revealed an increasing trend in empirical Bayes estimates of individual clearance from ADA-negative status to high ADA-positive status, confirming that the effect was not restricted to trough levels. Although moderate-to-large shrinkage of the individual PK parameters (∼54–90%) was observed and limited the scope of the conclusions from the perspective of individual PK parameters, the difference in post hoc individual parameters was nevertheless consistent and reflected part of the difference of the corresponding population parameter. The exploratory analysis of the effect of quantitative ADA level observed in this work is consistent with a previous investigation of qualitative ADA status (negative or positive) on AMG 317 clearance (19). The final AMG 317 PK model included ADA status as a covariate on the linear drug clearance CL and the maximum nonlinear drug elimination rate Rmax. The presence of ADA was associated with a 16% increase in linear AMG 317 clearance CL and 6% increase in Rmax. Other population PK studies have also identified ADA as a covariate on mAb clearance (30–34).
As outlined in regulatory and industry guidance (9,12,35), the assessment of correlation between ADA status and effects on PK, pharmacodynamics, and adverse events is a required component of clinical development. In this study, we demonstrate the value of quasi-quantitative data for comprehensively studying the characteristics of ADA and its impact on PK. Additional characterization data, including ADA affinity or isotype/subclass, may contribute to an even better understanding of the ADA response and its clinical relevance.
CONCLUSION
In summary, administration of a fully human mAb therapeutic (AMG 317) to subjects with moderate to severe asthma unexpectedly resulted in a very high rate of ADA development. Depending on the dose group, antibody responses varied in concentration and peak timing. The impact of ADA on PK (drug levels at trough) was influenced by ADA level, dose, and timing post-administration. Higher ADA concentrations and later time points were associated with lower trough AMG 317 measurements, and population PK modeling was used to confirm that the presence of ADA had an effect on drug clearance. The availability of ADA characterization data was critical for the most comprehensive evaluation of the impact of ADA on PK.
ACKNOWLEDGMENTS
We thank Alex Colbert for coordinating the drug concentration assays and sample analysis and Mike Hale for the statistical advice. Support for the study was provided by Amgen Inc. All authors are employees and shareholders of the study sponsor.
REFERENCES
- 1.Shankar G, Pendley C, Stein KE. A risk-based bioanalytical strategy for the assessment of antibody immune responses against biological drugs. Nat Biotechnol. 2007;25(5):555–561. doi: 10.1038/nbt1303. [DOI] [PubMed] [Google Scholar]
- 2.Schellekens H. Factors influencing the immunogenicity of therapeutic proteins. Nephrol Dial Transplant. 2005;20(Suppl 6):vi3–vi9. doi: 10.1093/ndt/gfh1092. [DOI] [PubMed] [Google Scholar]
- 3.De Groot AS, Scott DW. Immunogenicity of protein therapeutics. Trends Immunol. 2007;28(11):482–490. doi: 10.1016/j.it.2007.07.011. [DOI] [PubMed] [Google Scholar]
- 4.Nelson AL, Dhimolea E, Reichert JM. Development trends for human monoclonal antibody therapeutics. Nat Rev Drug Discov. 2010;9(10):767–774. doi: 10.1038/nrd3229. [DOI] [PubMed] [Google Scholar]
- 5.Getts DR, Getts MT, McCarthy DP, Chastain EM, Miller SD. Have we overestimated the benefit of human(ized) antibodies? MAbs. 2010;2(6):682–694. doi: 10.4161/mabs.2.6.13601. [DOI] [PMC free article] [PubMed] [Google Scholar]
- 6.Bender NK, Heilig CE, Droll B, Wohlgemuth J, Armbruster FP, Heilig B. Immunogenicity, efficacy and adverse events of adalimumab in RA patients. Rheumatol Int. 2007;27(3):269–274. doi: 10.1007/s00296-006-0183-7. [DOI] [PubMed] [Google Scholar]
- 7.Furie R, Stohl W, Ginzler EM, Becker M, Mishra N, Chatham W, et al. Biologic activity and safety of belimumab, a neutralizing anti-B-lymphocyte stimulator (BLyS) monoclonal antibody: a phase I trial in patients with systemic lupus erythematosus. Arthritis Res Ther. 2008;10(5):R109. doi: 10.1186/ar2506. [DOI] [PMC free article] [PubMed] [Google Scholar]
- 8.Kay J, Rahman MU. Golimumab: a novel human anti-TNF-alpha monoclonal antibody for the treatment of rheumatoid arthritis, ankylosing spondylitis, and psoriatic arthritis. Core Evid. 2010;4:159–170. doi: 10.2147/ce.s6000. [DOI] [PMC free article] [PubMed] [Google Scholar]
- 9.Shankar G, Shores E, Wagner C, Mire-Sluis A. Scientific and regulatory considerations on the immunogenicity of biologics. Trends Biotechnol. 2006;24(6):274–280. doi: 10.1016/j.tibtech.2006.04.001. [DOI] [PubMed] [Google Scholar]
- 10.Mire-Sluis AR, Barrett YC, Devanarayan V, Koren E, Liu H, Maia M, et al. Recommendations for the design and optimization of immunoassays used in the detection of host antibodies against biotechnology products. J Immunol Methods. 2004;289(1–2):1–16. doi: 10.1016/j.jim.2004.06.002. [DOI] [PubMed] [Google Scholar]
- 11.Koren E, Smith HW, Shores E, Shankar G, Finco-Kent D, Rup B, et al. Recommendations on risk-based strategies for detection and characterization of antibodies against biotechnology products. J Immunol Methods. 2008;333(1–2):1–9. doi: 10.1016/j.jim.2008.01.001. [DOI] [PubMed] [Google Scholar]
- 12.Shankar G, Devanarayan V, Amaravadi L, Barrett YC, Bowsher R, Finco-Kent D, et al. Recommendations for the validation of immunoassays used for detection of host antibodies against biotechnology products. J Pharm Biomed Anal. 2008;48(5):1267–1281. doi: 10.1016/j.jpba.2008.09.020. [DOI] [PubMed] [Google Scholar]
- 13.Patton A, Mullenix MC, Swanson SJ, Koren E. An acid dissociation bridging ELISA for detection of antibodies directed against therapeutic proteins in the presence of antigen. J Immunol Methods. 2005;304(1–2):189–195. doi: 10.1016/j.jim.2005.06.014. [DOI] [PubMed] [Google Scholar]
- 14.Moxness M, Tatarewicz S, Weeraratne D, Murakami N, Wullner D, Mytych D, et al. Immunogenicity testing by electrochemiluminescent detection for antibodies directed against therapeutic human monoclonal antibodies. Clin Chem. 2005;51(10):1983–1985. doi: 10.1373/clinchem.2005.053272. [DOI] [PubMed] [Google Scholar]
- 15.Lofgren JA, Dhandapani S, Pennucci JJ, Abbott CM, Mytych DT, Kaliyaperumal A, et al. Comparing ELISA and surface plasmon resonance for assessing clinical immunogenicity of panitumumab. J Immunol. 2007;178(11):7467–7472. doi: 10.4049/jimmunol.178.11.7467. [DOI] [PubMed] [Google Scholar]
- 16.Murphy M, Jason-Moller L, Bruno J. Using Biacore to measure the binding kinetics of an antibody–antigen interaction. Curr Protoc Protein Sci. 2006;Chapter 19:Unit 19 4. doi: 10.1002/0471142301.ps1914s45. [DOI] [PubMed] [Google Scholar]
- 17.Gorovits B. Antidrug antibody assay validation: industry survey results. AAPS J. 2009;11(1):133–138. doi: 10.1208/s12248-009-9091-6. [DOI] [PMC free article] [PubMed] [Google Scholar]
- 18.Corren J, Busse W, Meltzer EO, Mansfield L, Bensch G, Fahrenholz J, et al. A randomized, controlled, phase 2 study of AMG 317, an IL-4Ralpha antagonist, in patients with asthma. Am J Respir Crit Care Med. 2009;181(8):788–796. doi: 10.1164/rccm.200909-1448OC. [DOI] [PubMed] [Google Scholar]
- 19.Kakkar T, Sung C, Gibiansky L, Vu T, Narayanan A, Lin SL, et al. Population PK and IgE pharmacodynamic analysis of a fully human monoclonal antibody against IL4 receptor. Pharm Res. 2011;28(10):2530–2542. doi: 10.1007/s11095-011-0481-y. [DOI] [PubMed] [Google Scholar]
- 20.US Department of Health and Human Services, FDA (CDER, CBER). Guidance for industry—assay development for immunogenicity testing of therapeutic proteins (draft). 2009. http://www.fda.gov/downloads/Drugs/GuidanceComplianceRegulatoryInformation/Guidances/UCM192750.pdf. Accessed 1 Oct 2012.
- 21.Gibiansky L, Gibiansky E, Kakkar T, Ma P. Approximations of the target-mediated drug disposition model and identifiability of model parameters. J Pharmacokinet Pharmacodyn. 2008;35(5):573–591. doi: 10.1007/s10928-008-9102-8. [DOI] [PubMed] [Google Scholar]
- 22.Benson G, Auerswald G, Elezovic I, Lambert T, Ljung R, Morfini M, et al. Immune tolerance induction in patients with severe hemophilia with inhibitors: expert panel views and recommendations for clinical practice. Eur J Haematol. 2012;88(5):371–379. doi: 10.1111/j.1600-0609.2012.01754.x. [DOI] [PubMed] [Google Scholar]
- 23.Rehlaender BN, Cho MJ. Antibodies as carrier proteins. Pharm Res. 1998;15(11):1652–1656. doi: 10.1023/A:1011936007457. [DOI] [PubMed] [Google Scholar]
- 24.van der Laken CJ, Voskuyl AE, Roos JC, Stigtervan Walsum M, de Groot ER, Wolbink G, et al. Imaging and serum analysis of immune complex formation of radiolabelled infliximab and anti-infliximab in responders and non-responders to therapy for rheumatoid arthritis. Ann Rheum Dis. 2007;66(2):253–256. doi: 10.1136/ard.2006.057406. [DOI] [PMC free article] [PubMed] [Google Scholar]
- 25.Shmagel KV, Chereshnev VA. Molecular bases of immune complex pathology. Biochemistry (Mosc) 2009;74(5):469–479. doi: 10.1134/S0006297909050010. [DOI] [PubMed] [Google Scholar]
- 26.Tabrizi M, Bornstein GG, Suria H. Biodistribution mechanisms of therapeutic monoclonal antibodies in health and disease. AAPS J. 2010;12(1):33–43. doi: 10.1208/s12248-009-9157-5. [DOI] [PMC free article] [PubMed] [Google Scholar]
- 27.Lecluse LL, Driessen RJ, Spuls PI, de Jong EM, Stapel SO, van Doorn MB, et al. Extent and clinical consequences of antibody formation against adalimumab in patients with plaque psoriasis. Arch Dermatol. 2010;146(2):127–132. doi: 10.1001/archdermatol.2009.347. [DOI] [PubMed] [Google Scholar]
- 28.Bartelds GM, Wijbrandts CA, Nurmohamed MT, Stapel S, Lems WF, Aarden L, et al. Clinical response to adalimumab: relationship to anti-adalimumab antibodies and serum adalimumab concentrations in rheumatoid arthritis. Ann Rheum Dis. 2007;66(7):921–926. doi: 10.1136/ard.2006.065615. [DOI] [PMC free article] [PubMed] [Google Scholar]
- 29.Calabresi PA, Giovannoni G, Confavreux C, Galetta SL, Havrdova E, Hutchinson M, et al. The incidence and significance of anti-natalizumab antibodies: results from AFFIRM and SENTINEL. Neurology. 2007;69(14):1391–1403. doi: 10.1212/01.wnl.0000277457.17420.b5. [DOI] [PubMed] [Google Scholar]
- 30.Ternant D, Aubourg A, Magdelaine-Beuzelin C, Degenne D, Watier H, Picon L, et al. Infliximab pharmacokinetics in inflammatory bowel disease patients. Ther Drug Monit. 2008;30(4):523–529. doi: 10.1097/FTD.0b013e318180e300. [DOI] [PubMed] [Google Scholar]
- 31.Dirks NL, Meibohm B. Population pharmacokinetics of therapeutic monoclonal antibodies. Clin Pharmacokinet. 2010;49(10):633–659. doi: 10.2165/11535960-000000000-00000. [DOI] [PubMed] [Google Scholar]
- 32.Xu Z, Seitz K, Fasanmade A, Ford J, Williamson P, Xu W, et al. Population pharmacokinetics of infliximab in patients with ankylosing spondylitis. J Clin Pharmacol. 2008;48(6):681–695. doi: 10.1177/0091270008316886. [DOI] [PubMed] [Google Scholar]
- 33.Fasanmade AA, Adedokun OJ, Ford J, Hernandez D, Johanns J, Hu C, et al. Population pharmacokinetic analysis of infliximab in patients with ulcerative colitis. Eur J Clin Pharmacol. 2009;65(12):1211–1228. doi: 10.1007/s00228-009-0718-4. [DOI] [PMC free article] [PubMed] [Google Scholar]
- 34.Zhu Y, Hu C, Lu M, Liao S, Marini JC, Yohrling J, et al. Population pharmacokinetic modeling of ustekinumab, a human monoclonal antibody targeting IL-12/23p40, in patients with moderate to severe plaque psoriasis. J Clin Pharmacol. 2009;49(2):162–175. doi: 10.1177/0091270008329556. [DOI] [PubMed] [Google Scholar]
- 35.The common technical document for the registration of pharmaceuticals for human use. Efficacy-M4E (R1) clinical overview and clinical summary of module 2. Module 5: clinical study reports. International Conference on Harmonisation of Technical Requirements for Registration of Pharmaceuticals for Human Use; 2002.