

Abstract
The goal of the study was to develop an effective screening strategy to select new agents for brain tumor chemotherapy from a series of low molecular weight anticancer agents [ON123x] by the combined use of in silico, in vitro cytotoxicity, and in vitro ADME profiling studies. The results of these studies were cast into a pipeline of tier 1 and tier 2 procedures that resulted in the identification of ON123300 as the lead compound. Of the 154 ON123xx compounds, 13 met tier 1 screening criteria based on physicochemical properties [i.e., MW < 450 Da, predicted log P between 2 and 3.5] and in vitro glioma cell cytotoxicity [i.e., IC50 < 10 μM] and were further tested in tier 2 assays. The tier 2 profiling studies consisted of metabolic stability, MDCK-MDR1 cell permeability and plasma and brain protein binding that were combined to globally assess whether favorable pharmacokinetic properties and brain penetration could be achieved in vivo. In vivo cassette dosing studies were conducted in mice for 12 compounds that permitted examination of in vitro/in vivo relationships that confirmed the suitability of the in vitro assays. A parameter derived from the in vitro assays accurately predicted the extent of drug accumulation in the brain based on the area under the drug concentration–time curve in brain measured in the cassette dosing study (r2 = 0.920). Overall, the current studies demonstrated the value of an integrated pharmacokinetic-driven approach to identify potentially efficacious agents for brain tumor chemotherapy.
Electronic supplementary material
The online version of this article (doi:10.1208/s12248-012-9428-4) contains supplementary material, which is available to authorized users.
KEY WORDS: brain tumor, CNS, drug development, pharmacokinetics, preclinical
INTRODUCTION
Nearly 20,000 new primary brain tumors, many classified as grade IV glioblastoma multiforme (GBM), and about 200,000 metastatic brain tumor cases are reported each year in the U.S.A. (1). The overall survival of these patients is dismal and the majority of survivors suffer disabling toxicities from the aggressive treatment regimens of surgery, radiation, and chemotherapy. The discovery and development of new medicines to cure brain tumors poses a number of hurdles not the least of which is to discover compounds that are both efficacious and sufficiently penetrate the blood–brain barrier (BBB). It is well-known that in addition to the anatomic features of the BBB that limit drug access, active transporters located on the BBB act as drug efflux pumps also contribute to limited brain access (2,3). Measurement of the unbound drug fractions in plasma and target tissues is becoming part of the standard drug discovery procedures since in addition to membrane permeability limitations that may retard drug access to brain tumors, high plasma protein binding and low target tissue binding of drugs can also limit tissue distribution and the concentration of pharmacologically active free drug. All drug discovery programs interested to identify new compounds for brain diseases employ different methods to assess brain delivery including in silico QSAR models (4–6), in vitro assays and various cell models (7,8), and finally animal models. The wealth of experiences gained especially during the last decade has led to significant advances in our understanding of CNS penetration and distribution, yet there is no single approach that may be considered universal.
The ON123 series was derived from an anticancer drug discovery partnership between academia and Onconova Therapeutics Inc. which is focused on the discovery of low molecular weight inhibitors of protein kinases. These intracellular enzymes are involved in the regulation of a large variety of biochemical pathways that are often overexpressed and mutated in cancers. Rational design and development of such molecularly targeted agents is a burgeoning endeavor based on their improved toxicity profiles compared to traditional chemotherapy, and their ability to dissect oncogenic pathways which facilitate the design of more rational combination regimens. In this study, we sequentially applied a combination of in silico and in vitro absorption, distribution, metabolism, and excretion (ADME) screening assays to the ON123 series of compounds that proved to be an accurate approach to predict in vivo brain exposure. One compound, ON123300, selected from the approach exhibited favorable cytotoxicity and brain penetration.
MATERIALS AND METHODS
Materials
All ON123 compounds were synthesized in the lab of Dr. R. Reddy and can be described as 2-arylamino-6-substituted-8-alkyl-7-oxo-7,8-dihydro-pyrido[2,3-d]pyrimidine derivatives (Fig. 1). All test compounds had a purity of at least 95%.
Fig. 1.
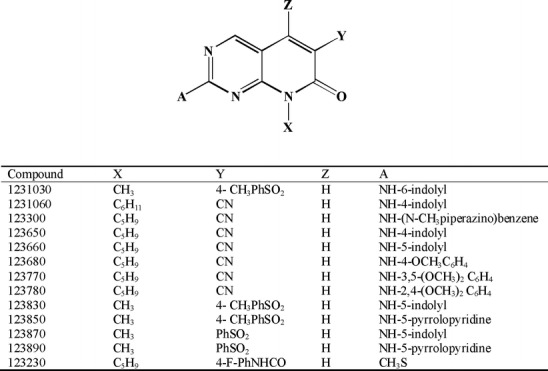
Chemical structures of 13 ON123 compounds used in the tier 2 screens
U87MG human glioma cells were purchased from the American Type Culture Collection, cultured in Dulbecco’s modified Eagle’s medium (DMEM; Mediatech Inc.) supplemented with 10% standard fetal bovine serum (Invitrogen), 100 U/mL penicillin, and 100 μg/mL streptomycin and maintained in a humidified atmosphere of 5% CO2 in air at 37°C.
MDCK-MDR1 cells were obtained from NIH (Bethesda, MD) and maintained in DMEM with 10% standard fetal bovine serum, 100 U/mL penicillin, 100 μg/mL streptomycin, and 80 ng/mL colchicine. For transport experiments, cells with passage numbers of 24–33 were seeded at a density of 60,000 cells/cm2 on Transwell plates (Costar, pore size 0.4 μm; diameter 6.5 mm; insert growth area 0.33 cm2, Pittston, PA).
Mouse pooled liver microsomes male (CD-1), 20 mg/mL, and HLM (human liver microsomes) pooled male donors, 20 mg/mL, were purchased from BD Gentest (Woburn, MA).
β-Nicotinamide adenine dinucleotide phosphate (β-NADPH) was purchased from Sigma-Aldrich Co., (St. Louis, MO). All other chemicals were reagent grade and obtained from Sigma-Aldrich Co.
In Silico Prediction
The ADMET PredictorTM (V5.0, Simulations Plus, Inc., Lancaster, CA) program was used to predict the log P (octanol–water partition coefficient) and ADMET Risk (Table Ι), derived from a set of predicted physicochemical properties, for 154 compounds in the ON123 series based on the 2D chemical structures. Compounds with a molecular weight less than or equal to 450, log P values between 2 and 3.5, and an ADMET risk score of less than 1 were selected for in vitro cytotoxicity.
Table Ι.
In Silico Tier 1 Screening Parameters Applied to 154 ON123 Compounds
| Descriptors | Physicochemical properties | Criteria |
|---|---|---|
| MWt | Molecular weight [g/mol] | <450 |
| Log P | Lipophilicity | 2< and <3.5 |
| Peff | Permeability | >0.2219 |
| pH | Acidity at saturation point | >3.5803 |
| HBDch | Hydrogen bond donors | <1.4291 |
| T_PSA | Polar suface area | <230.4 |
| ABSQ | Polarity | <5.15 |
| FormalQ | Formal electric charge | =0 |
Of the 154 compounds 13 compounds met acceptable criteria of in silico physicochemical properties combined with IC50 values of <10 μM in U87 glioma cells
Cytotoxicity Assay
The cytotoxicity of 56 compounds in U87 glioma cells was evaluated by a colorimetric SRB–based assay (9). Cells were seeded into 96-well culture plates at a density of 2 × 10³ cells/well in 100 μL of culture medium. The cells were then treated with vehicle control, 1- and 10-μM concentrations of the selected ON123 compounds for 72 h. At the end of the treatment, cells were fixed with 10% (v/v) TCA and stained with 0.4% SRB. The optical densities were measured with a SpectraMax M2 microplate reader (Molecular Devices, Downingtown, PA) at a wavelength of 570 nm and converted to the percentage of viable cells.
In Vitro ADME Profiling
Metabolic Stability
The oxidative metabolism of ON123 compounds was evaluated in both mouse and human NADPH-fortified liver microsomes; a common screening assay in drug discovery that represents the most likely metabolic reactions (10,11). An incubation mixture of 3 mL was prepared in a 100 mM sodium phosphate buffer (pH 7.4) containing 1-μM test compound, 1 mg/mL liver microsomal protein, and 6.7 mM magnesium chloride. The final incubation solution contained 0.01% DMSO. After a 10-min preincubation at 37°C, the reaction was initiated by adding NADPH followed by the collection of aliquots of the incubation medium taken at 0, 5, 10, 15, 20, and 30 min, and placed in three volumes of ice-cold acetonitrile (containing an internal standard, IS) to terminate the reaction. The samples were vortexed and centrifuged at 14,000×g for 5 min to collect the supernatant for sample analysis by LC/MS/MS as described in the bioanalysis section below. The turnover rate constant (k) in liver microsomes was determined by nonlinear regression of the percentage of the compound remaining (y) vs. time (t) curve using the equation of  , where y0 is percentage of the compound remaining at time zero estimated from the equation. The microsomal stability half-life (t1/2) was calculated using the equation
  .
.
MDCK-MDR1 Cell Permeability
For in vitro BBB permeability, MDCK-MDR1 cells (passage number 21–30) were seeded onto 0.33-cm2 polycarbonate filters at a density of 60,000 cells/cm2 and maintained in culture as previously described (7,8). Confluent MDCK-MDR1 monolayers expressing P-glycoprotein (P-gp) were obtained 3–4 days postseeding and their integrity assessed by measurement of the transepithelial electrical resistance (TEER, ohm square centimeter) with a volt-ohm meter (Millicell-ERS, Millipore Corporation, Billerica, MA). After subtraction of the background TEER (i.e., the resistance exhibited by the filter alone), only MDCK-MDR1 cell monolayers that exhibited a TEER > 1,000 Ω cm2 throughout [measured before and after the study] the experiments were used.
Drug transport across the cell monolayers was measured in both apical to basolateral (A–B) and basolateral to apical (B–A) directions. Experiments were performed in HBSS (Hank’s balanced salt solution containing millimolar Hepes buffer, pH ∼ 7.4) at 37°C using monolayers that were preincubated for 30 min with pre-warmed HBSS. At the start of the experiment, fresh HBSS was added to the receiver compartments and the compounds were independently added to the donor compartments at an initial concentration of 10 μM (diluted from 10 mM DMSO stock to a final DMSO concentration of 0.1%), and then incubated at 37°C for 90 min after which samples were collected from both the receiver and donor compartments. Drug concentrations were determined by LC/MS/MS as described in the bioanalysis section below.
The apparent permeability, Papp (centimeter per second) was calculated as:  , where dQ/dt is the transport rate of the compound (moles per second), A is the area of the cell monolayers (centimeter square) and C0 is the initial donor concentration (moles per liter).
Plasma Protein and Brain Tissue Binding
The binding of compounds to mouse plasma and brain was determined by a previously described equilibrium dialysis method (12–14). Briefly, untreated plasma or brain homogenate (4× diluted with PBS) was fortified with the test compound to yield a final concentration of 10 μM and then placed in a 96-well equilibrium dialysis block system (Model HTB96b, HTDialysis LLC, Gales Ferry, CT) fitted with a dialysis membrane (MWCO 12-14K, HTDialysis LLC) and incubated at 37°C while being rotated for 6 h. Post-dialysis plasma and buffer volumes were measured and then samples analyzed for drug concentrations by LC/MS/MS as described in the bioanalysis section below. The fraction of unbound drug was calculated as follows;
 |
where DTe and DF represent the total and unbound plasma or brain homogenate concentrations at equilibrium, respectively, and Vi and Ve represent the initial and equilibrium plasma or brain homogenate volumes, respectively.
In Vivo Cassette Dosing Study
Adult male ICR mice (25–30 g) were supplied by Taconic Farms (Germantown, NY, USA) and maintained in the American Association for the Accreditation of Laboratory Animal Care–accredited University Laboratory Animal Resources of Mount Sinai School of Medicine. All animal studies were approved by the Institutional Animal Care and Use Committee at Mount Sinai School of Medicine.
A cassette dosing study was conducted to evaluate the in vivo pharmacokinetics of 12 compounds that underwent in vitro analyses. Compounds were dissolved in a mixture of NMP/PEG300/water at a volume ratio of 1:4:5, respectively. Each compound was administered at a dose of approximately 2.5 mg/kg as an intravenous (IV) bolus injection through a lateral tail vein in a total injection volume of 5 mL/kg. At each predetermined sampling time (0.083, 0.25, 0.5, 1, 2, 4, 6 h), groups of mice (three mice for each time point) were briefly anesthetized with isoflurane, and terminal blood samples were collected through the inferior vena cava, followed by rapid extraction of normal brain. Plasma and normal brain samples were stored at −80°C until analyzed by LC/MS/MS.
Bioanalysis of ON123 Compounds
Sample preparation was adapted to each of the different sample media that consisted of donor–receiver compartments for the MDCK-MDR1 assays, bound-free compound compartments for equilibrium dialysis, and plasma and brain homogenate for the mouse PK studies. In each case, to 10 μL samples, 40 μL of cold acetonitrile was used to precipitate proteins followed by centrifugation at 15,000 rpm.
All samples were analyzed by LC/MS/MS using the multiple reaction monitoring mode specific to each analyte and the internal standards. The LC/MS/MS system consisted of an online degasser (DGU-20A3, Shimadzu, Kyoto, Japan), two pumps (LC-20 AD, Shimadzu), a column oven (CTO-20 AC, Shimadzu), and autosampler (SIL-20ACHT, Shimadzu), a system controller (CBM-20A, Shimadzu) and a hybrid quadrupole linear ion trap mass spectrometer (QTrap 5500, Applied Biosystems, Foster City, CA) with an ESI source. Chromatographic separation was achieved with a guard cartridge (C18, 4.0 × 2.0 mm, Phenomenex, Torrance, CA, USA) and analytical column (Luna C18, 3-μM particle size, 50 × 2.0 mm, Phenomenex, Torrance, CA, USA) using a gradient solvent system that consisted of mobile phase A, 0.5 mM ammonium formate (0.1% formic acid, v/v), and B, acetonitrile that was specified according to three gradient programs as summarized in Table SΙ.
Mass spectrometer conditions were optimized for each compound with some detected in positive ionization mode and others in negative ionization mode. The transitions monitored are shown in Table SΙI. Both the chromatrographic system and the mass spectrometer were controlled by Analyst software version 1.5. (QTrap 5500, Applied Biosystems). Quantification was carried out using standard calibration curves and quality control samples prepared with blank matrix spiked with each ON123 compound. The analytical methods were specific and sensitive with a lower limit of quantification of 1 ng/mL. The intraday and interday variability was less than 15% in all matrixes. The average run time was about 5 min for each sample.
Data Analysis
The hepatic intrinsic clearances (CLh.int) of ON123 compounds were estimated from human liver microsome data using the method described by Obach et al. (15) and Iwatsubo et al. (16). Assuming linear kinetics and similar unbound intrinsic clearance in vitro and in vivo, the CLh.int was calculated based on the disappearance of the parent drug in liver microsome as follows:
 |
where k is the turnover rate constant from the incubation reactions as described above, and Cprotein is the microsomal protein concentration. The liver weight relative to body weight in human is 21 g/kg. Assuming the well-stirred model of hepatic clearance, similar protein binding in microsomes and blood, and rapid equilibrium between blood and the liver, the hepatic blood clearance (CLh,blood) was estimated as follows:
 |
where Qh is the hepatic blood flow with a value equal to 90 and 21 mL/min/kg for the mouse and human, respectively .
Noncompartmental analysis was performed using WinNonlin™ Phoenix software to estimate the pharmacokinetic parameters from the cassette dosing study in mice. The calculated parameters were area under the concentration-time curve (AUC), systemic clearance (CL), the apparent volume of distribution at steady-state (Vdss) and the terminal elimination half-life (t1/2). All AUC calculations were based on the area to the last observable concentration (AUC(0_t)) using the linear trapezoidal method. The normal brain partition coefficient was calculated as the ratio of brain AUC (AUCb) over the corresponding plasma AUC (AUCp).
RESULTS
Tier 1 Screening
The goal of tier 1 screening was to select from the 154 compounds in the ON123 series the compounds with the most favorable physicochemical properties and in vitro cytotoxicity data that would then undergo in vitro tier 2 screening. Physicochemical properties were predicted from QSAR models available in the ADMET program that predicted log P values as well as a hybrid parameter referred to as the “ADMET_Risk” (lipophicity > −1.1102, permeability > 0.2219, acidity at saturation point > 3.5803, hydrogen bond donors < 1.4291, polar surface area < 230.4, polarity < 5.15 and permanent charge = 0 ) that is similar to the well-known Lipinski “Rule of Five” used to predict the likelihood of poor oral absorption (4–6). The ADMET_Risk rules were employed as an indication of suitable drug absorption by oral administration that would be the likely and preferred route for the ON123 series, and further as a means to indicate BBB penetration (i.e., fewer H-bond donors lower polar surface area). To assess whether the compounds would cross the BBB by passive diffusion, we choose compounds that had MWt ≤ 450 g/mol, and 2.0 < log P < 3.5; criteria that has been previously used (17,18). After applying these criteria and the ADMET_Risk rules (Table Ι) to the 154 ON123 compounds, 56 compounds complied with these rules and underwent in vitro cytotoxicity testing using U87 glioma cells, a well-known human model for GBM (19–21). Thirteen of these 56 compounds were selected for the tier 2 screening based on favorable cytotoxicity; defined as compounds that inhibited more than 50% of cell proliferation at ≤ 10 μM.
Tier 2 Screening
The goal of tier 2 screening was to establish an integrated approach to in vitro ADME profiling based on three key attributes; favorable BBB penetration [MDCK-MDR1 assay] and brain distribution [unbound drug fractions in plasma and brain] and system clearance [liver microsomal assay]. The assays employed have been used previously as tools to screen drug candidates (7,8,12–16); however how they were combined and validated with in vivo studies has not explicitly been done previously.
The in vitro liver human microsomal half-life values for the 13 compounds ranged 6.7-fold with a high value of 48.9 min for ON123230. The corresponding predicted clearances (Table ΙΙ) of the 13 compounds ranged between medium (seven compounds) and high (six compounds) clearances based on the following classifications; low-clearance category: CL < 6.3 mL/min/kg, medium-clearance category: 6.3 mL/min/kg ≤ CL ≤ 14.7 mL/min/kg, high-clearance category: CL > 14.7 mL/min/kg (10).
Table ΙΙ.
Tier 2 Screening Parameters for 13 ON123 Compounds That Passed Tier 1 Screening Criteria
| Compound ID | Human Liver Microsomal t 1/2(min) | Predicted CL (mL/min/kg) | P app (×10−6 cm/s) | Efflux ratio | F unbond (%) | F up/F ub | ||
|---|---|---|---|---|---|---|---|---|
| A–B | B–A | Plasma | Brain | |||||
| ON1231030 | 15.5 | 14.0 | 0.90 | 1.81 | 2.0 | 0.14 | 0.04 | 3.15 |
| ON1231060 | 7.3 | 17.0 | 2.75 | 6.07 | 2.2 | 0.38 | 0.11 | 3.45 |
| ON123300 | 14.3 | 14.4 | 9.52 | 7.47 | 0.8 | 3.64 | 0.55 | 6.64 |
| ON123650 | 10.5 | 15.7 | 0.89 | 0.58 | 0.6 | 0.62 | 0.19 | 3.34 |
| ON123660 | 8.4 | 16.5 | 2.16 | 7.47 | 3.5 | 0.27 | 0.07 | 3.92 |
| ON123680 | 11.1 | 15.5 | 1.87 | 3.33 | 1.8 | 0.38 | 0.07 | 5.53 |
| ON123770 | 17.5 | 13.5 | 0.26 | 0.04 | 0.2 | 0.25 | 0.04 | 6.62 |
| ON123780 | 20.3 | 12.7 | 2.46 | 1.22 | 0.5 | 0.71 | 0.15 | 4.86 |
| ON123830 | 40.7 | 9.1 | 0.27 | 0.99 | 3.7 | 0.12 | 0.05 | 2.32 |
| ON123850 | 10.4 | 15.7 | 10.82 | 19.04 | 1.8 | 2.69 | 0.65 | 4.17 |
| ON123870 | 9.6 | 16.1 | 3.06 | 11.50 | 3.8 | 3.88 | 1.66 | 2.34 |
| ON123890 | 16.3 | 13.8 | 2.51 | 34.12 | 13.6 | 1.27 | 2.06 | 0.62 |
| ON123230 | 48.9 | 8.2 | ND | ND | ND | 0.20 | 0.03 | 8.09 |
The parameters were obtained from three assays; microsomal stability [t 1/2, predicted CL], MDCK-MDR1 [P app, efflux ratio], and unbound fractions in plasma and brain [F unbound, F up/F ub]. All values represent the mean of 3
ND none detected
In vitro cell-based BBB permeability and the potential influence of P-gp were assessed using the MDCK-MDR1 model (Table ΙΙ). Based on criteria that compounds with Papp (A–B) > 3 × 10⁻⁶ cm/s have a high potential to cross the BBB and those with Papp (A–B) < 1 × 10⁻⁶ cm/s a low potential, three compounds met the criteria of high potential with two of these being particularly high, ON123300 (9.52 × 10⁻⁶ cm/s) and ON123850 (10.82 × 10⁻⁶ cm/s), five compounds were of intermediate potential, and four compounds had low potential. A P-gp-mediated efflux ratio [ER], calculated as the ratio of Papp (B–A)/Papp (A–B) of >30 is an indication a compound may be a P-gp substrate and may be unable to reach effective brain concentrations. All of the ON123 series compound evaluated possessed efflux ratios under 30, and thus, are not likely candidates for P-gp-mediated transport.
Although the BBB plays a key role in modulating brain penetration, recent reports have highlighted the importance of drug binding to both plasma proteins and brain tissue as an indicator of drug accumulation in brain (22,23). Drug accumulation is clearly distinguished from the rate of BBB penetration measured by cell permeability assays, and can be predicted by the brain/plasma partition coefficient that can be estimated by the ratio of the unbound fraction in plasma to brain under the proviso of diffusional transport (24,25). As shown in Table ΙΙ, all 13 ON123 series compounds were highly bound to plasma and brain with brain/plasma partition coefficients clustered between 2 and 8 except ON123890 that had a low ratio of 0.62.
By collectively considering all factors (favorable BBB penetration, brain distribution and system clearance) that potentially impact brain exposure, the results from the three in vitro assays were cast into a graphical analysis (see Fig. 2) to select among the 13 compounds those with the most favorable in vitro PK characteristics. The human liver microsomal half-life is singularly expressed on the y-axis as it indicates the rate of drug elimination or system clearance. The x-axis is a linear combination of parameters simply constructed from the idea that high membrane permeability (i.e., Papp) and brain partitioning (i.e., Fup/Fub) contribute positively to brain distribution and appear in the numerator, whereas higher ER values should restrict brain penetration and appears in the denominator. This graphical analysis readily segregates the most favorable compounds based on their x–y coordinates, and although no single compound possessed the maximum x and y values, one compound ON123300 is distinguished with the maximum x-axis value and intermediate y-axis value and would be predicted to possess the most favorable in vivo PK characteristics.
Fig. 2.
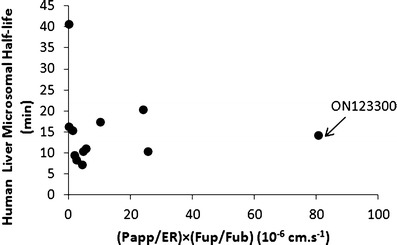
Graphical analysis of human liver microsomal half-life and a derived parameter obtained from the in vitro MDCK-MDR1 [i.e., (P app/ER)] and plasma and brain equilibrium dialysis assays [(F up/F ub)]. Each circle corresponds to one of the ON123 compounds analyzed in the tier 2 screening protocols. The compound with the most overall favorable characteristics is ON123300, designated by the arrow
Cassette Dosing Study and In Vitro/in Vivo Correlations
Cassette dosing PK analysis is used to improve the throughput of in vivo PK screens (26,27) and obtain key PK parameters as shown in Table III. In our case, we conducted in vivo cassette dosing studies to verify the in vitro results and to examine whether positive correlations existed between the in vitro measurements and comparative parameters measured in mice. Specifically, we compared drug clearance and brain partition coefficient [Pb = AUCb/AUCp] values for 12 of the 13 [insufficient supply of ON123230 for mouse PK study] compounds from the tier I screen. To compare the ability of in vitro liver microsomal metabolic stability studies to predict in vivo clearance we also performed the former using mouse liver microsomes, and found a positive in vitro–in vivo correlation (R2 = 0.542, Fig. 3) between the predicted mouse clearance and the total clearance in the cassette dosing studies. It should be noted that the compounds were well distributed among the categories of low-, medium-, and high-clearance classes that provides a measure of confidence on the utility of the in vitro metabolic stability assay.
Table III.
Pharmacokinetic Parameters of 12 ON123 Compounds Obtained from the Cassette Dosing Study
| Compound ID | AUCp (μg h/L) | AUCb (μg h/L) | AUCb/AUCp ratio | CL (mL/min/kg) | Vdss_obs (mL/kg) | t 1/2 (h) |
|---|---|---|---|---|---|---|
| ON1231030 | 111.21 | 788.03 | 0.14 | 52 | 3,963 | 2.07 |
| ON1231060 | 714.28 | 682.45 | 0.96 | 64 | 1,731 | 0.85 |
| ON123300 | 2,933.15 | 798.92 | 3.67 | 54 | 3,645 | 1.70 |
| ON123650 | 934.38 | 467.19 | 0.50 | 45 | 866 | 0.33 |
| ON123660 | 664.41 | 334.85 | 0.50 | 70 | 2,472 | 1.90 |
| ON123680 | 1,113.81 | 449.73 | 0.40 | 39 | 1,093 | 0.78 |
| ON123770 | 107.99 | 985.29 | 0.11 | 41 | 1,482 | 1.60 |
| ON123780 | 873.69 | 945.84 | 1.08 | 46 | 1,045 | 0.48 |
| ON123830 | 210.67 | 3,327.74 | 0.06 | 14 | 1,368 | 2.90 |
| ON123850 | 1,035.51 | 588.95 | 1.76 | 72 | 2,371 | 2.18 |
| ON123870 | 105.57 | 758.05 | 0.14 | 78 | 1,878 | 0.35 |
| ON123890 | 929.48 | 76.31 | 0.08 | 48 | 1,772 | 0.75 |
All compounds were administered as an intravenous bolus dose [2.5 mg/kg each] to mice in a single cassette. Discrete plasma and brain samples were collected over a 6-h period and then were analyzed by LC/MS/MS for drug concentrations. The following parameters were obtained by noncompartmental analyses
AUCp area under the drug concentration-time curve in plasma, AUCb area under the drug concentration-time curve in plasma brain, CL total systemic clearance, V dss apparent volume of distribution at steady state, t 1/2 terminal elimination half-life
Fig. 3.
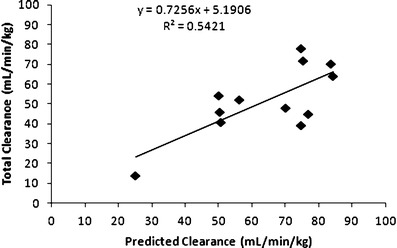
In vitro–in vivo correlation between predicted mouse clearance based on mouse microsomal stability assay and the total clearance from the cassette dosing study for 12 of the ON123 compounds
Several recent studies have shown the impact of drug protein and tissue binding on brain distribution (24,25), and based on the 12 compounds in our analyses there was limited agreement between the in vitro and in vivo brain partition coefficients (R2 = 0.256 see Fig. 4). For example, ON123770, predicted to have the highest brain partition coefficients (i.e., 6.62) from the in vitro binding studies, yielded one of the lowest in vivo brain partition coefficients based on the AUC ratio (i.e., 0.11). The lack of correlation could be attributed to the involvement of active transport mechanisms, either influx or efflux, which are not accounted for by the in vitro binding assays. To improve the correlation between in vitro and in vivo brain distribution parameters, parameters obtained from the MDCK-MDR1 cell permeability model were used. The MDCK-MDR1 model is widely used as a means to assess BBB permeability and provide an indication of a compounds potential to be a substrate for P-glycoprotein that serves as a common drug efflux pump on the BBB (7,8). The efflux ratios (i.e., ER, Table Ι), also generated from the MDCK-MDR1 assays, were relatively low and suggested that P-glycoprotein is not a determinant of brain accumulation for these compounds. However, since the MDCK-MDR1 model does not address the possible involvement of other transporters and due to the likelihood that passive diffusion is not the sole determinant of brain accumulation for these compounds, a role for other transporters seems plausible. By combining both parameters from the MDCK-MDR1 assay (i.e., ER and Papp) with the drug binding parameters into a hybrid parameter [Papp/ER × (Fup/Fub)] as described for Fig. 2, the in vivo brain partition coefficients [Pb = AUCb/AUCp] values were predicted reasonably well (R2 = 0.920, Fig. 5).
Fig. 4.
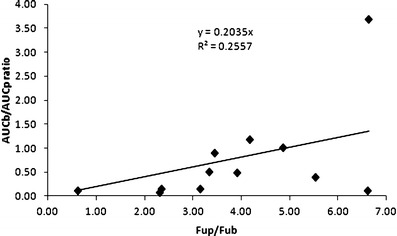
Relationship between the in vivo [(AUCb)/(AUCp)] and in vitro [F up/F ub] brain partition coefficients for the 12 of the ON123 compounds evaluated in the cassette dosing studies
Fig. 5.
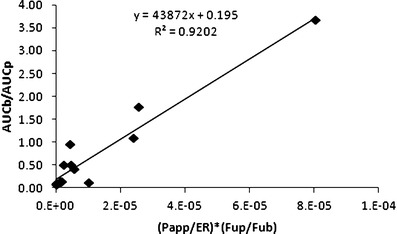
Relationship between the in vivo [(AUCb)/(AUCp)] brain partition coefficient and a derived parameter on the x-axis that is composed of the MDCK-MDR1 membrane permeability [P app] and efflux ratio [ER] values, and the unbound fraction in plasma [F up] and brain tissue [F ub] for 12 of the ON123 compounds
DISCUSSION
Development of drugs for brain diseases requires consideration of pharmacokinetic factors beyond what is typical of non-brain diseases due to the challenge of achieving acceptable BBB penetration that often eliminates drug candidates from further development. Moreover, the complexities of brain tumors, notably heterogeneity and variable BBB function, create additional uncertainties as to which preclinical development paradigms will be most informative on the ability of a candidate drug to achieve therapeutic concentrations. We applied a two-tier screening system to the ON123 series that was relatively parsimonious and efficient to identify compounds suitable for brain tumor chemotherapy.
Tier 1 screening incorporated two types of screens that have rather disparate endpoints, a rapid in silico screen to eliminate compounds with physicochemical properties that do not favor brain uptake, and a medium throughput cytotoxicity assay to determine potential efficacy in a standard glioma cell line. The rule-based in silico methodology is not uncommon in drug discovery, and here we made use of a general consensus that compounds of molecular weight greater than 450 Da and very low and high octanol/water partition coefficients do not penetrate into the brain (17,18). In addition, we utilized a calculated risk criterion that is similar to the well-known Lipinski’s Rule of 5 that is often used as an indicator of oral drug absorption, and further may also indicate brain penetration as CNS active compounds were found to have fewer hydrogen (H)-bond donors and lower polar surface area than compared to non-CNS compounds; criteria used in the ADMET risk parameter (28). The glioma cell cytotoxicity screen provides the first measure of compound efficacy and could eventually be used to build a pharmacodynamic profile. Some caution is warranted; however, as the results from a single cancer cell line could be misleading in that false negatives are possible in that some compounds may be active in glioma cells with different genetic characteristics. In general, the U87 glioma model is a robust test of drug activity since it lacks the tumor suppressor, PTEN, and is unable to regulate oncogenic PI3K that often leads to drug insensitivity. This seems to be the case with the ON123 series as only 13 of the 56 compounds possessed IC50 values of <10 μM, and on that basis were chosen for tier 2 screening.
The tier 2 screening procedures used three in vitro ADME assays that culminated in the identification of ON123300 as the lead compound in the series. In vitro microsomal half-life studies have been used extensively to obtain intrinsic metabolic clearance and elimination half-life data for prediction of in vivo hepatic clearance (11,29). According to the classification of hepatic blood clearance into low, medium, and high extraction groups, the 13 ON123 compounds were well distributed (see Table ΙΙ) and a favorable in vitro–in vivo correlation in mouse clearance was obtained (see Fig. 3).
The two remaining tier 2 assays, MDCK-MDR1 permeability and equilibrium dialysis binding, are used to indicate both the rate [permeability] and extent [binding assays] of drug accumulation in brain. The evaluation criteria for MDCK-MDR1 assay vary with differences due to of expression level of P-gp and cell culture conditions, such as the seeding density and postseeding time. In our study, caffeine, methotrexate, and paclitaxel were used as control compounds for CNS-positive and CNS-negative and P-gp substrates, respectively, and found to agree well with results presented in several recent publications that focused on the use of MDCK-MDR1 cells as screening tool (7,8). Based on such agreement, we chose the same threshold values for BBB permeation (compounds with Papp (A–B) > 3 × 10⁻⁶ cm/s have high potential to cross the BBB and those with Papp (A–B) < 1 × 10⁻⁶ cm/s low potential). It should be mentioned that compounds with a Papp (A–B) in the MDCK-MDR1 cells of lower than 1 × 10⁻⁶ cm/s does not necessarily disqualify a drug candidate as being a potential CNS-acting drug. Other parameters, including efflux ratios and unbound fraction, should be taken into consideration to judge the potential brain distribution. In the present study, estimates of Fub, Fup, and Fup/Fub ratio varied by 82-, 31-, and 13-fold, respectively, among the 13 compounds examined (Table ΙΙ) that highlights that even in the presence of highly variable plasma and brain binding the estimated brain partition coefficient varied much less. In fact, without ON123890 included, the range of predicted brain partition coefficients would have been less than 4-fold (i.e., 2.34 to 8.09, Table ΙΙ).
Implementation of these three in vitro ADME screens in the selection of new agents for brain tumor chemotherapy greatly enhanced the throughput and the ability to efficiently triage compounds prior to conducting in vivo pharmacokinetic studies. An important challenge to prevent premature elimination of compounds is to adequately balance the properties derived from each in vitro assays into a combined selection criteria. As illustrated in Fig. 2, a number of compounds that had in vitro human liver microsomal half-life value of >14 min, including ON123230 that possessed the most favorable half-life of 48.9 min, were unable to cross the cell membrane in MDCK-MDR1 assay, which can be explained that when compounds become more polar and less lipophilic, they tend to be more stable in the liver microsomal half-life screen (10). Incorporation of the parameters from the MDCK-MDR1 and binding assays into a hybrid parameter (i.e., (Papp/ER) × (Fup/Fub)) proved to be a reliable indicator of in vivo brain distribution (see Fig. 5) and showed that the compound, ON123300, with the highest hybrid value also had the highest in vivo brain/plasma partition coefficient. Use of either the MDCK-MDR1 assay or equilibrium binding assays (see Fig. 4) alone did not predict brain accumulation to the extent of the hybrid parameter. The hybrid parameter [i.e., (Papp/ER) × (Fup/Fub)] improved the ability to predict the brain exposure and is attributed to it accounting for both the rate and extent of brain distribution. In conclusion, an effective screening strategy was developed to select new agents for brain tumor chemotherapy from a series of low molecular weight anticancer agents [ON123x] by the combined use of in silico, in vitro cytotoxicity, and in vitro ADME profiling studies. One compound, ON123300, selected from the approach exhibited favorable cytotoxicity and brain penetration.
Electronic Supplementary Materials
Below is the link to the electronic supplementary material.
(DOCX 15 kb)
Acknowledgments
Acknowledgment
This work was supported by NIH grant CA127063 [JMG].
References
- 1.Levin VA. Are gliomas preventable? Recent Results Cancer Res. 2007;174:205–215. doi: 10.1007/978-3-540-37696-5_18. [DOI] [PubMed] [Google Scholar]
- 2.Ningaraj NS. Drug delivery to brain tumours: challenges and progress. Expert Opin Drug Deliv. 2006;3(4):499–509. doi: 10.1517/17425247.3.4.499. [DOI] [PubMed] [Google Scholar]
- 3.Motl S, Zhuang Y, Waters CM, Stewart CF. Pharmacokinetic considerations in the treatment of CNS tumours. Clin Pharmacokinet. 2006;45(9):871–903. doi: 10.2165/00003088-200645090-00002. [DOI] [PubMed] [Google Scholar]
- 4.Narayanan R, Gunturi SB. In silico ADME modelling: prediction models for blood–brain barrier permeation using a systematic variable selection method. Bioorg Med Chem. 2005;13(8):3017–3028. doi: 10.1016/j.bmc.2005.01.061. [DOI] [PubMed] [Google Scholar]
- 5.Gerebtzoff G, Seelig A. In silico prediction of blood–brain barrier permeation using the calculated molecular cross-sectional area as main parameter. J Chem Inf Model. 2006;46(6):2638–2650. doi: 10.1021/ci0600814. [DOI] [PubMed] [Google Scholar]
- 6.Bendels S, Kansy M, Wagner B, Huwyler J. In silico prediction of brain and CSF permeation of small molecules using PLS regression models. Eur J Med Chem. 2008;43(8):1581–1592. doi: 10.1016/j.ejmech.2007.11.011. [DOI] [PubMed] [Google Scholar]
- 7.Wang Q, Rager JD, Weinstein K, Kardos PS, Dobson GL, Li J, et al. Evaluation of the MDR-MDCK cell line as a permeability screen for the blood–brain barrier. Int J Pharm. 2005;288(2):349–359. doi: 10.1016/j.ijpharm.2004.10.007. [DOI] [PubMed] [Google Scholar]
- 8.Taub ME, Podila L, Ely D, Almeida I. Functional assessment of multiple P-glycoprotein (P-gp) probe substrates: influence of cell line and modulator concentration on P-gp activity. Drug Metab Dispos. 2005;33(11):1679–1687. doi: 10.1124/dmd.105.005421. [DOI] [PubMed] [Google Scholar]
- 9.Vichai V, Kirtikara K. Sulforhodamine B colorimetric assay for cytotoxicity screening. Nat Protoc. 2006;1(3):1112–1116. doi: 10.1038/nprot.2006.179. [DOI] [PubMed] [Google Scholar]
- 10.Yang Z, Zadjura LM, Marino AM, D’Arienzo CJ, Malinowski J, Gesenberg C, et al. Utilization of in vitro Caco-2 permeability and liver microsomal half-life screens in discovering BMS-488043, a novel HIV-1 attachment inhibitor with improved pharmacokinetic properties. J Pharm Sci. 2010;99(4):2135–2152. doi: 10.1002/jps.21948. [DOI] [PubMed] [Google Scholar]
- 11.Stringer R, Nicklin PL, Houston JB. Reliability of human cryopreserved hepatocytes and liver microsomes as in vitro systems to predict metabolic clearance. Xenobiotica. 2008;38(10):1313–1329. doi: 10.1080/00498250802446286. [DOI] [PubMed] [Google Scholar]
- 12.Boudinot FD, Jusko WJ. Fluid shifts and other factors affecting plasma protein binding of prednisolone by equilibrium dialysis. J Pharm Sci. 1984;73(6):774–780. doi: 10.1002/jps.2600730617. [DOI] [PubMed] [Google Scholar]
- 13.Dow N (2006) Determination of compound binding to plasma proteins. Curr Protoc Pharmacol. Chapter 7:Unit7.5. [DOI] [PubMed]
- 14.Maurer TS, Debartolo DB, Tess DA, Scott DO. Relationship between exposure and nonspecific binding of thirty-three central nervous system drugs in mice. Drug Metab Dispos. 2005;33(1):175–181. doi: 10.1124/dmd.104.001222. [DOI] [PubMed] [Google Scholar]
- 15.Obach RS, Baxter JG, Liston TE, Silber BM, Jones BC, MacIntyre F, et al. The prediction of human pharmacokinetic parameters from preclinical and in vitro metabolism data. J Pharmacol Exp Ther. 1997;283(1):46–58. [PubMed] [Google Scholar]
- 16.Iwatsubo T, Hirota N, Ooie T, Suzuki H, Shimada N, Chiba K, et al. Prediction of in vivo drug metabolism in the human liver from in vitro metabolism data. Pharmacol Ther. 1997;73(2):147–171. doi: 10.1016/S0163-7258(96)00184-2. [DOI] [PubMed] [Google Scholar]
- 17.Waterhouse RN. Determination of lipophilicity and its use as a predictor of blood–brain barrier penetration of molecular imaging agents. Mol Imaging Biol. 2003;5(6):376–389. doi: 10.1016/j.mibio.2003.09.014. [DOI] [PubMed] [Google Scholar]
- 18.van de Waterbeemd H, Gifford E. ADMET in silico modelling: towards prediction paradise? Nat Rev Drug Discov. 2003;2:192–204. doi: 10.1038/nrd1032. [DOI] [PubMed] [Google Scholar]
- 19.Narla RK, Liu XP, Myers DE, Uckun FM. 4-(3′-Bromo-4′hydroxylphenyl)-amino-6,7-dimethoxyquinazoline: a novel quinazoline derivative with potent cytotoxic activity against human glioblastoma cells. Clin Cancer Res. 1998;4(6):1405–1414. [PubMed] [Google Scholar]
- 20.Barazzuol L, Jena R, Burnet NG, Jeynes JC, Merchant MJ, Kirkby KJ, et al. In vitro evaluation of combined temozolomide and radiotherapy using x rays and high-linear energy transfer radiation for glioblastoma. Radiat Res. 2012;177(5):651–662. doi: 10.1667/RR2803.1. [DOI] [PubMed] [Google Scholar]
- 21.Luqiu Z, Yiquan K, Gengqiang L, Yijing L, Xiaodan J, Yingqian C. A new design immunotoxin for killing high-grade glioma U87 cells: From in vitro to in vivo. J Immunotoxicol. 2012; 1–6. [DOI] [PubMed]
- 22.Di L, Kerns EH, Carter GT. Strategies to assess blood–brain barrier penetration. Expert Opin Drug Discov. 2008;2(6):677–687. doi: 10.1517/17460441.3.6.677. [DOI] [PubMed] [Google Scholar]
- 23.Reichel A. Addressing central nervous system (CNS) penetration in drug discovery: basics and implications of the evolving new concept. Chem Biodivers. 2009;6(11):2030–2049. doi: 10.1002/cbdv.200900103. [DOI] [PubMed] [Google Scholar]
- 24.Hammarlund-Udenaes M, Fridén M, Syvänen S, Gupta A. On the rate and extent of drug delivery to the brain. Pharm Res. 2008;25(8):1737–1750. doi: 10.1007/s11095-007-9502-2. [DOI] [PMC free article] [PubMed] [Google Scholar]
- 25.Read KD, Braggio S. Assessing brain free fraction in early drug discovery. Expert Opin Drug Metab Toxicol. 2010;6(3):337–344. doi: 10.1517/17425250903559873. [DOI] [PubMed] [Google Scholar]
- 26.Zhang MY, Kerns E, McConnell O, Sonnenberg-Reines J, Zaleska MM, Steven Jacobsen J, et al. Brain and plasma exposure profiling in early drug discovery using cassette administration and fast liquid chromatography-tandem mass spectrometry. J Pharm Biomed Anal. 2004;34(2):359–368. doi: 10.1016/S0731-7085(03)00523-5. [DOI] [PubMed] [Google Scholar]
- 27.He K, Qian M, Wong H, Bai SA, He B, Brogdon B, et al. N-in-1 dosing pharmacokinetics in drug discovery: experience, theoretical and practical considerations. J Pharm Sci. 2008;97:2568–2580. doi: 10.1002/jps.21196. [DOI] [PubMed] [Google Scholar]
- 28.Zhao YH, Le J, Abraham MH, Hersey A, Eddershaw PJ, Luscombe CN. Evaluation of human intestinal absorption data and subsequent derivation of a quantitative structure-activity relationship (QSAR) with the Abraham descriptors. J Pharm Sci. 2001;90(6):749–784. doi: 10.1002/jps.1031. [DOI] [PubMed] [Google Scholar]
- 29.Obach RS. Nonspecific binding to microsomes: impact on scale-up of in vitro intrinsic clearance to hepatic clearance as assessed through examination of warfarin, imipramine, and propranolol. Drug Metab Dispos. 1997;25(12):1359–1369. [PubMed] [Google Scholar]
Associated Data
This section collects any data citations, data availability statements, or supplementary materials included in this article.
Supplementary Materials
(DOCX 15 kb)