Abstract
This report describes a pharmacokinetic/pharmacodynamic model for pramlintide, an amylinomimetic, in type 1 diabetes mellitus (T1DM). Plasma glucose and drug concentrations were obtained following bolus and 2-h intravenous infusions of pramlintide at three dose levels or placebo in 25 T1DM subjects during the postprandial period in a crossover study. The original clinical data were reanalyzed by mechanism-based population modeling. Pramlintide pharmacokinetics followed a two-compartment model with zero-order infusion and first-order elimination. Pramlintide lowered overall postprandial plasma glucose AUC (AUCnet) and delayed the time to peak plasma glucose after a meal (Tmax). The delay in glucose Tmax and reduction of AUCnet indicate that overall plasma glucose concentrations might be affected by differing mechanisms of action of pramlintide. The observed increase in glucose Tmax following pramlintide treatment was independent of dose within the studied dose range and was adequately described by a dose-independent, maximum pramlintide effect on gastric emptying of glucose in the model. The inhibition of endogenous glucose production by pramlintide was described using a sigmoidal function with capacity and sensitivity parameter estimates of 0.995 for Imax and 23.8 pmol/L for IC50. The parameter estimates are in good agreement with literature values and the IC50 is well within the range of postprandial plasma amylin concentrations in healthy humans, indicating physiological relevance of the pramlintide effect on glucagon secretion in the postprandial state. This model may prove to be useful in future clinical studies of other amylinomimetics or antidiabetic drugs with similar mechanisms of action.
KEY WORDS: diabetes, glucose, pharmacodynamics, pharmacokinetics, pramlintide
INTRODUCTION
In healthy subjects, normal blood glucose concentrations are tightly regulated by a complex interplay of several hormones, including amylin and insulin secreted from pancreatic β cells, glucagon from pancreatic α cells, and gastrointestinal insulinotropic incretins in response to nutrient stimuli (1). Ingestion of carbohydrates triggers insulin release from the pancreas and inhibits glucagon secretion in nondiabetic individuals. Glucagon primarily acts in the liver to counteract insulin action by stimulating glycogenolysis and gluconeogenesis, resulting in a rapid increase in endogenous production of glucose. Hence, it is the most important hormone for preventing hypoglycemia. However, in type 1 diabetic patients, an abnormal rise in glucagon concentrations after meals often results in excursions of postprandial glucose and exacerbates diabetic control (2). This dysregulation has been postulated to be due in part to inappropriate beta-cell suppression of alpha-cell glucagon secretion and lack of intra-islet insulin (3,4). In addition, T1DM patients often manifest both insulin and amylin deficiency, particularly important in postprandial glycemic control.
Human islet amyloid polypeptide (5) (IAPP) is a 37 amino acid peptide, which forms fibrils in vitro and is toxic to cultured pancreatic beta cells (6). In contrast, rat IAPP differs from human IAPP at only six amino acid residues, but rat IAPP does not fibrillize. Three proline residues in the rat IAPP sequence play an important role in preventing fibril formation (7). Pramlintide was designed with proline substitutions at positions 25, 28, and 29 residues from rat IAPP. It has improved solubility and nonaggregating properties compared with native human amylin (8). Pramlintide was approved by the Food and Drug Administration in March 2005 as adjunctive therapy of patients with type 1 or 2 diabetes mellitus who failed to achieve glycemic control despite optimal therapy with insulin. Clinically, the benefit of using pramlintide as an adjunct treatment to mealtime insulin in type 1 diabetic patients was carefully examined (9). Pramlintide suppresses postprandial secretion of glucagon, delays gastric emptying, and increases satiety (10), all leading to the decreased influx of the endogenous and exogenous glucose into the circulation after a meal.
Empirical measures such as the area under the glucose concentration–time curve (AUCnet) have been used to evaluate the pharmacological effects of pramlintide (11,12). The temporal and causal relationships between drug exposure and the extent of glucose reduction have not been well characterized. In 1996, Colburn et al. (13) first applied pharmacokinetic/pharmacodynamic (PK/PD) modeling to describe pramlintide effects on postprandial glucose using a linked biophase with an empirical sigmoid Emax model. However, parameter estimates of the biophase rate constant, keo, and EC50 increased with dose, no fitted curves were provided, and the underlying basis of the drug action was not made clear. A mechanism-based PK/PD model can provide meaningful and physiologically relevant insights into the control of pramlintide on complex postprandial glucose regulation. In this study, we used the data originally published (13). This study develops a PK/PD model based on the mechanisms of action of pramlintide that characterize the exposure of pramlintide and its effects on plasma glucose during the postprandial period using a nonlinear mixed effects modeling approach. We sought a parsimonious and physiologically meaningful model to resolve drug and system-related parameters.
METHODS
Subjects
In the original publication (13), the authors describe 25 male subjects with T1DM who participated in the clinical study. All subjects were white except for one Hispanic. The mean (±SD) age, body weight, and height were 29.6 ± 6.8 years, 170.4 ± 17.0 lb, and 71.6 ± 2.5 in. All subjects had been diagnosed with T1DM for 2–20 years before study entry. The glycosylated hemoglobin values were between 6.1 and 13.0% and basal C-peptide concentrations were <0.6 ng/mL. All subjects had stable glycemic control using insulin for at least 2 weeks and not having more than 10% required adjustment of insulin dose in the week before the start of the study. The study protocol was approved by local Institutional Review Boards and written informed consent was obtained from each subject prior to enrollment.
Study Design
A total of 25 subjects with T1DM divided into three groups participated. This was a randomized, single-blind, placebo-controlled, ascending-dose clinical trial designed to evaluate pharmacokinetics, pharmacodynamics, and safety of pramlintide (13). The complete details of study design were described in the original publication (13). Pramlintide doses of 30 μg (group 1), 100 μg (group 2), or 300 μg (group 3) were administered as a bolus (2 min i.v. infusion) and as an infusion (120 min i.v. infusion) to each group. Subjects in each dose group underwent a two-period crossover where the bolus and infusion doses of pramlintide were given. This crossover was accomplished within a 2-week interval. During each part of these crossover periods, the subjects were confined to the clinical trial unit for 3 days: the first day for baseline measurements and acclimatization; the second and third day for an embedded crossover, i.e., from placebo to pramlintide or vice versa. Therefore, each subject received two pramlintide treatments (bolus and infusion) at a specific dose level (dose group), and each pramlintide dose was accompanied by PK measurements and matching PD observations collected during the placebo and active drug treatment. One subject who completed only the first crossover was included in our PK/PD analysis; however, this subject was excluded in the earlier data analysis (13). Additionally, two subjects in each dose group were randomly assigned to receive only placebo throughout the study to help assess drug-safety aspects. The PD data for these subjects were also used in the assessment of the PK/PD relationships. The drug was injected into a forearm vein contralateral from the i.v. cannula used for blood sampling. The PK blood samples were collected 30 min prior to dosing, at the end of the 2-min bolus dose, and at 5, 15, 30, 45, 60, 90, 120, 150, 180, and 240 min after completion of the bolus dose; and 30 min prior to dosing, and at 30, 60, 120, 135, 150, 165, 180, 210, 240, and 300 min after beginning the 2-h infusion. Blood samples were collected for the measurement of plasma glucose at 30 min predosing, at the end of the 2-min bolus dose, and at 15, 30, 60, 90, 120, 180, 240, 300, and 630 min after completion of the bolus dose; and at 30 min pre-dosing and at 15, 30, 60, 90, 120, 150, 180, 210, 240, 300, and 630 min after beginning the 2-h infusion. Each subject followed a fixed insulin and meal regimen based on their screening interview and history, and daily caloric intake was reflected in the individual’s interview and history. Subjects injected their usual prebreakfast dose of insulin approximately 30 min before initiating the bolus or infusion dose. Breakfast was served 30 min after dose initiation.
Analytical Procedures
The analytical methods were described previously (13). In brief, plasma pramlintide equivalent concentrations were measured with a two-site “sandwich” immunoradiometric assay using an 8-point standard curve. The average minimum detectable concentration for this study was 3.7 pmol/L with a range of 1.0–10.8 pmol/L. Intra- and interassay coefficients of variations were <10% and 15% across the range of the assay. This assay is susceptible to interference by endogenous amylin and the des-lysine-pramlintide metabolite. It should be noted that, in this study population, amylin plasma concentrations were nondetectable or at the low end of the normal range; thus, the measurements would largely reflect the pramlintide and its active metabolite concentrations.
Structural Model Development
For the PK data of pramlintide, a total number of 342 observations in 18 individuals were used for the PK model building. Individuals in the placebo group had negligible endogenous amylin compared to the measured drug concentrations, and most were below the detection limit. Therefore, they were not included in the PK data analysis. Plasma glucose data for all individuals were modeled with a total number of 1,028 observations in 25 individuals including both placebo and drug dosing results.
Pharmacokinetic Model
A noncompartmental (NCA) assessment was first carried out to compare selected parameters for the bolus and infusion doses. Parameters generated were Cmax, Tmax, AUC0−inf, clearance (CL), volume of distribution (Vss), and T1/2. Dose proportionality was assessed by nonlinear regression analysis as:
 |
1 |
where b is a power coefficient.
A series of PK models including one-, two- and three-compartment models with zero-order input and first-order elimination from the central compartment with and without lag time were assessed to describe the PK of pramlintide. A base model without covariates was evaluated first, and all random effects were assumed as a log-normal distribution. A proportional error model was used to describe the residual variability for the plasma drug concentrations. Because 13.8% of PK data were reported as below the lower limit of quantification (LLOQ), the M3 method in NONMEM was used to maximize the likelihood for observations below the LLOQ with respect to the model parameters (14,15).
All PK models assuming 2 min i.v. cannula infusion for the bolus regimen without a lag time significantly overestimated the drug concentrations in the first blood samples collected 2 min after the start of the drug infusion and underestimated the plasma concentration at 7 min. We observed that the mean of the maximum plasma drug concentration occurred from 4 to 7 min for the 2 min i.v. infusion and at 90–110 min for the 120 min i.v. infusion, both of which did not occur at the end of protocol-defined infusion time. This was also observed and addressed by Colburn et al. (13). For the short 2- min infusion, the actual dosing time may exceed the protocol-defined 2 min, or there was a lag time before concentrations were observed; for the 120-min infusion, the results may have reflected random variability. Furthermore, in this study, 5 mL blood samples was collected at each time point (13), which suggests that blood withdrawal times were not fast. The circulation time for drug molecules from the site of injection to the contralateral vein of blood sampling may be an issue. Lastly, the pramlintide assay measurement may detect cross-reactive metabolites, which may contribute to the increase in measured concentrations after the end of the infusion. In order to account for the practical inaccuracies and justify the variability, we sought to estimate the duration of infusion for the bolus regimen along with the interindividual variability (IIV). Adding the lag time greatly improved the model stability and visual fitting. A significance level of 0.05 based on the likelihood ratio test was used to evaluate significance of incorporating additional compartments and the lag time.
As PK samples were available on two occasions for each subject, interoccasion variability (IOV) was evaluated for each PK parameter. The model for subject i at occasion j was
 |
2 |
where Pij is the ith individual’s parameter value at jth occasion as a function of P, the typical parameter value in the population, and ηi and κij are assumed to be independently, normally distributed variables with mean zero and variances ω2 and π2.
The likelihood ratio test (LRT) and drop in residual variability were used to assess the significance of including IOV. Regarding covariate model building, initial covariate screening was examined graphically by plotting the individual posterior Bayes estimates of PK parameters generated from the base structure model versus age, body weight, and body mass index. Each covariate was tested using either a linear or power covariate function model centered to the median covariate value in the dataset. Forward selection of any covariate was based on the LRT at a significance level of 0.05. Correlations between parameters were assessed by graphical inspection of the individual parameter values and tested using off-diagonal elements in the covariance matrix. The final PK parameter estimates were fixed in the subsequent PD analysis.
Pharmacodynamic Model
The PD model was developed based on the fundamental actions of pramlintide. The drug delays gastric emptying time, thereby affecting glucose reaching the intestinal absorption site, and also inhibits postprandial glucagon secretion to reduce endogenous glucose production (4,16). Pramlintide effects on satiety were not considered to be important due to the short time frame of the study.
The overall patterns of gastric emptying are dependent on the type of meal (17). The emptying of a solid meal approximates a zero-order pattern, whereas the gastric emptying of a liquid meal is relatively faster with a first-order pattern (17,18). Similar types of gastric emptying patterns for either solid or liquid components of the meal were also observed in assessing pramlintide effects (19). Due to lack of detailed information about the meal components and carbohydrate amounts, the amount of glucose (D) in the meal was assumed to be an arbitrary value of 50 g, and the bioavailability (F) of glucose absorbed from food together with its IIV was estimated in the model. A two-compartment disposition model with elimination from the central compartment was used previously to describe glucose kinetics. In this pramlintide study, there is insufficient information in the data to support the estimation of the central and peripheral volumes of distribution and the intercompartmental clearance. Therefore, these parameters were fixed to literature values (20). We examined different gastric emptying models. Oral ingestion of glucose from meals represents a key component in the model; two published models were examined (21,22). The first model used a semiphysiological model mimicking glucose transit through the gastrointestinal (GI) tract before reaching the systemic circulation and assumed two compartments for stomach and one compartment for intestine (22). In the second model, a series of transit steps described glucose absorption after an oral glucose tolerance test (21). Both models have a first-order rate constant for glucose transit through the GI tract. We also examined a linear gastric emptying model. The latter resulted in best fitting of postprandial glucose concentrations in plasma.
Glucose homeostasis is basically a turnover process. Hence, an indirect response (IDR) model was used to describe the plasma glucose concentrations during the postprandial period. The final PK/PD model is displayed in Fig. 1. A dose-independent increase in the observed glucose Tmax following pramlintide treatment compared to placebo justifies using a maximum, dose-independent pramlintide effect to describe the drug delaying the time for glucose entry into blood. Furthermore, the delayed Tmax and reduced AUCnet indicated that overall plasma glucose concentrations might be affected by different mechanisms of action of pramlintide.
Fig. 1.
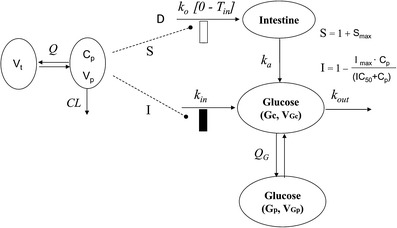
Schematic representation of the PK/PD model. The dotted lines and bars depict stimulatory (open bar, represents increase in T in) and inhibitory (closed bar) effects of pramlintide on the various processes via indirect mechanisms. Symbols are defined in Tables I–III
A two-compartment IDR model was used to describe the turnover of glucose and its distribution kinetics. The input of glucose is described by the sum of net entry of exogenous glucose from the meal (k0) and endogenous glucose from hepatic output (kin) and kout indicates the net removal of glucose by tissue uptake and utilization. The duration (Tin) of zero-order input of glucose transit from stomach to small intestine (Int) describes the gastric emptying and a first-order rate constant (ka) depicts absorption of glucose from intestine, with pramlintide prolonging (S) the duration of glucose input and inhibiting kin (I). The effect of pramlintide on gastric emptying was modeled using a linear function including the parameter Smax, assuming that all studied doses had the same effect. Initially, we evaluated different dose–response relationships; with the sigmoidal equation, the estimated SC50 was very small with a relatively high standard error.
Due to lack of suppression of postprandial glucagon, endogenous hepatic glucose release contributes in part to the postprandial hyperglycemia (23). Hence, incorporating an inhibitory function on the glucose production side is necessary to account for one mechanism of action of pramlintide. This effect of pramlintide was modeled using an inhibitory sigmoidal Imax (maximum effect of the pramlintide concentration on endogenous glucose production) function. The PD equations are:
 |
3 |
 |
4 |
 |
5 |
 |
6 |
 |
7 |
 |
8 |
 |
9 |
where Int(0) is the premeal glucose amount in the intestine, Gc0 is the baseline central compartment glucose amount that is estimated by the product of the baseline plasma glucose concentration and the central volume of distribution  , Gp is the amount of glucose in the peripheral compartment with volume of distribution of 8.56 L, and Cp is the plasma drug concentration. The Imax and IC50 represent the maximum inhibition of kin and the plasma drug concentration required at one half of Imax. Baseline (predose) and sample times of 300 or 302 min were used for the PD data analysis.
Data Analysis
Nonlinear mixed effect models using NONMEM Version VII level 2.0 (first-order conditional estimation with interaction) (24) were used (Appendix). Diagnostic graphs were created in S-Plus version 8.0 (Insightful Corp, Seattle, Washington, USA). Phoenix WNL 6.1 (Pharsight Corp., Mountain View, California, USA) was used for noncompartmental PK analysis. Nonlinear regression analysis of AUC0−inf and Cmax with dose was used to examine linearity across all dose levels. This was implemented with the SAS 9.1 procedure NLIN. For PD exploratory data analysis, the fasting plasma glucose measured before dosing was used as baseline values to determine the net area under the glucose concentration–time curve (AUCnet). The AUCnet was calculated as the difference between AUC above baseline between time of drug dosing and 5 h and AUC below baseline between time of drug dosing and 5 h using Phoenix WNL 6.1. The peak glucose concentration time (Tmax) and AUCnet were compared between dosing groups. The paired Student’s t test was used in SAS 9.1 with a significance level of p < 0.05. Data are presented as mean ± SD.
Model Selection and Evaluation
Between-subject variability in PD model parameters was assumed to be log-normally distributed. An additive residual error model was fitted to the log-transformed glucose data. Because data were obtained from two different sites, we expected that the residual error might not be constant across all individuals. Hence, an interindividual variability term (ηi) was included in the residual error model to account for the individual contribution to the residual error (25). A series of transit compartments was used to model the lag time, which was expected to provide a smooth transition. However, this approach did not provide an improvement, likely due to overparameterization. The asymptotic standard errors of NONMEM estimates for the PD model could not be obtained due to an unsuccessful covariance step; hence, bootstrap analysis was performed. The 95% CI of parameter estimates were reported based on a 500-replicate-bootstrap datasets. The final model was chosen based on mechanistic plausibility, goodness-of-fit plots, precision of parameter estimates, comparison of the objective function value for nested models, and the principle of parsimony. The final PK/PD models were evaluated by visual predictive checks (VPCs), stratified by dosing regimen. Because the baseline glucose varied widely, both between and within individuals, we implemented an individual baseline corrected VPC for the PD model (26). The median and 90% prediction intervals (P5–P95) of the individual concentration–time profiles of pramlintide and glucose were determined from simulated data in 1,000 subjects for each dosing group and superimposed on the observed data.
RESULTS
Pharmacokinetics
In comparison with the original NCA results (13), the parameters reported in Table I are in excellent agreement. The AUC0−inf and Cmax values increased with dose. The estimated power coefficient b was 0.99 with 95% CI of (0.916, 1.25). Similar results were obtained for Cmax (data not shown). The 95% CI includes 1.0, which indicates that the PK of i.v. pramlintide was proportional over the 30–300 μg dosage range. The Cmax did not occur at the end of the 2-min bolus or 120-min infusion for all subjects. In addition, we found some inconsistency in terminal half-life for the three dosages. The shorter t1/2 at the 30 μg dose might be caused by the profiles reaching the limit of detection (2 pmol/L). The actual variability in terminal half-life was higher for the 100 and 300 μg doses than for the 30 μg dose.
Table I.
Noncompartmental Pharmacokinetic Parameters
| Parameter (units) | Bolus dose (μg) | Infusion dose (μg) | ||||
|---|---|---|---|---|---|---|
| 30 (n = 6) | 100 (n = 6) | 300 (n = 6) | 30 (n = 6) | 100 (n = 6) | 300 (n = 6) | |
| AUC (pmol min/L) | 5,410 ± 2,030 | 28,200 ± 4,830 | 78,900 ± 14,200 | 71,40 ± 1720 | 25,400 ± 5,950 | 94,100 ± 12,100 |
| V (L) | 50.7 ± 48.7 | 37.2 ± 12.6 | 32.8 ± 5.89 | 35.9 ± 15.7 | 43.4 ± 15.1 | 32.9 ± 11.4 |
| CL (L/min) | 1.90 ± 1.62 | 0.923 ± 0.179 | 0.984 ± 0.141 | 1.12 ± 0.287 | 1.04 ± 0.252 | 0.819 ± 0.110 |
| C max (pmol/L) | 304 ± 141 | 1300 ± 322 | 3700 ± 610 | 67.5 ± 8.72 | 221 ± 35.9 | 827 ± 97.9 |
| t max (min) | 4 ± 3 | 6 ± 2 | 7 ± 0 | 90 ± 27 | 110 ± 25 | 90 ± 27 |
| t 1/2 (min) | 22.5 ± 5.02 | 55.1 ± 34.7 | 50.7 ±10.0 | 19.6 ± 2.41 | 36.7 ± 9.63 | 49.8 ± 15.8 |
Data are reported as mean ± SD
Pharmacokinetic Modeling
The PK profiles exhibited a biexponential decline and were best described by a two-compartment linear model with first-order elimination including a lag time. The PK parameters generated were: clearance (CL), central volume (V1), peripheral volume (V2), and distribution clearance (CLD). Adding interoccasion variability of CL was found to significantly improve the model fitting. No covariates were included in the final PK model. The CL and V1 were correlated and estimation of the covariance parameter was included in the final model. Figure 2 depicts the individual observed data and the predictive performance of the PK model as assessed by visual predictive checks. The population PK model well describes the time course of drug concentrations for all doses. However, we observed slight overprediction in the 100-μg dosing group, and the trend is more evident in the 30-μg bolus dosing group. This could result from the small sample size, insufficient data to support accurate estimate of the dosing time, and/or model complexity. One individual in the 30-μg bolus dosing group had much lower plasma drug concentrations than others, while this was not obvious in the crossover infusion study. We kept this subject in the data analysis as we cannot explain the reason that may contribute to some of the deviations in Fig. 2. It was important to adequately describe the PK as it provides the driving force for the PD analysis. For the short 2 min i.v. infusion, any practical inaccuracies would represent a larger fraction of the dosing time compared to the long 120 min i.v. infusion; hence, it is important to take that into account. Initially, we sought to estimate the dosing time with IIV for the short infusion along with a lag time to account for any deviations or inaccuracies from protocol-defined dosing and blood sampling times. However, the population mean estimate for the dosing time was very sensitive to initial values, indicating insufficient data to support a reliable estimate. This is likely due to variability of drug concentrations in the first venous blood samples across individuals and a limited number of individuals in the study. Therefore, we fixed the population mean of the dosing time to 4 min, which produced the best PK fitting results in the range of 2–7 min that we tried. The individual Bayes estimates ranged from 1.73 to 6.57 min, which is consistent with the observed time range for the occurrence of the maximum drug concentrations. In the original report (13), the infusion duration that was fixed for bolus regimen varied between 2 and 7 min, and the PK parameters changed as dose and regimen changed. The PK model that we implemented with a lag time provided a suitable means to fit the observed data. The estimated PK parameters are summarized in Table II. The population mean estimate of CL was 0.955 L/min and displayed 10.8% variability between occasions. The individual posterior Bayes estimates of PK parameters were fixed in the subsequent PD analysis.
Fig. 2.
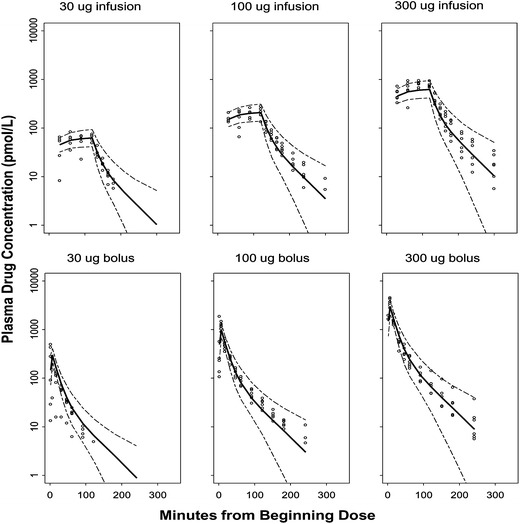
Visual predictive check for plasma drug concentrations versus time for each dose group. The dashed lines are the 90% prediction interval, and the bold line is the predicted median. The circles are the observed plasma drug concentrations
Table II.
Population Pharmacokinetic Parameters
| Parameter (units) | Definition | Estimate (RSE%) | IIV (RSE%) | IOV (RSE%) |
|---|---|---|---|---|
| Structural | ||||
| CL (L/min) | Clearance | 0.955 (12.4) | 19.5 (37.6) | 10.8 (25.1) |
| V 1 (L) | Central volume | 19.1 (13.3) | 23.3 (40.4) | – |
| V 2 (L) | Peripheral volume | 11.0 (11.3) | 61.8 (21.2) | – |
| CLD (L/min) | Distribution clearance | 0.283 (12.7) | – | – |
| D 1 (min) | Duration of short infusion | 4 | 37.2 (25.1) | |
| T lag (min) | Lag-time | 0.430 (10.9) | – | – |
| CorrCL_V1 | Correlation coefficient | 0.487 | ||
| Residual variability | ||||
| Proportional (%) | 26.2 (3.85) | |||
RSE relative standard error calculated as a standard error divided by population estimate; IIV interindividual variability, expressed as standard deviation in percent; IOV interoccasion variability, expressed as standard deviation in percent
Pharmacodynamics
Pramlintide dosing resulted in a decrease of at least 40% in the mean 5-h integrated glucose AUCnet for all doses and dosage regimens except for the 30-μg bolus group (Fig. 3). When comparing drug and placebo counterparts for each dosing group, the differences were significant (P < 0.05) for both the 100- and 300-μg dose groups. The peak glucose concentration time (Tmax) also significantly increased (P < 0.05) in the 100-μg dosing group for all modes of administration (Fig. 4). Nevertheless, Tmax increased for all dosing groups compared to placebo. In addition, in order to assess the interoccasion variability, six individuals who were only given placebo on different occasions were evaluated. No significant differences (P < 0.05) occurred for either AUCnet or Tmax measurements (Figs. 3 and 4). After accounting for day-to-day variability, the results indicated that pramlintide lowered overall postprandial plasma glucose and delayed the time to peak plasma glucose concentrations after meals. For Tmax, the delay seems to be independent of dose, since the percentage increase of Tmax compared to placebo is not significantly different among all regimens (data not shown). This might be due to a maximal effect at the lowest dose examined, which is consistent with literature observations (27).
Fig. 3.
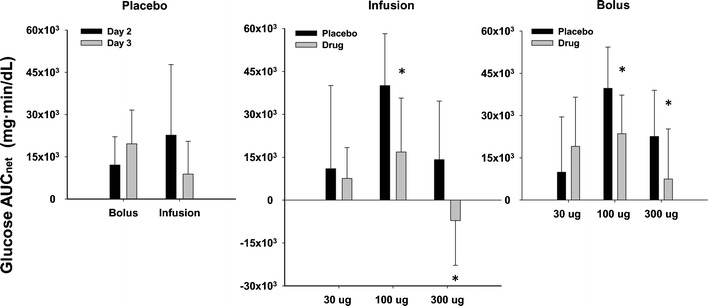
Glucose AUCnet for various treatments. Data are mean ± SD. Statistically significant differences between day-to-day in placebo groups or between placebo and pramlintide groups at different doses are indicated by an asterisk (*P < 0.05)
Fig. 4.
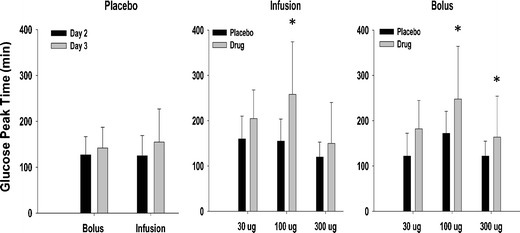
Glucose T max for various treatments. Data are mean ± SD. Statistically significant differences between placebo and pramlintide groups at different doses are indicated by an asterisk (*P < 0.05)
From the time course of typical glucose concentration profiles (Fig. 5), we observed that, compared with placebo profiles, glucose concentrations decreased after meals except for the 30-μg bolus dosing group. This group shows higher peak glucose concentrations than placebo, which cannot be explained by the mechanisms of action of the drug. However, the same group of subjects did not show a similar pattern in the infusion regimen. This discrepancy may be due to the small number of subjects examined or the variability in this study.
Fig. 5.
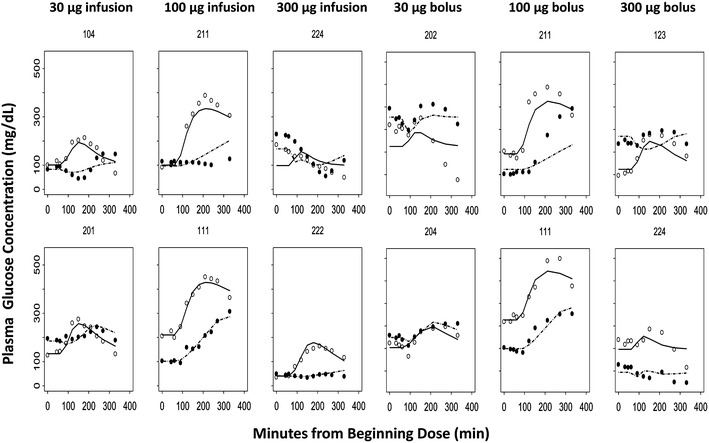
Time course of observed (symbols) and individual predicted (lines) plasma glucose concentrations in representative subjects for each dose group. The first row shows the worst fitting results, and the second row shows the best fittings from different dosing groups. Each panel graph represents placebo and active treatment crossover in the same subject with T1DM. Open circles and dashed lines represent placebo, and closed circles and solid lines represent the pramlintide treatment profiles
Pharmacodynamic Modeling
Representative observed time courses of glucose concentrations and the individual baseline corrected visual predictive checks for the final PD model are shown in Figs. 5 and 6. From both of the representative best and worst fitting results, the mechanistic PD model adequately described the postprandial glucose concentrations after different dosing regimens. The estimated PD parameters are summarized in Table III. In general, the final estimated parameters controlling glucose turnover are in good agreement with literature values (20–22,28–32). The population mean estimate of baseline glucose concentration was 161 mg/dL and displayed 37.1% variability between occasions. In addition, the final drug-specific parameter estimates are also in good accordance with reported values (4,16,33).
Fig. 6.
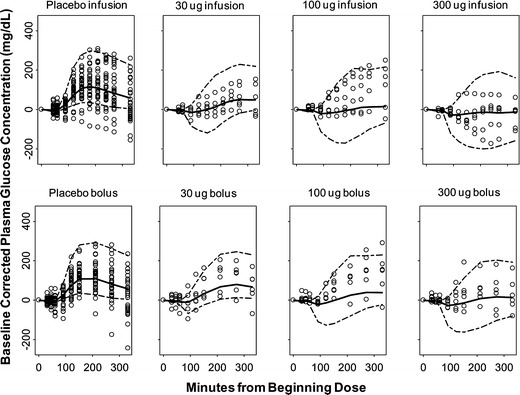
Baseline corrected visual predictive checks for plasma glucose concentrations versus time for each dose group. The dashed lines are the 90% prediction interval, and the bold line is the predicted median. The circles are the observed plasma glucose concentration values
Table III.
Population Pharmacodynamic Parameters
| Parameter (units) | Definition | Estimate | IIV | IOV |
|---|---|---|---|---|
| (Bootstrap 95% CI) | ||||
| Structural | ||||
| T in (min) | Duration of 0-order input of glucose into intestine | 85.9 | 39.7 | – |
| k out (min−1) | Rate constant for glucose utilization | 0.0146 (0.00987, 0.0271) | 83.1 (50.2, 122) | – |
| V Gc (L) | Central volume of distribution of glucose | 9.33a | – | – |
| V Gp (L) | Peripheral volume of distribution of glucose | 8.56a | – | – |
| Q G (L/min) | Intercompartmental clearance of glucose | 0.442a | – | – |
| k a (min−1) | Rate constant for glucose input into plasma | 0.0282 (0.0167, 0.0371) | – | – |
| F | Oral bioavailability of 50 g of glucose | 0.843 (0.518, 1.24) | 48.5 (0.478, 132) | |
| I max | Maximum inhibitory effect of pramlintide on k in | 0.995 (0.429, 1.0) | – | – |
| S max | Maximum stimulatory effect of pramlintide on T in | 1.26 (0.725, 2.98) | – | – |
| IC50 (pmol/L) | Pramlintide concentration at one-half I max | 23.8 (1.53, 162) | – | – |
| G 0 (mg/dL) | Baseline plasma glucose concentration | 161 (135, 190) | 38.4 (21.5, 52.7) | 37.1 (30.3, 42.8) |
| Residual variability | ||||
| Residual error | 15.7 (13.1, 18.1) | 39.5 (11.3, 61.5) | ||
IIV interindividual variability, expressed as standard deviation in percent; IOV interoccasion variability, expressed as standard deviation in percent
aObtained from reference (20)
Different types of relationships were also investigated to describe the effects of pramlintide on Tin or kin. Although individual insulin and glucagon values were not available in this study, we evaluated models that used an empirical Bateman function to describe the increase in kout with an assumption that the major action of insulin is to stimulate glucose disposition to prevent postprandial glucose excursion as well as models with transit compartments assuming a delayed effect of glucagon on glucose endogenous production kin. Due to model complexity and lack of relevant information, additional parameter estimates could not be obtained with reasonable precision, and therefore, insulin effects were not included in the final model. However, the current model could be further improved and extended with such measurements.
The negative feedback triggered by increases of glucose concentration on the endogenous production kin was evaluated similarly as in the literature (20,21). The estimated parameters related to either a direct glucose effect on its own production or an indirect feedback with delay were negligible, which is consistent with an expectation of lack of significant glucose feedback on its own production in diabetic patients (20,21).
Others (34) have shown that a significant difference in gastric emptying time even within a normal postprandial glucose concentration range of 4–8 mM may occur in both healthy subjects and T1DM patients. Nonetheless, hyperglycemia is known to slow while hypoglycemia is known to accelerate gastric emptying (34). An inhibitory indirect response model that incorporates the influence of glucose on gastric emptying time was evaluated for fitting of the glucose and gastric emptying data from the current study. However, the resulting parameters were not physiologically meaningful and the model produced poor goodness-of-fit plots. In part, the failure to successfully model this pharmacological response may indicate that the data generated from the study design did not sufficiently elucidate pramlintide effects on gastric emptying.
DISCUSSION
Amylin is a 37-residue peptide hormone, which is cosecreted with insulin by pancreatic β cells in response to nutrient stimuli (35). The pharmacological usage of native human amylin was hindered by the limited physicochemical properties of this peptide. Pramlintide is a potent synthetic analog of human amylin and has been the only amylinomimetic available in the USA since 2005. The drug acts predominantly by inhibiting gastric emptying and reducing excessive hepatic glucose production during postprandial periods. In this study, a mechanism-based PK/PD model was developed to describe the quantitative relationship between drug exposure and pharmacological effects for pramlintide.
The PK of pramlintide was best described by a two-compartment linear model with estimated CL of 0.955 L/min, which is in accordance with pramlintide being primarily metabolized and eliminated via the kidneys (36). The primary active metabolite des-lysine-pramlintide has a similar t1/2 and biological activity in rats (36), which justifies using the total drug concentration as the driving force in the PD analysis. In this study, a few subjects exhibited detectable endogenous amylin concentrations; however, they were negligible compared to the measured total drug concentrations and thus not considered in the PK analysis. Due to insufficient information and relatively tight distribution of an available covariate such as body weight, no covariate was included in the final PK model. Informative covariate analysis requires a more diverse patient population. Although a two-compartment disposition model was used to describe the PK data as previously reported (13), we approached the modeling differently. Instead of fitting individual sets of PK parameters for the different regimens, a population analysis was used to simultaneously quantify the model parameters and describe sources of variability. The population model accounts for data below the LLOQ using a likelihood approach, and this technique may improve the accuracy and precision of parameter estimates. In this analysis, we used the M3 method in NONMEM, which is recommended when over 10% of data are below LLOQ (14). Finally, for the 2 min i.v. infusion data, preliminary population modeling of the data suggested that a mean duration of infusion of 4 min (with 37.2% IIV) together with a lag time helped to accommodate the observed variability and possible deviations in the length of infusion and plasma sampling times.
Glycemic control is a complex and highly integrated process, where the normal plasma glucose concentration is maintained by the balance between glucose production and utilization. Glucose production originates from dietary carbohydrate absorption, glycogenesis during fasting states, and gluconeogenesis in the liver. In healthy individuals, increased glucose concentrations stimulate insulin secretion from pancreatic β cells and insulin counterbalances the disturbed glucose homeostasis by increasing peripheral glucose utilization and reducing hepatic glucose output. The proposed dual indirect response model adequately captured the time course of glucose concentrations during the postprandial period. The kout was estimated at 0.0146 min−1 with relatively high intersubject variability, which reflects the heterogeneous disease status in type 1 diabetic patients. Because insulin effects were not directly included in the final model, the final parameter estimate for kout might be better interpreted as a combination of exogenous premeal insulin effect and net removal of glucose in the basal state. The kout value is similar to estimated values in healthy individuals (0.011–0.071 min−1) (20,28–30) and to the estimate in type 2 diabetic patients after an OGTT (0.00861 min−1) (21). This is in accordance with the expectation that the major effect of insulin is to stimulate glucose utilization after meals. Studies including measurements of insulin would facilitate an improved characterization of kout. The estimated glucose bioavailability from the meal is 0.843, which is similar to estimated values in patients with T1DM (37). In healthy individuals, carbohydrate is released from the stomach into the intestine at a rate of 1.6–2.1 kcal/min (equivalent to 400–530 mg/min) (31,32). In this study, the estimated glucose emptying rate is similar at about 491 mg/min. In healthy subjects, it normally takes 3–5 h for total stomach emptying after a meal and 90% emptying within 1 h for clear liquids (17). The estimated typical value for duration of glucose gastric emptying after a mixed meal is 85.9 min with 39.7% interpatient variability; this is consistent with clinical observations that variable and accelerated gastric emptying occurs in T1DM patients (38). Furthermore, as indicated previously, gastric emptying of a liquid meal is faster than a solid meal. In our study, this estimated duration is longer than the estimated average time for glucose molecules to be absorbed (34.9 min) after an OGTT (21).
Two major mechanisms of action underline pramlintide effects on postprandial glucose control: glucagon suppression and delayed gastric emptying rate. These well-known actions of pramlintide were incorporated into the final structural model as the drug delaying the duration of exogenous glucose emptying into the intestine as well as inhibiting endogenous glucose production. In this study, each subject served as his own control relative to drug dosing; modeling the placebo and drug effects simultaneously allows possible resolution of the related system and drug-specific parameters.
Amylin and/or pramlintide were shown to potently inhibit gastric emptying in rats and humans and this effect appears to be mediated by neurons in the area postrema (16). With regard to the potency, it was shown that the ED50 of amylin was about 0.42 μg in nondiabetic rats (39), which was 15–20-fold greater than that of glucagon-like peptide-1 and cholecystokinin-8 (39). In human studies, 30–90 μg are typical doses of pramlintide, with a 30-μg SC dose eliciting almost maximal effects (27). This justifies using a maximal stimulatory Smax to describe pramlintide effects on duration of gastric emptying. The estimated stimulatory effect of pramlintide on Tin was about 2–3-fold in this study similar to literature observations (16,27). It is known that pramlintide effects on gastric emptying can be overridden by concomitant hypoglycemia, which is a physiological counter-regulatory effect especially when restoring normal glucose concentrations is needed (16). In this study, the average plasma glucose concentration was about 10 mM (SD = 5.2); thus, the permissive effect of glucose to accelerate gastric emptying might be negligible in this study.
In addition to regulating the rate of gastric emptying after meals, pramlintide complements insulin effects by targeting postprandial glucagon excess, resulting in improved postprandial glucose control in diabetic patients (40). Failure to restore the normal glucagon/insulin ratio in the portal vein may in part contribute to the fact that many insulin-treated patients continue experiencing problems of postprandial hyperglycemia (41). Inappropriately high plasma glucagon concentrations in diabetic patients result in impaired suppression of hepatic glucose output during the postprandial period, which was considered to be an important contributor to postprandial glucose excursions (2). Pramlintide inhibits postprandial glucagon secretion in both type 1 and 2 diabetic patients (2,42). In both rodents and humans, the glucagonostatic effect occurred within the range of normal postprandial amylin concentrations (2,33), suggesting a physiological role of amylin on glucagon regulation. Additionally, it was shown that glucagon concentrations after meals were highly associated with postprandial blood glucose concentrations (43). Further, the effect of amylin to inhibit arginine-stimulated glucagon secretion was very potent (EC50 = 18 pM) with about 70% inhibition in the dose range studied in rats (33). Similarly, pramlintide infusion studies in rats also indicated up to 56% inhibition of glucagon response to arginine with an EC50 about 30.4 pM (4). In type 1 diabetic patients, pramlintide (30 μg SC) has been shown to inhibit overall glucagon concentrations significantly compared to placebo at a normal range of postprandial physiological concentrations (2). Although the effect of pramlintide on glucagon was modeled indirectly as inhibiting endogenous glucose production, the estimated Imax and IC50 are in good accordance with reported literature values (2,4,33), suggesting that this mechanistic PD model adequately described the effect of pramlintide on glucose control during postprandial period. The parameter Imax of 0.995 is very close to 1, indicating the maximum capacity of pramlintide to suppress postprandial glucagon secretion, this is concordant with the clinical observations of blunted increase of plasma glucagon concentrations after pramlintide treatment (2). The parameter IC50 of 23.8 pmol/L indicates the potency of pramlintide in regulation of glucagon secretion. This value is within the normal range of plasma amylin concentrations in healthy humans, indicating physiologic relevance for the effect of pramlintide on glucagon secretion in the postprandial state.
In this study, insulin concentrations were not measured. However, the study was designed to maintain the same meal time insulin doses for each patient on different occasions. It is unlikely that significantly different insulin concentrations would occur and affect either the gastric emptying time or glucagon responses differently. The final model structure provided a suitable framework in which the direct insulin effect could be easily incorporated.
Visual predictive checks (Figs. 2 and 6) in this study revealed that the final PK/PD model appropriately described the drug and postprandial glucose concentrations under different dosing regimens. In the placebo group, the time of insulin dosing was approximately 30 min prior to breakfast, which may not have been kept constant across study occasions. This would generate more noticeable glucose changes. In addition, the decline of plasma glucose below the baseline was observed in some subjects in the placebo group; because of the well-known effects of insulin on glucose disposition, these deviations also inform us of the limitations of the current model, which lacks inclusion of insulin effects. For stratified drug dosing groups, our individual baseline corrected VPC adequately captured the central tendency and variability for most of the groups, except there is a trend of under-prediction in the early phase especially for the 100 μg group. This could result from the simple diagonal variance–covariance structure, small sample size, and/or model complexity. Nevertheless, representative plasma glucose concentration–time profiles (Fig. 5) indicate appropriate individual fittings after either pramlintide or placebo dosing. Other diagnostic plots of individual predicted and observed values did not show any systematic bias (data not shown) and, together with appropriate parameter estimates, confirmed the robustness of the final mechanistic model.
Although the final model describes gastric emptying and captures the pramlintide effects on postprandial glucose concentrations in a manner consistent with physiological and pharmacological principles, the linear glucose emptying rate was a simple approximation of a complex physiological process; it is highly dependent on food type and composition. Studies including more complete measurements of glucagon and insulin responses and comodeling of these two along with glucose concentrations after meals would facilitate improved understanding of the underlying system and drug actions. Future modeling efforts should also focus on the long-term effects of pramlintide. Combination effects with insulin should be examined to provide more insights into drug actions and direct appropriate dosing regimens.
CONCLUSIONS
A mechanistic PK/PD model was developed according to fundamental principles of pramlintide actions and turnover of glucose. The effects of pramlintide on postprandial glucose regulation were fitted well in subjects with T1DM. The estimated parameters are physiologically meaningful and comparable with literature values. As indicated in a recent PKPD modeling review in diabetes (44), there was no previous mechanism-based PK/PD model for pramlintide. This model may be useful in designing and analyzing future clinical studies of other amylinomimetics or drugs with similar mechanisms of action.
ACKNOWLEDGMENTS
This work was supported in part by Amylin Pharmaceutical Inc., the UB-Pfizer Strategic Alliance, and NIH Grant GM 57980. We appreciate the seminal PKPD contributions of the late University of Buffalo alumnus, Dr. Wayne Colburn, who initiated modeling of pramlintide PKPD.
Financial Disclosure
Ms. Cirincione is an employee of Amylin Pharmaceuticals, Inc.
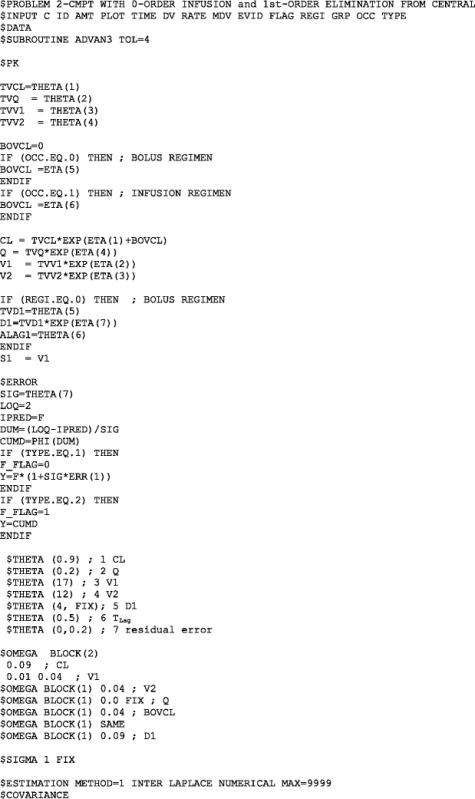
APPENDIX: NONMEM MODEL FILE FOR THE PRAMLINTIDE PK MODEL
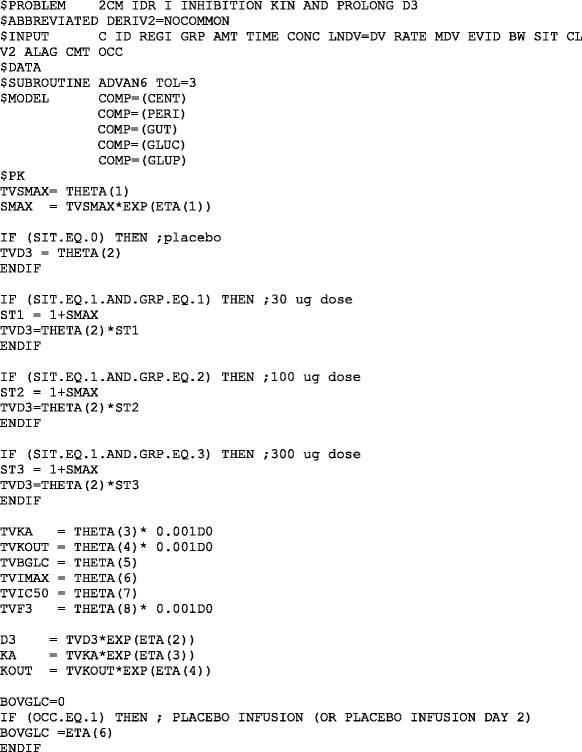
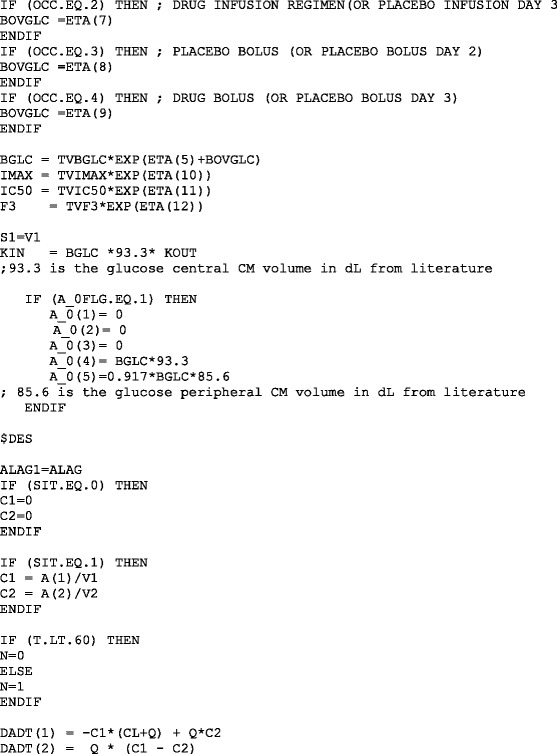
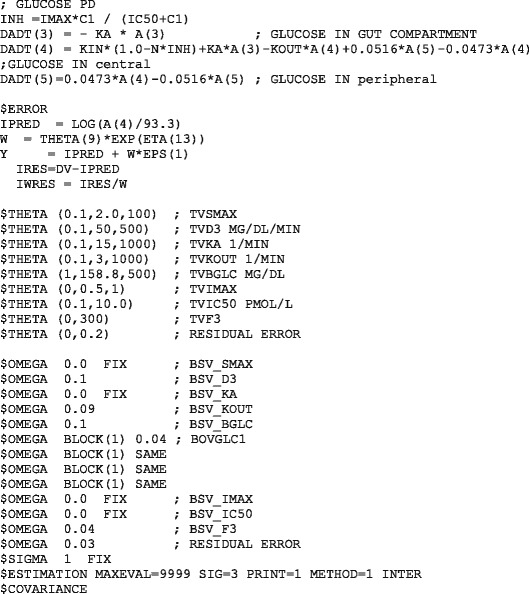
NONMEM MODEL FILE FOR THE PRAMLINTIDE PD MODEL
REFERENCES
- 1.Aronoff SL, Berkowitz K, Shreiner B, Want L. Glucose metabolism and regulation: beyond insulin and glucagon. Diabetes Spectr. 2004;17(3):183–190. doi: 10.2337/diaspect.17.3.183. [DOI] [Google Scholar]
- 2.Fineman MS, Koda JE, Shen LZ, Strobel SA, Maggs DG, Weyer C, et al. The human amylin analog, pramlintide, corrects postprandial hyperglucagonemia in patients with type 1 diabetes. Metab Clin Exp. 2002;51(5):636–641. doi: 10.1053/meta.2002.32022. [DOI] [PubMed] [Google Scholar]
- 3.Gromada J, Franklin I, Wollheim CB. Alpha-cells of the endocrine pancreas: 35 years of research but the enigma remains. Endocr Rev. 2007;28(1):84–116. doi: 10.1210/er.2006-0007. [DOI] [PubMed] [Google Scholar]
- 4.Young A. Inhibition of glucagon secretion. Adv Pharmacol. 2005;52:151–171. doi: 10.1016/S1054-3589(05)52008-8. [DOI] [PubMed] [Google Scholar]
- 5.Evers F, Jeworrek C, Tiemeyer S, Weise K, Sellin D, Paulus M, et al. Elucidating the mechanism of lipid membrane-induced IAPP fibrillogenesis and its inhibition by the red wine compound resveratrol: a synchrotron X-ray reflectivity study. J Am Chem Soc. 2009;131(27):9516–9521. doi: 10.1021/ja8097417. [DOI] [PubMed] [Google Scholar]
- 6.Konarkowska B, Aitken JF, Kistler J, Zhang S, Cooper GJ. The aggregation potential of human amylin determines its cytotoxicity towards islet beta-cells. FEBS J. 2006;273(15):3614–3624. doi: 10.1111/j.1742-4658.2006.05367.x. [DOI] [PubMed] [Google Scholar]
- 7.Green J, Goldsbury C, Mini T, Sunderji S, Frey P, Kistler J, et al. Full-length rat amylin forms fibrils following substitution of single residues from human amylin. J Mol Biol. 2003;326(4):1147–1156. doi: 10.1016/S0022-2836(02)01377-3. [DOI] [PubMed] [Google Scholar]
- 8.McQueen J. Pramlintide acetate. Am J Health Syst Pharm. 2005;62(22):2363–2372. doi: 10.2146/ajhp050341. [DOI] [PubMed] [Google Scholar]
- 9.Edelman SV, Garg S, Kolterman OG. Is pramlintide a safe and effective adjunct therapy for patients with type 1 diabetes? Nat Clin Pract. 2007;3(5):E1. doi: 10.1038/ncpendmet0506. [DOI] [PubMed] [Google Scholar]
- 10.Hoogwerf BJ. Exenatide and pramlintide: new glucose-lowering agents for treating diabetes mellitus. Cleve Clin J Med. 2006;73(5):477–484. doi: 10.3949/ccjm.73.5.477. [DOI] [PubMed] [Google Scholar]
- 11.Chase HP, Lutz K, Pencek R, Zhang B, Porter L. Pramlintide lowered glucose excursions and was well-tolerated in adolescents with type 1 diabetes: results from a randomized, single-blind, placebo-controlled, crossover study. J Pediatr. 2009;155(3):369–373. doi: 10.1016/j.jpeds.2009.03.012. [DOI] [PubMed] [Google Scholar]
- 12.Edelman S, Garg S, Frias J, Maggs D, Wang Y, Zhang B, et al. A double-blind, placebo-controlled trial assessing pramlintide treatment in the setting of intensive insulin therapy in type 1 diabetes. Diabetes Care. 2006;29(10):2189–2195. doi: 10.2337/dc06-0042. [DOI] [PubMed] [Google Scholar]
- 13.Colburn WA, Gottlieb AB, Koda J, Kolterman OG. Pharmacokinetics and pharmacodynamics of AC137 (25,28,29 tripro-amylin, human) after intravenous bolus and infusion doses in patients with insulin-dependent diabetes. J Clin Pharmacol. 1996;36(1):13–24. doi: 10.1002/j.1552-4604.1996.tb04147.x. [DOI] [PubMed] [Google Scholar]
- 14.Byon W, Fletcher CV, Brundage RC. Impact of censoring data below an arbitrary quantification limit on structural model misspecification. J Pharmacokinet Pharmacodyn. 2008;35(1):101–116. doi: 10.1007/s10928-007-9078-9. [DOI] [PubMed] [Google Scholar]
- 15.Beal SL. Ways to fit a PK model with some data below the quantification limit. J Pharmacokinet Pharmacodyn. 2001;28(5):481–504. doi: 10.1023/A:1012299115260. [DOI] [PubMed] [Google Scholar]
- 16.Young A. Inhibition of gastric emptying. Adv Pharmacol. 2005;52:99–121. doi: 10.1016/S1054-3589(05)52006-4. [DOI] [PubMed] [Google Scholar]
- 17.Collins PJ, Horowitz M, Cook DJ, Harding PE, Shearman DJ. Gastric emptying in normal subjects—a reproducible technique using a single scintillation camera and computer system. Gut. 1983;24(12):1117–1125. doi: 10.1136/gut.24.12.1117. [DOI] [PMC free article] [PubMed] [Google Scholar]
- 18.Minami H, McCallum RW. The physiology and pathophysiology of gastric emptying in humans. Gastroenterology. 1984;86(6):1592–1610. [PubMed] [Google Scholar]
- 19.Kong MF, King P, Macdonald IA, Stubbs TA, Perkins AC, Blackshaw PE, et al. Infusion of pramlintide, a human amylin analogue, delays gastric emptying in men with IDDM. Diabetologia. 1997;40(1):82–88. doi: 10.1007/s001250050646. [DOI] [PubMed] [Google Scholar]
- 20.Silber HE, Jauslin PM, Frey N, Gieschke R, Simonsson US, Karlsson MO. An integrated model for glucose and insulin regulation in healthy volunteers and type 2 diabetic patients following intravenous glucose provocations. J Clin Pharmacol. 2007;47(9):1159–1171. doi: 10.1177/0091270007304457. [DOI] [PubMed] [Google Scholar]
- 21.Jauslin PM, Silber HE, Frey N, Gieschke R, Simonsson US, Jorga K, et al. An integrated glucose-insulin model to describe oral glucose tolerance test data in type 2 diabetics. J Clin Pharmacol. 2007;47(10):1244–1255. doi: 10.1177/0091270007302168. [DOI] [PubMed] [Google Scholar]
- 22.Dalla Man C, Camilleri M, Cobelli C. A system model of oral glucose absorption: validation on gold standard data. IEEE Trans Biomed Eng. 2006;53(12):2472–2478. doi: 10.1109/TBME.2006.883792. [DOI] [PubMed] [Google Scholar]
- 23.Dinneen S, Alzaid A, Turk D, Rizza R. Failure of glucagon suppression contributes to postprandial hyperglycaemia in IDDM. Diabetologia. 1995;38(3):337–343. doi: 10.1007/BF00400639. [DOI] [PubMed] [Google Scholar]
- 24.Bea SB, Broeckmann AJ, Sheiner LB, Group NP. NONMEM users guides. San Francisco, CA: University of California; 2007.
- 25.Karlsson MO, Jonsson EN, Wiltse CG, Wade JR. Assumption testing in population pharmacokinetic models: illustrated with an analysis of moxonidine data from congestive heart failure patients. J Pharmacokinet Biopharm. 1998;26(2):207–246. doi: 10.1023/a:1020561807903. [DOI] [PubMed] [Google Scholar]
- 26.Bergstrand M, Hooker AC, Wallin JE, Karlsson MO. Prediction-corrected visual predictive checks for diagnosing nonlinear mixed-effects models. AAPS J. 2011;13(2):143–151. doi: 10.1208/s12248-011-9255-z. [DOI] [PMC free article] [PubMed] [Google Scholar]
- 27.Kong MF, Stubbs TA, King P, Macdonald IA, Lambourne JE, Blackshaw PE, et al. The effect of single doses of pramlintide on gastric emptying of two meals in men with IDDM. Diabetologia. 1998;41(5):577–583. doi: 10.1007/s001250050949. [DOI] [PubMed] [Google Scholar]
- 28.Lima JJ, Matsushima N, Kissoon N, Wang J, Sylvester JE, Jusko WJ. Modeling the metabolic effects of terbutaline in beta2-adrenergic receptor diplotypes. Clin Pharmacol Ther. 2004;76(1):27–37. doi: 10.1016/j.clpt.2004.03.006. [DOI] [PubMed] [Google Scholar]
- 29.Lee SH, Kwon KI. Pharmacokinetic-pharmacodynamic modeling for the relationship between glucose-lowering effect and plasma concentration of metformin in volunteers. Arch Pharm Res. 2004;27(7):806–810. doi: 10.1007/BF02980152. [DOI] [PubMed] [Google Scholar]
- 30.Gumbhir-Shah K, Kellerman DJ, DeGraw S, Koch P, Jusko WJ. Pharmacokinetics and pharmacodynamics of cumulative single doses of inhaled salbutamol enantiomers in asthmatic subjects. Pulm Pharmacol Ther. 1999;12(6):353–362. doi: 10.1006/pupt.1999.0217. [DOI] [PubMed] [Google Scholar]
- 31.Brener W, Hendrix TR, McHugh PR. Regulation of the gastric emptying of glucose. Gastroenterology. 1983;85(1):76–82. [PubMed] [Google Scholar]
- 32.Horowitz M, Edelbroek MA, Wishart JM, Straathof JW. Relationship between oral glucose tolerance and gastric emptying in normal healthy subjects. Diabetologia. 1993;36(9):857–862. doi: 10.1007/BF00400362. [DOI] [PubMed] [Google Scholar]
- 33.Gedulin BR, Rink TJ, Young AA. Dose–response for glucagonostatic effect of amylin in rats. Metab Clin Exp. 1997;46(1):67–70. doi: 10.1016/S0026-0495(97)90170-0. [DOI] [PubMed] [Google Scholar]
- 34.Schvarcz E, Palmer M, Aman J, Horowitz M, Stridsberg M, Berne C. Physiological hyperglycemia slows gastric emptying in normal subjects and patients with insulin-dependent diabetes mellitus. Gastroenterology. 1997;113(1):60–66. doi: 10.1016/S0016-5085(97)70080-5. [DOI] [PubMed] [Google Scholar]
- 35.Ludvik B, Kautzky-Willer A, Prager R, Thomaseth K, Pacini G. Amylin: history and overview. Diabet Med. 1997;14(Suppl 2):S9–S13. doi: 10.1002/(SICI)1096-9136(199706)14:2+<S9::AID-DIA397>3.3.CO;2-4. [DOI] [PubMed] [Google Scholar]
- 36.Singh-Franco D, Robles G, Gazze D. Pramlintide acetate injection for the treatment of type 1 and type 2 diabetes mellitus. Clin Ther. 2007;29(4):535–562. doi: 10.1016/j.clinthera.2007.04.005. [DOI] [PubMed] [Google Scholar]
- 37.Landersdorfer CB, He YL, Jusko WJ. Mechanism-based population modelling of the effects of vildagliptin on GLP-1, glucose and insulin in patients with type 2 diabetes. Br J Clin Pharmacol. 2012;73(3):373–390. doi: 10.1111/j.1365-2125.2011.04109.x. [DOI] [PMC free article] [PubMed] [Google Scholar]
- 38.Nowak TV, Johnson CP, Kalbfleisch JH, Roza AM, Wood CM, Weisbruch JP, et al. Highly variable gastric emptying in patients with insulin dependent diabetes mellitus. Gut. 1995;37(1):23–29. doi: 10.1136/gut.37.1.23. [DOI] [PMC free article] [PubMed] [Google Scholar]
- 39.Young AA, Gedulin BR, Rink TJ. Dose-responses for the slowing of gastric emptying in a rodent model by glucagon-like peptide (7–36) NH2, amylin, cholecystokinin, and other possible regulators of nutrient uptake. Metab Clin Exp. 1996;45(1):1–3. doi: 10.1016/S0026-0495(96)90192-4. [DOI] [PubMed] [Google Scholar]
- 40.Ryan GJ, Jobe LJ, Martin R. Pramlintide in the treatment of type 1 and type 2 diabetes mellitus. Clin Ther. 2005;27(10):1500–1512. doi: 10.1016/j.clinthera.2005.10.009. [DOI] [PubMed] [Google Scholar]
- 41.Buse JB, Weyer C, Maggs DG. Amylin replacement with pramlintide in type 1 and type 2 diabetes: a physiological approach to overcome barriers with insulin therapy. Clin Diabetes. 2002;20(3):137–144. doi: 10.2337/diaclin.20.3.137. [DOI] [Google Scholar]
- 42.Fineman M, Weyer C, Maggs DG, Strobel S, Kolterman OG. The human amylin analog, pramlintide, reduces postprandial hyperglucagonemia in patients with type 2 diabetes mellitus. Horm Metab Res Hormon- und Stoffwechselforschung. 2002;34(9):504–508. doi: 10.1055/s-2002-34790. [DOI] [PubMed] [Google Scholar]
- 43.Porksen S, Nielsen LB, Kaas A, Kocova M, Chiarelli F, Orskov C, et al. Meal-stimulated glucagon release is associated with postprandial blood glucose level and does not interfere with glycemic control in children and adolescents with new-onset type 1 diabetes. J Clin Endocrinol Metab. 2007;92(8):2910–2916. doi: 10.1210/jc.2007-0244. [DOI] [PubMed] [Google Scholar]
- 44.Landersdorfer CB, Jusko WJ. Pharmacokinetic/pharmacodynamic modelling in diabetes mellitus. Clin Pharmacokinet. 2008;47(7):417–448. doi: 10.2165/00003088-200847070-00001. [DOI] [PubMed] [Google Scholar]


