

Abstract
The objective of the present study was to evaluate mechanistic pharmacokinetic models describing active renal secretion and reabsorption over a range of Michaelis–Menten parameter estimates and doses. Plasma concentration and urinary excretion profiles were simulated and renal clearance (CLr) was calculated for two pharmacokinetic models describing active renal reabsorption (R1/R2), two models describing active secretion (S1/S2), and a model containing both processes. A range of doses (1–1,000 mg/kg) was evaluated, and Vmax and Km parameter estimates were varied over a 100-fold range. Similar CLr values were predicted for reabsorption models (R1/R2) with variations in Vmax and Km. Tubular secretion models (S1/S2) yielded similar relationships between Michaelis–Menten parameter perturbations and CLr, but the predicted CLr values were threefold higher for model S1. For both reabsorption and secretion models, the greatest changes in CLr were observed with perturbations in Vmax, suggesting the need for an accurate estimate of this parameter. When intrinsic clearance was substituted for Michaelis–Menten parameters, it failed to predict similar CLr values even within the linear range. For models S1 and S2, renal secretion was predominant at low doses, whereas renal clearance was driven by fraction unbound in plasma at high doses. Simulations demonstrated the importance of Michaelis–Menten parameter estimates (especially Vmax) for determining CLr. Km estimates can easily be obtained directly from in vitro studies. However, additional scaling of in vitro Vmax estimates using in vitro/in vivo extrapolation methods are required to incorporate these parameters into pharmacokinetic models.
Electronic supplementary material
The online version of this article (doi:10.1208/s12248-012-9437-3) contains supplementary material, which is available to authorized users.
KEY WORDS: kidney transport parameters, models, reabsorption, renal clearance, secretion
INTRODUCTION
The kidney represents a major clearance organ within the body and is involved in the elimination of therapeutic agents, toxins, and endogenous metabolites. Renal excretion involves four distinct processes: (1) glomerular filtration; (2) active tubular secretion; (3) active reabsorption; and (4) passive reabsorption. The extent to which a compound is filtered at the glomerulus is dependent on the molecular size and protein binding. Active tubular secretion and reabsorption are transporter-mediated processes typically occurring within the proximal tubule of the kidney. The involvement of active transport processes will be dependent on the compound’s affinity for the wide range of transporters expressed in the kidney and, as such, has the potential to lead to drug–drug interactions. Passive reabsorption is a nonsaturable process that occurs along a concentration gradient and is dependent on the lipid solubility and pKa of the compound and the pH and flow rate of urine. While not all of these processes are involved in the renal clearance of every compound, it is important to understand the interaction between these processes to allow for predictions of renal clearance.
Active renal reabsorption and tubular secretion occur in the proximal tubules of the kidney and are mediated by a number of specific anion and cation transporters expressed at the apical and basolateral membranes of proximal tubular cells. Nutrient and peptide transporters (e.g., MCTs, SMCTs, PEPT1, SGLT2) (1–4) are involved in the active reabsorption of endogenous compounds; however, these transporters may also be involved in the transport of therapeutic agents, such as γ-hydroxybutyric acid and β-lactam antibiotics (3,5). Transporters involved in tubular secretion (e.g., OAT1/3, OCT2, OCTNs, MATE1) eliminate endogenous waste products and therapeutic agents (6–11). These transporters exhibit broad substrate specificity and may have a high capacity for transport of therapeutic agents.
Various approaches have been used in the literature to predict pharmacokinetic profiles from in vitro data, including allometry and in vitro/in vivo extrapolation (IVIVE). While both simple and modified allometric methods can accurately predict renal clearance involving glomerular filtration and passive reabsorption, these methods fail to accurately predict renal clearance when active transport processes are involved (12,13). Physiologically based IVIVE predictions have been successfully applied to the prediction of metabolic and biliary clearance and active tubular secretion (14,15); however, they have not been applied for the prediction of active renal reabsorption. In vitro studies in kidney cell lines or in cell lines overexpressing a specific transporter can be used to generate kinetic data and Michaelis–Menten parameter estimates. The transport kinetic parameters (Km and Vmax) can be combined with transporter expression data and incorporated into a mechanistic pharmacokinetic model of renal clearance for both tubular secretion and reabsorption to provide a priori predictions of the renal clearance of a compound and the potential for drug–drug interactions and toxicity.
In our evaluation, we used four published mechanistic models with varying degrees of complexity describing active renal reabsorption (16,17) and active renal secretion (18,19). These mechanistic models include specific transport kinetic parameters that are driven by a physiologically relevant drug concentration (plasma/blood or tubular lumen) as opposed to evaluating renal clearance as a singular parameter. Both compartmental and more physiologically based models of active tubular secretion and reabsorption have been utilized in the literature. Two additional models of renal reabsorption have been described in the literature (20,21); however, one model has limited applicability as it treats urine as a distribution compartment and the other utilizes plasma drug concentrations to drive renal reabsorption. Therefore, these models were excluded from the present analysis. In contrast to the compartmental models, the models developed for γ-hydroxybutyric acid and phenolsulfonphthalein (PSP) incorporate system-specific parameters, including renal blood flow, glomerular filtration rate (GFR), and urine flow which can be fixed (17). A mechanistic model for passive renal reabsorption has been described in the literature (22); however, it was not evaluated in the present study. All of these models were developed for single chemical entities and their broader applicability in assessing the contribution of active renal secretion and reabsorption to the pharmacokinetics of additional compounds has yet to be evaluated over a range of parameter estimates. The development of a universally applicable mechanistic model is desirable to evaluate renal clearance across a range of compounds that are substrates for secretory or reabsorption transporters. In such a model, physiological system-specific parameters can be fixed, while drug-specific parameters can be incorporated, and therefore, the model could be utilized to make a priori predictions of renal clearance based on in vitro transporter kinetic parameters through IVIVE methodologies. The objective of the present study was to evaluate and compare previously published mechanistic pharmacokinetic models of active tubular secretion and reabsorption and to combine the models to determine a universal model to describe these processes. The models were evaluated over a range of Michaelis–Menten parameter estimates and doses to determine their impact on model outputs (plasma concentration and urinary excretion) and calculated pharmacokinetic parameters (renal clearance). Furthermore, effects of changes in fraction unbound in plasma (fu,p) on renal clearance for secretion models were also evaluated over the range of doses and Michaelis–Menten parameter estimates.
METHODS
Structural Models
Four structural models of active renal reabsorption and tubular secretion (Fig. 1) were selected for analysis based on the available models within the literature (16–19). The differential equations for the structural models are listed in the supplemental data. Model R1 includes renal tubule and urine compartments separated by urine flow with active reabsorption from the renal tubules (16). Model R2 represents a more physiological model of the kidney with renal blood flow, glomerular filtration from the kidney compartment, proximal and distal tubule compartments, and a urine compartment (17). Model S1 is a one-compartment model with linear and saturable clearance processes described by glomerular filtration and active tubular secretion, as well as linear nonrenal clearance (18). Model S2 is a mechanistic semiphysiological model, incorporating renal blood flow from the central compartment to the kidneys. Drug enters the tubular lumen by glomerular filtration and the remaining drug is available for active secretion into the tubular cells with subsequent excretion into the lumen (19). Model S2 was extended to include active renal reabsorption from the tubular lumen to evaluate whether both process could be evaluated using the semiphysiological structural model. The secretion and reabsorption components of this model can be utilized depending on the specific compound being assessed. One basic assumption of all models evaluated is the compartmental drug concentration, the concentration that is present at the transporter and is available for transport. Although any input model could be employed, only intravenous bolus administration will be considered in the present study. In addition, distributional models were not considered to simplify the analysis. Compartmental or physiologically based distributional models could be combined with the renal clearance models.
Fig. 1.

Structural models (a R1, b R2, c S1, and d S2) describing active renal reabsorption and secretion. Detailed descriptions for the parameters are listed in Table I
Simulation Studies
Simulations of plasma concentrations and urinary excretion were conducted in Phoenix WinNonLin version 6.1 (Pharsight Corp., Mountain View, CA, USA) using the structural models detailed in the previous section. Profiles for active reabsorption models were simulated for 24 h and secretion models were simulated for 8 h to ensure the total amount of drug excreted in urine (Ae,inf) was obtained. Drug was administered as an intravenous bolus of 1–1,000 mg/kg (R1/R2, combined model) or 1–500 mg/kg (S1/S2). Nonrenal clearance (CLnr) was fixed at 1 ml/min/kg for all models, so renal clearance was the primary elimination pathway. Vmax and Km values were varied over a 100-fold range to determine their impact on model outputs. Reabsorption model parameters are listed in Table I and are based on previous assessments of the active renal reabsorption of γ-hydroxybutyric acid in rats which is known to exhibit nonlinear renal clearance caused by saturation of active reabsorption. For the reabsorption models: Km was fixed at 0.5 mg/ml and Vmax was varied from 1 to 100 mg/min/kg; Vmax was fixed at 10 mg/min/kg and Km was varied from 0.05 to 5 mg/ml. Secretion model parameters (Table I) are based on PSP in rats (19,23). The physiological parameters were scaled to rat from dog values listed in Russel et al. (19) and the first-order transfer rate of the drug from tubular cells to lumen was fixed to the dog value. The effect of changes in fu,p (from 0.01 to 1) of PSP on renal clearance (CLr) was evaluated for models S1 and S2. For the secretion models: Km was fixed at 0.01 mg/ml and Vmax was varied from 0.025 to 2.5 mg/min/kg; Vmax was fixed at 0.5 mg/min/kg and Km was varied from 0.001 to 0.1 mg/kg. In addition, simulations were conducted using intrinsic transport clearance (Clint) for all models. For reabsorption, Clint was varied from 2 to 200 ml/min/kg, and for secretion, Clint was varied from 5 to 500 ml/min/kg. These values correspond to the ranges of Clint obtained from the Vmax and Km values used.
Table I.
Nominal Pharmacokinetic Parameter Values for Renal Reabsorption and Tubular Secretion Models in Rats
| Parameter (units) | Description | Value | Applicable model(s) |
|---|---|---|---|
| GFR (ml/min/kg) | Glomerular filtration rate | 10 | R1, R2, S1, S2 |
| Q R (ml/min/kg) | Renal blood flow | 41 | R1, R2, S2 |
| UF (ml/min/kg) | Urine flow | 0.3 | R1, R2, S2 |
| V c (ml/kg)a | Volume of the central compartment | 312 | R1 |
| V c (ml/kg) | Volume of the central compartment | 298.7 | R2 |
| V t (ml/kg)b | Volume of the renal tubules | 13.3 | R1 |
| V pt (ml/kg)c | Volume of the proximal tubule | 10 | R2 |
| V dt (ml/kg)c | Volume of the distal tubule | 3.3 | R2 |
| V k (mg/kg) | Volume of kidney blood | 13.3 | R2 |
| V c (ml/kg) | Volume of central compartment | 300 | S1, S2 |
| V rp (ml/kg) | Volume of renal plasma | 6.5 | S2 |
| V tu (ml/kg) | Volume of tubular urine | 0.45 | S2 |
| V tc (ml/kg)d | Volume of tubular cells | 19.6 | S2 |
| K t (/min) | First-order rate of transfer | 0.17 | S2 |
Parameter estimates are based on previous assessments of the renal reabsorption of γ-hydroxybutyric acid (17) (for models R1 and R2) and of the active secretion of PSP and physiological parameters were scaled to rat from dog (19) (for models S1 and S2)
aVolume of the central compartment for model R1 was obtained by adding the V c and V k for model R2
bVolume of the renal tubules for model R1 was obtained by adding the proximal and distal tubule volumes for model R2
cLuminal volume of the proximal and distal tubules
dIntracellular volume of renal tubular cells
Data Analysis
Area under the plasma concentration time curve (AUC) was calculated in Pheonix WinNonLin using the linear trapezoidal rule. Renal clearance (CLr) was calculated by Ae,inf divided by AUC. Data were plotted in Sigma Plot version 11 (Systat Software Inc, San Jose, CA, USA).
RESULTS
Active Tubular Reabsorption Models
Model R1 (Fig. 1a) represents a compartmental model and model R2 (Fig. 1b) represents a semiphysiological model for evaluating the impact of transporter-mediated renal reabsorption on overall renal clearance. The impact of dose and Michaelis–Menten parameter estimates for both models are presented in Fig. 2. The expectation for these reabsorption models is that renal clearance will increase with increasing dose as reabsorption becomes saturated and a greater amount of drug is excreted in urine. In addition, a high capacity for transport should result in no renal clearance as the drug is completely reabsorbed. Renal clearance demonstrated similar predicted values with variation in dose and Km or Vmax for both reabsorption models (Fig. 2a, b). Renal clearance increased with increasing dose consistent with saturation of renal reabsorption. The greatest change in renal clearance was observed with perturbations in Vmax, suggesting that this parameter is critically important for determining renal excretion. Increases in Vmax resulted in decreases in renal clearance, with high Vmax values leading to complete reabsorption of the drug (Fig. 2a). In addition, decreased affinity (high Km value) led to increased renal clearance as drug concentrations in the tubular lumen fell below the Km value (Fig. 2b). For all parameter perturbations, changes in renal clearance resulted in changes in the total amount of drug excreted in the urine with increased renal clearance resulting in an increased amount of drug excreted in urine (data not shown). Due to the observed nonlinear renal reabsorption and, therefore, renal clearance, there is a shift in the fraction eliminated by renal and nonrenal pathways. When Vmax is high, all drug is reabsorbed from the lumen; therefore, nonrenal clearance becomes the predominant elimination pathway. These results are consistent with observed data for changes in γ-hydroxybutyric acid renal clearance and total amount excreted in the urine when transporter-mediated reabsorption is inhibited in a competitive manner (increase in apparent Km) (17); additionally, the estimated in vivo Km for γ-hydroxybutyric acid (0.46 mg/ml) (17) is close to the determined in vitro Km (0.48 mg/ml) (24).
Fig. 2.

Mesh plots evaluating the relationship between renal clearance (CLr), dose, and Michaelis–Menten parameters estimates (V max and K m) or intrinsic reabsorption clearance (Clint) for active renal reabsorption models (R1 and R2). a V max was varied from 1 to 100 mg/min/kg, while K m was fixed at 0.5 mg/ml. b K m was varied from 0.05 to 5 mg/ml, while V max was fixed at 10 mg/min/kg. c Clint was varied from 2 to 200 ml/min/kg which covers that same range as the Clint calculated from V max and K m estimates. The color gradient ranges from blue (CLr equal to 0) to red (maximal CLr indicated by the y-axis)
In contrast, when Clint was substituted for Km and Vmax in both models, the observed changes in renal clearance did not correspond to those obtained when Km and Vmax were used (Fig. 2c), even with low doses in the expected linear range. When Clint was perturbed, no dose-dependent changes in renal clearance were observed. When Clint was high, similar predictions were obtained (compared to Vmax simulations) with complete reabsorption and CLr of 0. Clint cannot be utilized to describe nonlinear processes and, therefore, should not be utilized in structural models of active renal reabsorption. Based on the simulation results, either model could be utilized for the prediction of renal reabsorption from in vitro transporter kinetic data; however, it is more advantageous to use the physiologically based model (R2) as system-specific parameters can be fixed and in vitro estimates of drug-specific properties (such as transport kinetic parameters) can be integrated for a range of species.
Active Tubular Secretion Models
Model S1 (Fig. 1c) represents the most simplistic mechanistic model of active secretion with glomerular filtration and active secretion from the central compartment (18). Model S2 (Fig. 1d) (19) is a semiphysiological mechanistic model similar in structure to model R2, with compartments representing the tubular lumen and proximal tubule cells connected by blood and urine flows. The impact of dose and Michaelis–Menten parameter estimates for both models are presented in Fig. 3. The basic assumption for these models is that renal clearance will always be greater than GFR × fu,p in the absence of passive reabsorption and that saturation of secretion will result in decreasing renal clearance. While the shape of the mesh plots when dose and Michaelis–Menten parameter estimates were perturbed is similar, the predicted renal clearance values are threefold higher for model S1 (Fig. 3). These higher predictions are consistent with the structure of the model, with a higher concentration of drug (central compartment concentration) available for secretion, while in model S2, only drug that is not filtered at the glomerulus is available for secretion. As such, Km estimates from model S1 likely would not correlate with Km estimates obtained in vitro. In contrast to the reabsorption models, only minor dose-dependent effects on renal clearance were observed under these simulation conditions. However, alterations in filtration clearance due to protein binding may cause this relationship to be altered and the minimum renal clearance value will be reduced. At higher doses, renal clearance decreased to approximately GFR as a result of saturation of active secretion. Increasing Vmax had the greatest impact on renal clearance when a low dose was administered (Fig. 3a). Km only influenced predicted renal clearance at low doses and low Km (Fig. 3b) values. As Km or dose increased, renal clearance decreased to approximately GFR. For all Michaelis–Menten parameter perturbations, no changes were observed in the total amount of drug excreted in the urine. The predicted total amount of drug excreted in the urine was dependent on dose, which is consistent with basic pharmacokinetic concepts. When Clint was substituted for the Michaelis–Menten parameter estimates, the predicted renal clearance was not dose-dependent and increased to the same maximal renal clearance for all doses (Fig. 3c). Utilizing this single parameter does not allow for the evaluation of nonlinear renal clearance resulting from transporter saturation and should not be incorporated into structural models of active secretion.
Fig. 3.
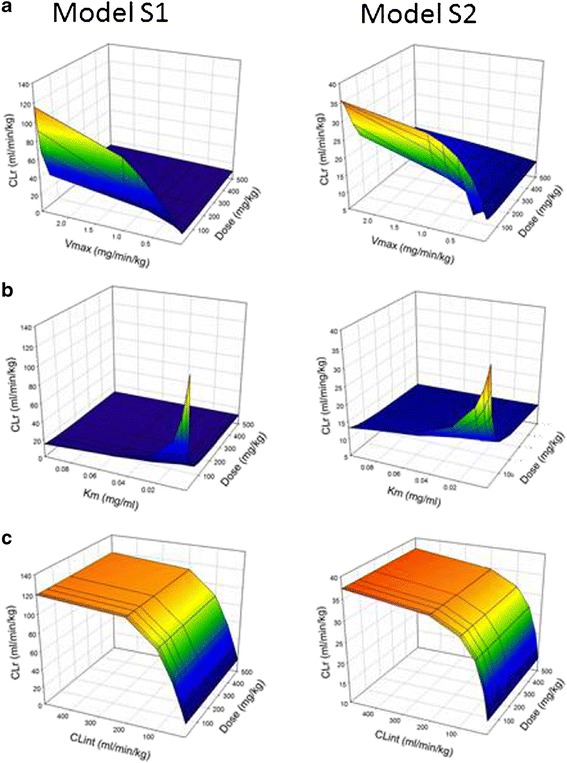
Mesh plots evaluating the relationship between renal clearance (CLr), dose, and Michaelis–Menten parameters estimates (V max and K m) or intrinsic secretion clearance (Clint) for active tubular secretion models (S1 and S2). a V max was varied from 0.025 to 2.5 mg/min/kg, while K m was fixed at 0.01 mg/ml. b K m was varied from 0.001 to 0.1 mg/ml, while V max was fixed at 0.5 mg/min/kg. c Clint was varied from 5 to 500 ml/min/kg which covers that same range as the Clint calculated from V max and K m estimates. The color gradient ranges from blue (CLr equal to GFR) to red (maximal CLr indicated by the y-axis)
When protein binding was considered, CLr increased as the value of fraction unbound of PSP in plasma was increased for models S1 and S2 (Figs. 4 and 5). For all doses, perturbations in Vmax estimates (Fig. 4) had a greater impact on predicted values of CLr compared with perturbation in Km estimates (Fig. 5), as described previously. At the lowest dose (1 mg/kg) evaluated (Figs. 4a and 5a), the contribution of renal secretion to total renal clearance was greater than that of GFR × fu,p; however, as the dose was increased to 500 mg/kg (Figs. 4c and 5c), GFR × fu,p became the predominant determinant of CLr. Changes in the values of the Michaelis–Menten parameter estimates (Vmax and Km) lead to substantial increases in the predicted CLr values at low doses, while at high doses, perturbations did not impact overall renal clearance. At high doses, renal secretion is saturated (renal concentrations ⋙ Km) and CLr is determined by GFR × fu,p. At the low dose, model S1 predicted greater values of renal clearance compared with model S2, which was expected due to the structure of the two models. However, at the high dose, both models performed similarly, which indicated saturation of renal secretion. This observation can be attributed to ongoing glomerular filtration, which contributes predominantly to the renal clearance as renal secretion is saturated. Based on these results, model S2 is the more appropriate model for the prediction of renal secretion using physiological parameters and scaled in vitro transport kinetic data.
Fig. 4.

Mesh plots evaluating the relationship between renal clearance (CLr), f u,p, and V max for models S1 and S2, where V max was varied from 0.025 to 2.5 mg/min/kg, f u,p was varied from 0.01 to 1, and K m was fixed at 0.01 mg/ml. a 1 mg/kg dose, b 100 mg/kg dose, and c 500 mg/kg dose. The color gradient ranges from blue (CLr equal to GFR × f u,p) to red (maximal CLr indicated by the y-axis)
Fig. 5.

Mesh plots evaluating the relationship between renal clearance (CLr), f u,p, and K m for models S1 and S2, where K m was varied from 0.001 to 0.1 mg/ml, f u,p was varied from 0.01 to 1, and V max was fixed at 0.5 mg/min/kg. a 1 mg/kg dose, b 100 mg/kg dose, and c 500 mg/kg dose. The color gradient ranges from blue (CLr equal to GFR × f u,p) to red (maximal CLr indicated by the y-axis)
Combined Model
Model S2 was extended to include active renal reabsorption with saturable absorption from the tubular lumen into tubular cells, followed by secretion into the renal plasma compartment. A rapid first-order rate constant was utilized for secretion into the renal plasma compartment, so reabsorption from the lumen was the rate-limiting step. To evaluate a compound only undergoing reabsorption, the secretion parameters in the model were turned off. The model predictions following perturbations in dose and Michaelis–Menten parameter estimates are detailed in Fig. 6. Consistent with the results obtained using models R1 and R2, renal clearance increased with increasing dose at low Vmax values and high Vmax values resulted in renal clearance decreasing to 0 (Fig. 6a). A similar relationship was also observed for changes in Km between the models R1/R2 and the combined model (Fig. 6b). These results suggest that the combined model could be used to predict renal clearance for compounds undergoing both active secretion, reabsorption, and both processes.
Fig. 6.
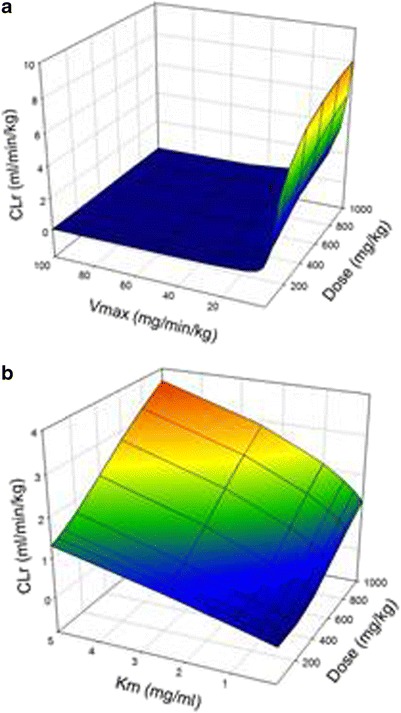
Mesh plots evaluating the relationship between renal clearance (CLr), dose, and Michaelis–Menten parameter estimates (V max and K m) for model S2 with reabsorption parameters added. For these scenarios, the secretion parameters were turned off. a Reabsorption V max was varied from 1 to 100 mg/min/kg, while K m was fixed at 0.5 mg/ml. b Reabsorption K m was varied from 0.05 to 5 mg/ml, while V max was fixed at 10 mg/min/kg. The color gradient ranges from blue (CLr equal to 0) to red (maximal CLr indicated by the y-axis)
DISCUSSION
Renal excretion is a major elimination pathway involved in the removal of a number of therapeutic agents from the body. Active renal reabsorption and tubular secretion are major processes determining the overall renal clearance of a compound; however, few mechanistic pharmacokinetic models have been developed to quantitatively describe these processes. Development of mechanistic models to describe active transport processes will allow for a priori predictions of renal clearance based on IVIVE of transport kinetic parameters, as well as predictions of the potential for clinically significant drug–drug interactions. The present study is the first comparative analysis of published models of active renal reabsorption and tubular secretion aimed at determining the drug-specific parameters required to accurately predict renal clearance. Based on the results of the present study, physiologically based models incorporating both active reabsorption and secretion well described renal clearance. In addition, these models require only a few drug-specific kinetic parameters that can be obtain from in vitro studies, while the remaining system-specific parameters can be fixed to literature values. The present study evaluated a wide range of doses and transporter kinetic parameters; however, future studies are required to validate the combined model using pharmacokinetic data from a number of compounds with different extents of active renal reabsorption and tubular secretion, as well as in vitro transport kinetic parameter estimates.
In the present study, perturbations in both Km and Vmax resulted in changes in renal clearance determined in both secretion and reabsorption models; however, the greatest changes were observed with alterations in Vmax (Figs. 2a, 3a, 4, and 6a). Changes in renal clearance were also observed when an intrinsic secretion or reabsorption clearance term was used, but they did not correspond to the predictions obtained with the individual Michaelis–Menten parameters even within the linear range of transport. This suggests that use of intrinsic clearance to predict active renal reabsorption and tubular secretion may result in mispredictions as the extent of reabsorption/secretion is highly dependent on the capacity for drug transport. Furthermore, these findings suggest that good initial estimates of the Michaelis–Menten parameters are needed to accurately predict a drug’s renal clearance. The Michaelis–Menten parameters for renal transport can be estimated based on in vitro or in vivo data. Both Km and Vmax parameters may be estimated from in vitro cell uptake studies. While Km values can be translated directly to an in vivo model, Vmax estimates may not be accurate in renal cell lines or transfected cells lines as they are dependent on the relationship between protein expression of the transporter in the cell line and kidney tissue. As such, IVIVE scalars relating protein or mRNA expression between in vitro and in vivo systems are necessary to determine accurate scalars for Vmax (25). Ideally, the generation of IVIVE scalars can be achieved by determining the absolute or relative transporter expression through quantification of protein expression in cell lines and kidney samples; however, information regarding protein expression in rat and human kidney samples is lacking (26,27). In order to improve predictions, an understanding of the population variability in expression is necessary, requiring the quantitative analysis of a large pool of human kidney samples, with concurrent analysis of cell culture samples from which in vitro kinetic parameters have been generated. Analysis of mRNA expression could also be used to determine scalars that are specific to the laboratory in which they were generated. Currently, mRNA transporter expression data is only available in rodent kidney; there is not sufficient literature data to obtain these scalars for renal drug transport. An additional hurdle is the interlaboratory variability in cell lines and tissues utilized necessitating the generation of laboratory-specific scalars. Vmax estimates may also be influenced by the existence of polymorphic variants of individual transporters (28,29) and, therefore, will be important to characterize the variants present in tissue and cell lines.
The effects of changes in fraction unbound in plasma on renal clearance for secretion models over the range of doses and Michaelis–Menten parameter estimates were also evaluated. At low doses (Figs. 4a and 5a), renal clearance was determined by changes in Vmax and Km, and at high doses, renal clearance was dependent on GFR × fu,p. These relationships confirm the need to incorporate in vitro or in vivo estimates of fu,p especially when doses and, therefore, drug concentrations greatly exceed the Km for renal secretion.
One limitation of the present models is that they exclusively consider glomerular filtration and active reabsorption and tubular secretion. The combined model incorporating active reabsorption and secretion can be further expanded to include additional factors influencing renal clearance including passive reabsorption. System-specific parameters, such GFR and urine and blood flow, may be altered to reflect changes that occur in various disease states or with drug treatment, therefore determining their impact on renal clearance and other model outputs. Additional drug-specific parameters can also be incorporated. A large number of drugs undergo passive reabsorption or have a combination of many of these processes contributing to their observed urinary excretion profiles and total renal clearance. Passive reabsorption may be predicted based on the physicochemical properties of a compound (30). Additionally, physiologically based pharmacokinetic models of passive reabsorption have been proposed in the literature (22,31). The influence of a compounds’ ionization state within the tubular lumen could also be incorporated with total drug available for active reabsorption and unionized drug available for passive reabsorption. These factors could be added to the combined physiological model presented here to establish a universal mechanistic model of renal clearance that would be widely applicable for the prediction of total renal clearance and the potential for drug–drug interactions. These models should be further evaluated with respect to the dependence on physiological factors, such as renal plasma flow, pH dependence, and the expression of specific drug transporters in the kidney.
CONCLUSIONS
In the present study, we evaluated four mechanistic pharmacokinetic models describing active renal reabsorption or tubular secretion and a model incorporating both processes. Simulations demonstrated the importance of Michaelis–Menten parameters, especially Vmax, for the prediction of renal clearance, while the incorporation of Clint resulted in underestimation of renal clearance under the conditions evaluated. The applicability of the combined model should be validated using a range of compounds with variable transport. In vitro studies should be conducted with compounds which undergo only secretion or reabsorption to enable estimation of Michaelis–Menten parameters for active reabsorption and tubular secretion. Furthermore, in vitro transport studies and evaluations of transporter expression should be undertaken to allow for a priori predictions of renal clearance for a range of compounds.
Electronic Supplementary Materials
Below is the link to the electronic supplementary material.
(DOCX 36.3 kb)
ACKNOWLEDGMENTS
This study was supported in part by NIH grant DA-023223 and Roche Inc.
REFERENCES
- 1.Ganapathy V, Thangaraju M, Gopal E, Martin PM, Itagaki S, Miyauchi S, et al. Sodium-coupled monocarboxylate transporters in normal tissues and in cancer. AAPS J. 2008;10(1):193–199. doi: 10.1208/s12248-008-9022-y. [DOI] [PMC free article] [PubMed] [Google Scholar]
- 2.Leibach FH, Ganapathy V. Peptide transporters in the intestine and the kidney. Annu Rev Nutr. 1996;16:99–119. doi: 10.1146/annurev.nu.16.070196.000531. [DOI] [PubMed] [Google Scholar]
- 3.Morris ME, Felmlee MA. Overview of the proton-coupled MCT (SLC16A) family of transporters: characterization, function and role in the transport of the drug of abuse gamma-hydroxybutyric acid. AAPS J. 2008;10(2):311–321. doi: 10.1208/s12248-008-9035-6. [DOI] [PMC free article] [PubMed] [Google Scholar]
- 4.Launay-Vacher V, Izzedine H, Karie S, Hulot JS, Baumelou A, Deray G. Renal tubular drug transporters. Nephron Physiol. 2006;103(3):97–106. doi: 10.1159/000092212. [DOI] [PubMed] [Google Scholar]
- 5.Inui KI, Masuda S, Saito H. Cellular and molecular aspects of drug transport in the kidney. Kidney Int. 2000;58(3):944–958. doi: 10.1046/j.1523-1755.2000.00251.x. [DOI] [PubMed] [Google Scholar]
- 6.Muller F, Fromm MF. Transporter-mediated drug–drug interactions. Pharmacogenomics. 2011;12(7):1017–1037. doi: 10.2217/pgs.11.44. [DOI] [PubMed] [Google Scholar]
- 7.Ohashi R, Tamai I, Yabuuchi H, Nezu JI, Oku A, Sai Y, et al. Na(+)-dependent carnitine transport by organic cation transporter (OCTN2): its pharmacological and toxicological relevance. J Pharmacol Exp Ther. 1999;291(2):778–784. [PubMed] [Google Scholar]
- 8.Tamai I, Nakanishi T, Kobayashi D, China K, Kosugi Y, Nezu J, et al. Involvement of OCTN1 (SLC22A4) in pH-dependent transport of organic cations. Mol Pharm. 2004;1(1):57–66. doi: 10.1021/mp0340082. [DOI] [PubMed] [Google Scholar]
- 9.Hasegawa M, Kusuhara H, Endou H, Sugiyama Y. Contribution of organic anion transporters to the renal uptake of anionic compounds and nucleoside derivatives in rat. J Pharmacol Exp Ther. 2003;305(3):1087–1097. doi: 10.1124/jpet.102.046847. [DOI] [PubMed] [Google Scholar]
- 10.Koepsell H, Lips K, Volk C. Polyspecific organic cation transporters: structure, function, physiological roles, and biopharmaceutical implications. Pharm Res. 2007;24(7):1227–1251. doi: 10.1007/s11095-007-9254-z. [DOI] [PubMed] [Google Scholar]
- 11.Tanihara Y, Masuda S, Sato T, Katsura T, Ogawa O, Inui K. Substrate specificity of MATE1 and MATE2-K, human multidrug and toxin extrusions/H(+)-organic cation antiporters. Biochem Pharmacol. 2007;74(2):359–371. doi: 10.1016/j.bcp.2007.04.010. [DOI] [PubMed] [Google Scholar]
- 12.Fagerholm U. Prediction of human pharmacokinetics—renal metabolic and excretion clearance. J Pharm Pharmacol. 2007;59(11):1463–1471. doi: 10.1211/jpp.59.11.0002. [DOI] [PubMed] [Google Scholar]
- 13.Paine SW, Menochet K, Denton R, McGinnity DF, Riley RJ. Prediction of human renal clearance from preclinical species for a diverse set of drugs that exhibit both active secretion and net reabsorption. Drug Metab Dispos Biol Fate Chem. 2011;39(6):1008–1013. doi: 10.1124/dmd.110.037267. [DOI] [PubMed] [Google Scholar]
- 14.Watanabe T, Kusuhara H, Debori Y, Maeda K, Kondo T, Nakayama H, et al. Prediction of the overall renal tubular secretion and hepatic clearance of anionic drugs and a renal drug–drug interaction involving organic anion transporter 3 in humans by in vitro uptake experiments. Drug Metab Dispos Biol Fate Chem. 2011;39(6):1031–1038. doi: 10.1124/dmd.110.036129. [DOI] [PubMed] [Google Scholar]
- 15.Watanabe T, Kusuhara H, Sugiyama Y. Application of physiologically based pharmacokinetic modeling and clearance concept to drugs showing transporter-mediated distribution and clearance in humans. J Pharmacokinet Pharmacodyn. 2010;37(6):575–590. doi: 10.1007/s10928-010-9176-y. [DOI] [PubMed] [Google Scholar]
- 16.Graumlich JF, Ludden TM, Conry-Cantilena C, Cantilena LR, Jr, Wang Y, Levine M. Pharmacokinetic model of ascorbic acid in healthy male volunteers during depletion and repletion. Pharm Res. 1997;14(9):1133–1139. doi: 10.1023/A:1012186203165. [DOI] [PubMed] [Google Scholar]
- 17.Felmlee MA, Wang Q, Cui D, Roiko SA, Morris ME. Mechanistic toxicokinetic model for gamma-hydroxybutyric acid: inhibition of active renal reabsorption as a potential therapeutic strategy. AAPS J. 2010;12(3):407–416. doi: 10.1208/s12248-010-9197-x. [DOI] [PMC free article] [PubMed] [Google Scholar]
- 18.Landersdorfer CB, Kirkpatrick CM, Kinzig M, Bulitta JB, Holzgrabe U, Sorgel F. Inhibition of flucloxacillin tubular renal secretion by piperacillin. Br J Clin Pharmacol. 2008;66(5):648–659. doi: 10.1111/j.1365-2125.2008.03266.x. [DOI] [PMC free article] [PubMed] [Google Scholar]
- 19.Russel FG, Wouterse AC, van Ginneken CA. Physiologically based pharmacokinetic model for the renal clearance of phenolsulfonphthalein and the interaction with probenecid and salicyluric acid in the dog. J Pharmacokinet Biopharm. 1987;15(4):349–368. doi: 10.1007/BF01066518. [DOI] [PubMed] [Google Scholar]
- 20.Jusko WJ, Levy G. Pharmacokinetic evidence for saturable renal tubular reabsorption of riboflavin. J Pharm Sci. 1970;59(6):765–772. doi: 10.1002/jps.2600590608. [DOI] [PubMed] [Google Scholar]
- 21.Wang X, Wang Q, Morris ME. Pharmacokinetic interaction between the flavonoid luteolin and gamma-hydroxybutyrate in rats: potential involvement of monocarboxylate transporters. AAPS J. 2008;10(1):47–55. doi: 10.1208/s12248-007-9001-8. [DOI] [PMC free article] [PubMed] [Google Scholar]
- 22.Komiya I. Urine flow dependence of renal clearance and interrelation of renal reabsorption and physicochemical properties of drugs. Drug Metab Dispos Biol Fate Chem. 1986;14(2):239–245. [PubMed] [Google Scholar]
- 23.Itagaki S, Shimamoto S, Hirano T, Iseki K, Sugawara M, Nishimura S, et al. Comparison of urinary excretion of phenolsulfonphthalein in an animal model for Wilson’s disease (Long-Evans Cinnamon rats) with that in normal Wistar rats: involvement of primary active organic anion transporter. J Pharm Pharm Sci Publ Can Soc Pharm Sci, Soc Can Sci Pharm. 2004;7(2):227–234. [PubMed] [Google Scholar]
- 24.Wang Q, Darling IM, Morris ME. Transport of gamma-hydroxybutyrate in rat kidney membrane vesicles: role of monocarboxylate transporters. J Pharmacol Exp Ther. 2006;318(2):751–761. doi: 10.1124/jpet.106.105965. [DOI] [PubMed] [Google Scholar]
- 25.Proctor NJ, Tucker GT, Rostami-Hodjegan A. Predicting drug clearance from recombinantly expressed CYPs: intersystem extrapolation factors. Xenobiotica. 2004;34(2):151–178. doi: 10.1080/00498250310001646353. [DOI] [PubMed] [Google Scholar]
- 26.Brown CD, Sayer R, Windass AS, Haslam IS, De Broe ME, D’Haese PC, et al. Characterisation of human tubular cell monolayers as a model of proximal tubular xenobiotic handling. Toxicol Appl Pharmacol. 2008;233(3):428–438. doi: 10.1016/j.taap.2008.09.018. [DOI] [PubMed] [Google Scholar]
- 27.Tahara H, Kusuhara H, Chida M, Fuse E, Sugiyama Y. Is the monkey an appropriate animal model to examine drug–drug interactions involving renal clearance? Effect of probenecid on the renal elimination of H2 receptor antagonists. J Pharmacol Exp Ther. 2006;316(3):1187–1194. doi: 10.1124/jpet.105.094052. [DOI] [PubMed] [Google Scholar]
- 28.Shima JE, Komori T, Taylor TR, Stryke D, Kawamoto M, Johns SJ, et al. Genetic variants of human organic anion transporter 4 demonstrate altered transport of endogenous substrates. Am J Physiol Renal Physiol. 2010;299:F767–F775. doi: 10.1152/ajprenal.00312.2010. [DOI] [PMC free article] [PubMed] [Google Scholar]
- 29.Chen L, Takizawa M, Chen E, Schlessinger A, Choi JH, Segenthelar J, et al. Genetic polymorphisms in the organic cation transporter 1, OCT1, in Chinese and Japanese populations, exhibit altered function. J Pharmacol Exp Ther. 2010;335:42–50. doi: 10.1124/jpet.110.170159. [DOI] [PMC free article] [PubMed] [Google Scholar]
- 30.Varma MV, Feng B, Obach RS, Troutman MD, Chupka J, Miller HR, et al. Physicochemical determinants of human renal clearance. J Med Chem. 2009;52(15):4844–4852. doi: 10.1021/jm900403j. [DOI] [PubMed] [Google Scholar]
- 31.Hall S, Rowland M. Relationship between renal clearance, protein binding and urine flow for digitoxin, a compound of low clearance in the isolated perfused rat kidney. J Pharmacol Exp Ther. 1984;228(1):174–179. [PubMed] [Google Scholar]
Associated Data
This section collects any data citations, data availability statements, or supplementary materials included in this article.
Supplementary Materials
(DOCX 36.3 kb)