

Abstract
Manufacturing changes during a biological drug product life cycle occur often; one common change is that of the manufacturing site. Comparability studies may be required to ensure that the changes will not affect the pharmacokinetic properties of the drug. In addition, the bioanalytical method for sample analysis may evolve during the course of drug development. This paper illustrates the scenario of both manufacturing and bioanalytical method changes encountered during the development of denosumab, a fully human monoclonal antibody which inhibits bone resorption by targeting RANK Ligand. Here, we present a rational approach to address the bioanalytical method changes and provide considerations for method validation and sample analysis in support of biocomparability studies. An updated and improved ELISA method was validated, and its performance was compared to the existing method. The analytical performances, i.e., the accuracy and precision of standards and validation samples prepared from both manufacturing formulation lots, were evaluated and found to be equivalent. One of the lots was used as the reference standard for sample analysis of the biocomparability study. This study was sufficiently powered using a parallel design. The bioequivalence acceptance criteria for small molecule drugs were adopted. The pharmacokinetic parameters of the subjects dosed with both formulation lots were found to be comparable.
Electronic supplementary material
The online version of this article (doi:10.1208/s12248-012-9414-x) contains supplementary material, which is available to authorized users.
KEY WORDS: biocomparability, denosumab, ligand binding assay, method validation, pharmacokinetics
INTRODUCTION
During the development of biological drug products, changes in manufacturing processes are made to improve expression or product stability, to scale up, or to comply with changes in regulatory requirements. Manufacturing sites may also be changed. The drug substance before and after change should be compared to show similar product quality attributes, ensure the new process maintains or improves capabilities, and demonstrate the change has no impact on pharmacokinetic properties (1).
Bioequivalence is a term in pharmacokinetics (PK) used to assess the expected in vivo biological equivalence of two proprietary preparation of a drug. Bioequivalence (BE) studies are required by regulatory agencies to insure therapeutic equivalence. If two products are said to be bioequivalent, it means they would be expected to behave similarly for their intended use. The current industry BE criteria applies to small molecule therapeutics. For small molecule chemical entities, the chemical structures are well defined which allow certainty of their molecular equivalence. The United States Food and Drug Administration (FDA) has defined bioequivalence as, “the absence of a significant difference in the rate and extend to which the active ingredients or active moiety in pharmaceutical equivalents or pharmaceutical alternatives becomes available at the site of drug action when administrated at the same molar dose under similar condition in an appropriately designed study” (FDA 2003) (2).
Most protein biotherapeutics have higher-order structure with posttranslational heterogeneity. Sometimes, in addition to analytical comparison of the drug, it is necessary to carry out in vivo comparability studies (3–5). Regulatory guidance on comparability has been stated in International Committee on Harmonization Q5E and Q6B (3), the European Medicines Agency 2007 guideline (4), and Guidance to industry by the FDA (5).
Due to the lack of established industry guidance for biocomparability of large molecule therapeutics, we applied small molecule guidelines on BE criteria, set by FDA, during our denosumab biocomparability studies. FDA considers two products to be bioequivalent if the 90% confidence intervals (CI) of the ratio of geometric mean Cmax, AUC(0−t) and AUC (0−∞) values of the test drug product to that of the reference are within 80% to 125% (1). However, the ligand binding assays used for the bioanalysis of large molecules in general have higher variability than that of the small molecules (6) Therefore, minimization of assay variability will be important to demonstrate biocomparability of the products using such criteria.
In addition, the bioanalytical method used in early stages of drug development may also undergo changes for improvement or to meet current industry standards. Under those circumstances, a method validation should be conducted prior to the clinical biocomparability studies (7–9). Here, we illustrate the specific bioanalytical approaches in method validation and sample analysis that involved a method change to support denosumab biocomparability studies upon a change in manufacturing site.
Denosumab is a fully human monoclonal antibody that binds RANK ligand (RANKL) with high affinity and inhibits its activity (10). RANKL has been identified as the primary mediator of osteoclast (bone resorption) formation, function, and survival (11–14). RANKL expression is induced in osteoclasts, and subsequently binds to RANK on immature and mature osteoclasts (15). Maturation of pre-fusion osteoclasts to multinucleated osteoclasts and finally to activated osteoclasts is initiated when RANKL binds to RANK receptor. Denosumab targets bone loss through the same pathway as osteoprotegerin (OPG), the physiologic inhibitor of RANKL.
A commercial kit of enzyme-linked immunosorbent assay (ELISA) method has been used for the quantification of denosumab in human serum to support clinical studies (16). One key deficiency of the commercial kit method is that it uses a human serum-derived diluent (HD6Y) to prepare calibrator standards (STDs) and quality controls (QCs) and to dilute serum samples before analysis. In addition, this method has a very narrow analytical assay range from 0.8 to 35 ng/mL (R & D OPGL ELISA Kit, Cat # DOL00-COM). It was desirable to develop and validate an improved assay, where the STDs and QCs were prepared in the same matrix (human serum) as the intended samples and with a wider assay range to support the biocomparability studies (6).
An improved in-house ELISA method was developed and validated to meet the following purposes: (1) to evaluate and demonstrate the lack of matrix effect, (2) to establish method assay acceptance criteria from the accuracy and precision experiments, (3) to establish analytical equivalency between the two formulation lots from two manufacturing sites used for the clinical biocomparability study, and (4) to compare assay performance on method conformance samples with that of the kit method.
MATERIALS AND METHODS
Materials
In-house ELISA
The two denosumab formulation lots A and B were from different Amgen Inc. manufacturing sites. Recombinant human RANK ligand (RANKL, same as OPGL) and biotinylated rabbit anti-denosumab detection antibody were from Amgen Inc. (Thousand Oaks, CA). Streptavidin conjugated to horseradish peroxidase (HRP) was purchased from R&D Systems Inc. (Minneapolis, MN). The tetramethylbenzidine (TMB) peroxidase substrate solution and the 1× KPL wash buffer were purchased from Kirkegaard and Perry Laboratories Inc. (Gaithersburg, MD). Healthy normal serum samples were obtained from Bioreclamation (Hicksville, NY). The assay buffer (1% BSA, 1 M NaCl, 0.5% Tween 20 in 10 mM phosphate buffer) was prepared in house.
Immunoassay Kit
The kit was manufactured at R&D Systems (Minneapolis, MN). The capture reagent osteoprotegerin ligand (OPGL) was prepared at Amgen and provided to R&D Systems. Denosumab reference material was also manufactured at Amgen Inc. The kit components consisted of: microtiter plate coated with OPGL, assay buffer (5% heat-inactivated normal goat serum, 0.27 M EDTA, 50 ppm Proclin 300, and 0.05% gentamicin sulfate in PBS, pH 7.1–7.3), KPL wash buffer, human serum-derived diluent (HD6Y), horseradish peroxide-OPGL conjugate, color reagents consisting of hydrogen peroxide and chromogen substrate solution, and acid stop solution.
Bioanalytical Method
In-house ELISA Method
The 96-well polystyrene plate was coated with 100 μL of approximately 2 μg/mL per well of the capture reagent, recombinant human RANKL by passive absorption for 12 to 72 h at 2°C to 8°C. STDs, QCs, validation samples (VSs), study samples, and blanks (100 μL) were loaded into the wells after minimum required dilution of tenfold with assay buffer. All incubation steps were carried out at 25°C to 28°C. After loading, the plate was incubated for 90 ± 30 min. The unbound materials were removed by a wash step. Biotin-conjugated rabbit anti-denosumab antibody (100 μL of approximately 1 μg/mL) was added as a detection reagent. After incubation for 90 ± 30 min and washing, 100 μL of streptavidin conjugated to HRP was added to bind to the complex. The plate was incubated for 32 ± 2 min, washed, and 100 μL of TMB peroxidase substrate solution was added. The plate was incubated for 23 ± 1 min, and 100 μL of 1 N H2SO4 was added to stop the color development. The optical density (OD) was measured at 450 nm with reference to 650 nm. The absorbance (OD) vs. concentration relationship was fitted with a four-parameter logistic auto-estimate regression model with a weighting factor of 1/Y (1/OD response).
Kit Method
The microtiter wells precoated with RANKL were used to capture denosumab in the samples. STDs and QCs were prepared in human serum-derived diluent (HD6Y). Seventy-five microliters of assay buffer was added to the plate followed by 25 μL of STDs, QCs, samples, and blanks. All shaking and incubation steps were carried out at a nominal temperature of 25°C to 28°C. The plate was covered with a plate sealer and shaken for 5 ± 1 min on a shaker (300–400 rpm), and then incubated for 2 h ± 5 min. After washing, 150 μL/well of OPGL conjugate was added. The plate was covered, mixed by shaking for 5 ± 1 min on a shaker, and incubated for 2 h ± 5 min. After another wash step, 150 μL/well of twofold dilution of substrate solution was added and incubated for 20 ± 5 min. To stop the reaction, 50 μL/well of the acid stop solution was added. The optical density (OD) was measured at 450 nm with reference to 650 nm. The absorbance (OD) vs. concentration relationship was fitted with a log–log (power) equation. A summary of differences between the two methods is listed in Table I.
Table I.
Summary of Differences Between the Methods
| Feature | In-house ELISA method | Kit method | |
|---|---|---|---|
| Capture | Recombinant human RANKL | Recombinant human RANKL | |
| Detection | Biotinylated rabbit anti-denosumab, streptavidin–HRP | HRP-recombinant human RANKL | |
| Matrix of STD, QC preparation, and sample diluent | 100% human serum | HD6Y (stripped human serum) | |
| Assay range (ng/mL) | 20–2,000 | 0.80–35 | |
| VS/QC (ng/mL) | ULOQ | 2,000 | 35 |
| HQC | 1,200 | 20 | |
| MQC | 400 | 3.5 | |
| LQC | 60 | 2.0 | |
| LLOQ | 20 | 0.8 | |
| Regression model | Four-parameter logistic auto-estimate with 1/Y weighing factor | Log–log | |
VS validation sample, QC quality control, ULOQ upper limit of quantification, HQC high quality control, MQC middle quality control, LQC low quality control, LLOQ lower limit of quantification
Preparation of Standards, Validation Samples, or Quality Controls
In-house ELISA—The STDs, VSs, and QCs were prepared by spiking denosumab formulation lots A and B into 100% human serum. The nominal concentrations for STDs in human serum were 20, 40, 100, 250, 500, 800, 1,500, and 2,000 ng/mL. Two anchor points outside of the quantitative range at 10 and 3,000 ng/mL were included to facilitate curve fitting. The nominal concentrations of VSs were 20 (LLOQ), 60 (LQC), 400 (MQC), 1,200 (HQC), and 2,000 (ULOQ) ng/mL. STDs and VSs were stored at −60°C to −80°C for a minimum of 12 h and up to 3 days prior to analysis. The VSs were used for the accuracy and precision experiments to determine assay acceptance criteria based on the total error (6). The low, mid, and high QCs (LQC, MQC, and HQC) at concentrations of 60, 400, 1,200 ng/mL were used to accept or reject analytical runs after the accuracy and precision experiments.
IN-HOUSE ELISA METHOD VALIDATION
Accuracy and Precision
Eight accuracy and precision (A & P) assays were performed by four analysts. For each A & P assay, an independent STD curve and a set of VS prepared from each formulation lot (A and B) were placed on the same plate. Each STD curve contained ten points (including the anchor points), and each set of QCs contained five levels (ULOQ, HQC, MQC, LQC, and LLOQ). Two sets of QCs were plated per formulation lot. VS concentrations were determined from STD curve of its own lot as well as from the other lot.
Method Ruggedness and Robustness Tests
The tolerance limit for samples, detection antibody/HRP, and substrate at short, mid, and long incubation times were determined during method development and confirmed during method validation. The validation incubation times are as follows: STD and QC with capture reagent, 95 ± 5 min; detection antibody, 80 ± 5 min; HRP–streptavidin, 35 ± 2 min; and TMB substrate, 23 ± 1 min.
Method Comparison
Even though the kit and the in-house ELISA methods used the same capture reagent, which was the target ligand of denosumab, there were some differences between the two analytical methods that are listed in Table I. In addition, the kit method was used in supporting previous studies. The new biocomparability studies were powered based on the variability observed in earlier studies, and assay variability should already be accounted for in study design (i.e., number of subjects). However, it was important that the variability of the new assay used for the new biocomparability study not to be higher than the previous assay. Therefore, it was important for the new method validation to conduct the comparison vs. previous one for method transition purposes (7).
To evaluate analytical comparability between the kit method and the in-house ELISA method, the kit assay was considered as the reference, and the ELISA assay as the comparator method. Clinical (incurred) and conformance (spiked) samples were analyzed separately. A total of 60 samples, 30 clinical and 30 conformance, were tested (four runs) using both assay methods for comparison. A sample size of 30 samples (for each analysis) provides 99% power to achieve the 90% confidence interval for the estimated ratio (reference/comparator) within the 0.8 to 1.25 interval assuming the true ratio to be 1.0 and the coefficient of variation to be 15% for each assay. Since the two methods have different quantification ranges, samples were run neat or diluted so that they fall within the assay range for each method as shown in Table II.
Table II.
Dilution of Spiked and Incurred Samples for Method Comparison
| Sample | Concentration range (ng/mL) | Number of samples | In-house ELISA method | Kit method |
|---|---|---|---|---|
| Incurred sample | 26–33 | 10 | Neat | Neat |
| 300–1,000 | 10 | Neat | Diluted (1:100) | |
| 4,000–8,000 | 10 | Diluted (1:10) | Diluted (1:1,000) | |
| Spiked sample | 25 | 10 | Neat | Neat |
| 400 | 10 | Neat | Diluted (1:100) | |
| 12,000 | 10 | Diluted (1:10) | Diluted (1:1,000) |
The results were compared by analysis of variance (ANOVA) on the log-transformed concentration with terms for sample and assay method in the model. SAS version 9.1 on a Windows Professional operating system was used for all statistical analysis. The difference of the mean log values and a two-sided 90% confidence interval was computed using an estimate statement within PROC MIXED (the procedure in SAS used to perform the ANOVA). The ratio of the means and its 90% confidence interval was obtained by back-transforming (exponentiating) the estimate of the mean difference and the associated 90% confidence interval. The two methods are deemed to be equivalent if the two-sided 90% confidence interval for the ratio of the observed concentrations is contained within the interval (0.80, 1.25).
Clinical Biocomparability Study of Formulation Lots A and B
Study Design
The study was an open-label, randomized, single-dose, parallel group study to compare a single 1.0 mg/kg subcutaneous injection of formulation lots A and B in healthy volunteers. The primary objective of the study was to evaluate the biocomparability based on exposure [area under curve from time zero to 16 weeks post dose (AUC0−16 weeks)]. The primary endpoint was the 90% confidence interval of the ratio of the geometric means for the PK parameter AUC0−16 weeks for treatment with formulation lots A and B.
Sample Size
The standard deviation of AUC0−16 weeks on a log-scale was approximately 0.37 based on previous studies (using the kit method). A sample size of 61 subjects per group would provide a 90% power to detect the 90% confidence interval for the ratio of geometric means of AUC0−16 weeks to be 0.8–1.25 assuming the true ratio is 1.0.
Sample Collection
Blood samples were collected on day 1 (pre-dose) and at the following time points after drug administration: 1, 2, 8, and 12 h post-dose, and on days 2, 3, 4, 5, 6, 8, 11, 15, 22, 29, 43, 57, 71, 85, 99, and end of study (day 113).
Bioanalytical Sample Analysis
The in-house ELISA method was used to support the biocomparability study. Formulation lot B was used to prepare STDs and QCs in one batch sufficient to cover entire sample analysis for the study. Sufficient long-term stability was established to cover the period of samples analysis. The clinical samples and single-day-use aliquots of STDs and QCs were stored at −60°C to −80°C. Sixty subjects completed the study for treatment with formulation lot A and 59 for treatment with formulation lot B. Three analysts who participated in the ELISA method validation also participated in the sample analysis. To balance operator bias, approximately the same numbers of samples per treatment were assayed by each of the three analysts. Each analyst ran four plates per day. A complete patient profile for one subject consisting of 21 samples was run per plate. Each analytical run consisted of serum blank, one set of STDs, two sets of QCs (at low, mid, and high concentrations), and clinical samples. In general, analysis of treatment with formulation lot A samples was completed before that of treatment with formulation lot B. Samples with concentrations higher than the ULOQ were diluted using human serum.
Pharmacokinetic Analysis
Serum denosumab concentration–time data were analyzed by non-compartmental methods using WinNonlin v 4.1e (Pharsight Corporation, Mountain View, CA). Figures were created using SigmaPlot 2002 v 8.02 (SPSS Science, Chicago, IL). Nominal sampling times were used in the analysis unless the actual time deviation was greater than 10%, in which case the actual time was used. Denosumab serum concentrations below the lower limit of quantification (LLOQ) of 20 ng/mL were listed as below quantifiable limit in the non-compartmental analysis and were converted to zero for the calculation of summary statistics. Summary statistics were calculated using nonrounded values.
The maximum observed serum denosumab concentration (Cmax) after dosing was identified by inspection of the data. The corresponding time of Cmax (Tmax) was also recorded. The area under the concentration–time curve from time 0 to 16 weeks (AUC0−16 weeks) was calculated by the linear-log trapezoidal method, which applies the linear trapezoidal rule up to Cmax and then the log trapezoidal rule for the remainder of the curve.
RESULTS AND DISCUSSION
Method Validation
Matrix Effect
The immunoassay kit used to support clinical studies uses the RANK-depleted human serum (HD6Y) to prepare STDs, QCs, and to dilute serum samples. For the in-house ELISA method, 100% human serum was used instead of HD6Y. Since endogenous RANK from various individual may interfere with the assay, it was critical to demonstrate the lack of matrix effect. Prior to start of method validation, a total of 27 individual lots (male and female) were tested, and no matrix effect was observed. During method validation, lack of matrix effect was confirmed using additional six individual lots of human serum (from three males and three females) spiked with denosumab at the LLOQ (20 ng/mL) and LQC (60 ng/mL) levels. The spiked sample recoveries averaged at 18.6 ng/mL (LLOQ) and 54.5 ng/mL (LQC) with mean percent bias of −7.14% and −9.10% respectively, showing the absence of matrix effect on all of these test lots.
Furthermore, the effect of endogenous OPG/RANK was previously evaluated during the commercial kit validation. The cross-reactivity of the RANKL (the capture reagent) was tested against OPG. No assay interference was detected for up to 40 ng/mL of OPG, which was much higher than the endogenous levels in serum (0.17 ng/mL in healthy subject and 0.12 to 0.35 ng/mL in various cancer patients (17). The evaluation of cross-reactivity from the endogenous OPG was not repeated in the in-house ELISA method validation since both assays use the same capture reagent (RANKL).
Linearity and Analytical Comparison of Formulation Lots A and B
The kit method has a narrow analytical assay range, which would require the dilution of most samples at a thousandfold. High sample dilution can increase assay variability (18). Therefore, improvement with the in-house method was required for linearity over a wider analytical assay range. In addition, analytical comparability for both formulation lots was a prerequisite for the application to biocomparability studies (7).
Figure 1 shows the representative standard curves of formulation lots A and B from the accuracy and precision experiments. The assay range of 20 to 2,000 ng/mL was confirmed by the acceptable accuracy and precision data of the LLOQ and ULOQ for formulation lots A and B presented in Tables III. The assay range was successfully widened to two logs, minimizing the need for multiple dilutions and potential dilution error. The standard curves plots are comparable for both formulation lots in the readout responses vs. the concentrations, indicating their analytical comparability. Because the two formulation lots are analytically comparable, formulation B (longer expiration date) was used to assess the additional method performance characteristics and also as the reference standard to support sample analysis for clinical biocomparability studies.
Fig. 1.
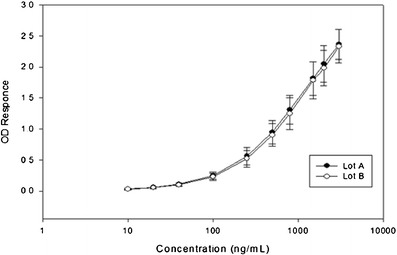
Comparison of STD curves from formulation lot A and B from different manufacturing sites
Table III.
Summary of Method Validation of In-house EILSA, Inter-assay Accuracy and Precision for Formulation Lots A and B
| Quality control levels | |||||||
|---|---|---|---|---|---|---|---|
| Nominal concentration (ng/mL) | |||||||
| Formulation lot | Characteristic | Statistic | ULOQ 2000 | HQC 1200 | MQC 400 | LQC 60.0 | LLOQ 20.0 |
| A | Accuracy | Mean bias (%RE) | −2.13 | −1.47 | −2.57 | −1.22 | −3.74 |
| Precision | Interbatch (%CV) | 4.81 | 5.42 | 3.20 | 3.66 | 5.85 | |
| Total Error | |Mean| + interbatch | 6.94 | 6.89 | 5.77 | 4.88 | 9.32 | |
| B | Accuracy | Mean bias (%RE) | −2.03 | −3.19 | −2.48 | −1.25 | 0.01 |
| Precision | Interbatch (%CV) | 4.94 | 3.94 | 3.79 | 2.64 | 17.8 | |
| Total error | |Mean| + interbatch | 6.97 | 7.13 | 6.27 | 3.89 | 17.8 | |
% RE %recovery, %CV %coefficient of variation, Total Error: Sum of accuracy (mean Bias) and inter-batch precision, ULOQ upper limit of quantification, HQC high quality control, MQC middle quality control, LQC low quality control, LLOQ lower limit of quantification
Accuracy and Precision
Assay variability can contribute to variability in PK parameters and thus impact the design and outcome of biocomparability studies. A bioanalytical method with high variability can have an effect on the required sample size in biocomparability studies. The in-house ELISA method demonstrated sufficient accuracy and precision (total error within 15% is desirable) and robustness in order to support a biocomparability study with a set criteria similar to that of a BE study (within 80% to 125%). Table III shows that bias and imprecision were all of single digits for both formulations except for the ULOQ of formulation lot B. The maximum total error was ≤15% for all QCs. Therefore, the assay acceptance criterion was set at ±15% of the nominal values. Other acceptance criteria were established as follows: for STDs (excluding anchor points), the accuracy (percent bias) was set to be ±15%; and the precision of duplicate instrument response (%CV) was set to be ≤15%.
The assay was shown to be robust over various incubation times using different equipment and performed by different analysts over multiple days. The ELISA method was validated to be suitable to support biocomparability studies. Table III displays the summary of accuracy and precision.
Analytical Comparison of Immunoassay Kit vs. In-house ELISA Method
Figure 2 shows that the results of the conformance (spiked) samples using the kit, and ELISA methods were analytically equivalent. The estimated mean of the ratio (Kit/ ELISA) was 0.973 with a two-sided 90% confidence interval of the ratio (0.953, 0.994). The confidence interval was completely contained within the predefined interval of (0.80, 1.25). Figure 3 also confirms the analytical equivalency of the methods for incurred samples. The estimated mean of the ratio (Kit/ELISA) was 1.002, and its two-sided 90% confidence interval was (0.986, 1.019), which was completely contained within the interval (0.80, 1.25). Review of the concentration ratio by sample demonstrates good consistency. The maximum and minimum ratio for both spiked and incurred samples were 1.094 and 0.847, respectively.
Fig. 2.
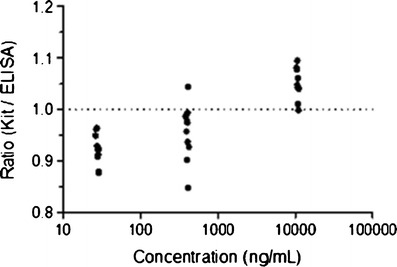
Ratios of concentrations determined by immunoassay kit vs. in-house ELISA methods of spiked samples
Fig. 3.
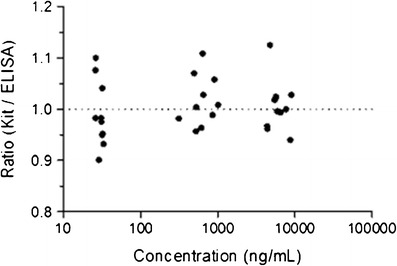
Ratio vs. concentrations determined by immunoassay kit vs. in-house ELISA methods of incurred samples
Clinical Biocomparability Study
A total of 2,517 samples were analyzed in 125 assays, which were spread evenly among the three analysts to minimize human bias. Only two assays failed to meet the acceptance criteria and were repeated. Thus, the method robustness was demonstrated by the success of the in-study data with more than 98% passing rate and without a significant bias among the analysts over time as shown by the QC performance in Fig. 4.
Fig. 4.
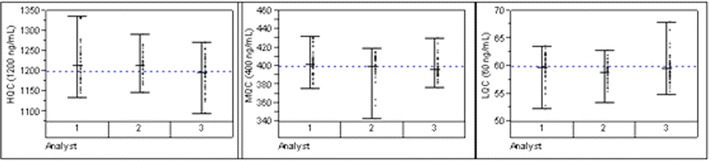
QC performance by analysts
PK Comparability
As illustrated in Fig. 5 (semi-log scale) and Fig. 6 (linear scale), the mean serum denosumab concentration–time profiles for denosumab formulation lot A and lot B are essentially superimposable. In addition, the profiles on Fig. 6 indicate that sampling to 16 weeks (112 days) indeed captured a large majority of exposure for both treatments. Mean denosumab PK parameters and the point estimate (PE) and 90% CI for the ratio of the geometric means for AUC0−16 weeks (A/B) are shown in Table IV. Mean AUC0−16 weeks and Cmax values differed by less than 2 and 4%, respectively, between treatments. The 90% CI for the ratio of the geometric means for AUC0−16 weeks was within 0.80 to 1.25; thus, denosumab lot A and lot B are considered biocomparable. The 90% CI for the ratio of the geometric means for Cmax was also within 0.80 to 1.25, and the median (range) Tmax was the same for the two treatments. The latter observations indicate that the absorption characteristics of denosumab lot A and lot B following SC administration are similar (Table IV).
Fig. 5.

Mean (±SD) serum denosumab concentration–time profiles (nanograms per milliliter) following SC administration of 1.0 mg/kg denosumab formulation lot A or lot B to healthy volunteers (semi-logarithmic scale)
Fig. 6.

Mean (±SD) serum denosumab concentration–time profiles (nanograms per milliliter) following SC administration of 1.0 mg/kg denosumab formulation lot A or lot B to healthy volunteers (linear scale)
Table IV.
Mean (SD) Serum Denosumab Pharmacokinetic Parameter Estimates Following a 1.0 mg/kg SC Administration of Denosumab A or B to Healthy Volunteers
| Parameter | Treatment A | Treatment B | PE (90% CI)a |
|---|---|---|---|
| AUCb0-16 weeks (μg*day/mL) | 432 (150) | 440 (110) | 0.95 (0.86, 1.05) |
| C max (μg/mL) | 9.42 (3.09) | 9.07 (2.31) | 1.02 (0.92, 1.12) |
| T max (day) | 7.0 (2.0–21) | 7.0 (2.0–21) | – |
AUC 0−16 weeks area under serum denosumab concentration–time curve from 0 to 16 weeks, C max maximum observed concentration, T max time at which C max is observed, presented as median (range)
aPoint estimate (PE) and 90% confidence intervals (CI) are for the ratio (LC/TO) for log-transformed AUC0−16 weeks and C max
bFor AUC0−16 weeks, n = 59 and 58 for TO and LC, respectively, due to insufficient data
Application to Other Biocomparability Studies
The similar bioanalytical approach on sample analysis was applied to four subsequent biocomparability studies for denosumab. All test products showed analytical equivalency, and the PK parameters met the set acceptance criteria of biocomparability (data not shown). The in-study QC performance demonstrated the method robustness as a result of the well-validated method and bioanalytical execution (Refer to Table 1 in the Electronic Supplementary Material).
CONCLUSION
Our experience in supporting the biocomparability studies of denosumab brought out a few points for consideration: (1) The acceptance criteria of the biocomparability were set a priori. (2) We recognized the need to improve the legacy kit method to meet current industry standards and with better performance to meet the set criteria. (3) Specific goals were set for method validation for the improved method to demonstrate: the lack of matrix effect accuracy and precision, analytical equivalency between the two formulation lots, and methods comparability of assay performance on conformance samples. (4) The parallel design clinical study was statistically powered for the number of subjects. (5) The sample analysis was conducted to minimize operator, reagent, and instrument variability.
A well-defined method, well-designed validation procedure, and sample analysis of a statistically powered study led to the success of the biocomparability study. Therefore, this paper introduces a rational and effective approach in method validation, method comparison, and of sample analysis to support biocomparability studies.
Electronic Supplementary Material
Below is the link to the electronic supplementary material.
(DOCX 33 kb)
REFERENCES
- 1.Chirino AJ, Mire-Sluis A. Characterizing biological products and assessing comparability following manufacturing changes. Nat Biotechnol. 2004;22(11):1383–1391. doi: 10.1038/nbt1030. [DOI] [PubMed] [Google Scholar]
- 2.Guidance for Industry; Bioavailability and Bioequivalence Studies for Orally Administrated Drug Product- General Considerations; U.S. Department of Health and Human Services; Food and Drug Administration; Center for Drug Evaluation and Research (CDER), March 2003, Revision 1. http://www.fda.gov/downloads/Drugs/.../Guidances/ucm070124.pdf.
- 3.ICH. International Conference on Harmonization (ICH) of technical requirements for registration of pharmaceuticals for human use (1999). ICH Harmonized Tripartite Guideline Q6B Specifications: Test Procedures And Acceptance Criteria For Biotechnological/Biological Products Q6b CPMP/ICH/365/96. (1999). ICH. ICH Harmonized Tripartite Guideline Q5E Comparability of Biotechnological/Biological Products Subject to Changes in their Manufacturing Process CPMP/ICH/5721/03. (2004).
- 4.EMEA . Guideline on comparability of biotechnology-derived medicinal products after a change in the manufacturing process: non-clinical and clinical issues EMEA/CHMP/BMWP/101695/2006. London: EMEA; 2007. [Google Scholar]
- 5.FDA Guidance for Industry (Draft Guidance): Comparability Protocols- Protein Drug Products and Biological Products- Chemsitrty, Manufacturing, and Controls Information, September 2003. http://www.fda.gov/downloads/Drugs/GuidanceComplianceRegulatoryInformation/Guidances/ucm070262.pdf.
- 6.DeSilva B, Smith W, Weiner R, Kelley M, Smolec J, Lee B, et al. Recommendations for the bioanalytical method validation of ligand-binding assays to support pharmacokinetic assessments of macromolecules. Pharm Res. 2003;20(11):1885–1900. doi: 10.1023/B:PHAM.0000003390.51761.3d. [DOI] [PubMed] [Google Scholar]
- 7.Lee JW, Wang YM, Moxness M, DeSilva B. Bioanalytical considerations in the comparability assessment of biotherapeutics. Bioanalysis. 2011;3(6):613–622. doi: 10.4155/bio.11.25. [DOI] [PubMed] [Google Scholar]
- 8.U.S. Department of Health and Human Services. Food and Drug Administration, Center for Drug Evaluation and Research (CDER) Guidance for industry. Statistical approaches to establishing bioequivalence. Rockville: Food and Drug Administration; 2001. pp. 1–45. [Google Scholar]
- 9.Kelley M, DeSilva B. Key elements of bioanalytical method validation for macromolecules. AAPS J. 2007;9(2):E156–E163. doi: 10.1208/aapsj0902017. [DOI] [PMC free article] [PubMed] [Google Scholar]
- 10.Bekker PJ, et al. A single-dose placebo-controlled study of MAG 162, a fully human monoclonal antibody to RANKL, in postmenopausal women. J Bone Miner Res. 2004;19(7):1059–1066. doi: 10.1359/JBMR.040305. [DOI] [PubMed] [Google Scholar]
- 11.Yasuda H, et al. Osteoclast differentiation factor is a ligand for osteoprotegerin osteoclastogenesis-inhibitory factor and is identical to TRANCE/RANKL. Proc Natl Acad Sci USA. 1998;95:3597–3602. doi: 10.1073/pnas.95.7.3597. [DOI] [PMC free article] [PubMed] [Google Scholar]
- 12.Fuller K, et al. TRANCE is necessary and sufficient for osteoblast-mediated activation of bone resorption in osteoclasts. J Exp Med. 1998;188:997–1001. doi: 10.1084/jem.188.5.997. [DOI] [PMC free article] [PubMed] [Google Scholar]
- 13.Lacey DL, et al. Osteoprotegerin ligand is a cytokine that regulates osteoclast differentiation and activation. Cell. 1998;93:165–176. doi: 10.1016/S0092-8674(00)81569-X. [DOI] [PubMed] [Google Scholar]
- 14.Lacey DL, et al. Osteoprotegerin ligand modulates murine osteoclast survival in vitro and in vivo. Am J Pathol. 2000;157:435–4. doi: 10.1016/S0002-9440(10)64556-7. [DOI] [PMC free article] [PubMed] [Google Scholar]
- 15.Bovle WJ, et al. Osteoclast differentiation and activation. Nature. 2003;423:337–342. doi: 10.1038/nature01658. [DOI] [PubMed] [Google Scholar]
- 16.Block GA, Bone HG, Fang L, Lee E, Padhi D. A single-dose study of denosumab in patients with various degree of renal impairment. J Bone Miner Res. 2012;7(7):1471–1479. doi: 10.1002/jbmr.1613. [DOI] [PMC free article] [PubMed] [Google Scholar]
- 17.Lipton A, Ali SM, Leitzel K, Chinchilli V, Witters L, Engle L, Holloway D, Bekker P, Dunstan CR. Serum osteoprotegerin levels in healthy controls and cancer patients. Clin Cancer Res. 2002;8:2306. [PubMed] [Google Scholar]
- 18.Pandya K. Strategies to minimize variability and bias associated with manual pipetting in ligand binding assays to assure data quality of protein therapeutic quantification. J Pharm Biomed Anal. 2010;53(3):623–630. doi: 10.1016/j.jpba.2010.04.025. [DOI] [PubMed] [Google Scholar]
Associated Data
This section collects any data citations, data availability statements, or supplementary materials included in this article.
Supplementary Materials
(DOCX 33 kb)