

Abstract
To identify the genetic drivers of colorectal tumorigenesis, we applied array comparative genomic hybridization (aCGH) to 13 formalin-fixed paraffin-embedded (FFPE) samples of early, localized human colon adenocarcinomas arising in high-grade adenomas (so called “malignant polyps”). These lesions are small and hence the amount of DNA is limited. Additionally, the quality of DNA is compromised due to the fragmentation as a consequence of formalin fixation. To overcome these problems, we optimized a newly developed isothermal whole genome amplification system (NuGEN Ovation® WGA FFPE System). Starting with 100 ng of FFPE DNA, the amplification system produced 4.01 ± 0.29 μg (mean ± standard deviation) of DNA. The excellent quality of amplified DNA was further indicated by a high signal-to-noise ratio and a low derivative log2 ratio spread. Both, the amount of amplified DNA and aCGH performance were independent of the age of the FFPE blocks and the associated degradation of the extracted DNA. We observed losses of chromosome arms 5q and 18q in the adenoma components of the malignant polyp samples, while the embedded early carcinomas revealed losses of 8p, 17p, and 18, and gains of 7, 13, and 20. Aberrations detected in the adenoma components were invariably maintained in the embedded carcinomas. This approach demonstrates that using isothermally whole genome amplified FFPE DNA is technically suitable for aCGH. In addition to demonstrating the clonal origin of the adenoma and carcinoma part within a malignant polyp, the gain of chromosome arm 20q was an indicator for progression from adenoma to carcinoma.
Introduction
In colorectal tumorigenesis, the transition from normal epithelium through adenomas to invasive carcinomas and metastases is associated with the accumulation of a number of specific genetic changes (Fearon and Vogelstein, 1990; Bardi et al., 1993a; Ried et al., 1996). These genetic changes include mutations of specific genes, chromosomal aberrations resulting in genomic imbalances, and epigenetic alterations that lead to the inactivation of tumor suppressor genes and/or to the activation of oncogenes, which result in excess proliferation and survival. The distribution of genomic imbalances in colorectal carcinomas is very specific and is defined by recurrent gains of chromosomes and chromosome arms 7, 8q, 13q and 20, and losses of 4q, 8p and 18q (Bardi et al., 1993a,b, 1995; Ried et al., 1996; Heim and Mitelman, 2009). In order to contribute to our understanding of the sequential acquisition of genomic imbalances and patterns of clonal evolution, we now used aCGH to identify chromosomal gains and losses in synchronous adenomas and carcinomas of malignant polyps in the same patient.
These initial carcinomatous lesions are small adenocarcinomas arising in high-grade adenomas (from heretofore, we refer to the histologically defined adenoma areas in these malignant polyps as “adenomas”, and to the carcinomatous regions as “carcinomas”). Malignant polyps are clinically and pathologically extremely important since they represent already invasive lesions but are in the majority still cured by surgical intervention. So far, the aforementioned process of accumulating chromosomal aberrations during the transition from colorectal adenoma to carcinoma has mainly been studied in independent groups of adenomas and carcinomas, but not within malignant polyps. Such a phenotype/genotype correlation of formalin-fixed paraffin-embedded (FFPE) material is challenging because array comparative genomic hybridization (aCGH) requires considerable amounts of DNA of good quality. However, malignant polyps often contain only small regions of carcinoma tissue and the available amount of DNA is therefore limited. Furthermore, DNA extracted from FFPE tissue samples often shows a high degree of degradation and the presence of DNA adducts acquired during fixation. In addition, DNA degradation tends to worsen with storage time, making the analysis of archival samples even more challenging. To overcome the problem of insufficient DNA quality and quantity, we amplified the extracted FFPE DNA using an optimized, newly developed isothermal whole genome amplification (WGA) system for FFPE samples, the Ovation® WGA FFPE System (NuGEN Technologies, Inc., San Carlos, CA). Our study aimed to evaluate this WGA system as a means to produce sufficient genomic material of quality suitable for aCGH. We assessed the influence of FFPE block age and DNA degradation on the system's effectiveness and in terms of aCGH performance of the amplified material. Apart from that, the technique was used to gain insight into the evolution of colorectal carcinomas in malignant polyps.
Materials and Methods
Tumor Materials
FFPE tissue blocks of 13 human colorectal adenomas with an embedded focal carcinoma (malignant polyps), which had been diagnosed between 1998 and 2010, were obtained from the archive of the Institute of Pathology, Paracelsus Medical University, Salzburg, Austria. All analyses on human malignant polyp samples were carried out according to the guidelines of the Paracelsus Medical University Salzburg / Salzburger Landeskliniken local ethics committee and all samples were diagnosed according to the latest WHO classification by two board certified pathologists (RK and TG). All samples were evaluated based on 3 μm hematoxylin eosin (HE) stained sections and the adenoma and carcinoma regions for DNA isolation were marked for macrodissection. For all 13 tumors, adenoma and carcinoma components were analyzed separately, resulting in a total of 26 archival samples.
DNA Isolation from FFPE Blocks
DNA was isolated from punch biopsies (0.6 mm in diameter) from the FFPE blocks after determining the adenoma and carcinoma areas on HE sections (Fig. 1). The biopsies were deparaffinized in 1 ml of Histochoice Clearing Agent (Amresco Inc., Solon, OH) in a thermomixer at 65°C and two rounds of agitations at 1100 rpm for 20 min. The tissue pieces were then washed with 1 ml of 50% ethanol/TE buffer and air dried before incubation in 400 μl of 1 M sodium thiocyanate at 65°C, followed by agitation at 450 rpm for 2 hours. After washing once in 400 μl of TE buffer, Proteinase K digestion, RNase A treatment and subsequent spin column purification of the extracted DNA were done using DNeasy Blood and Tissue Mini Kit (Qiagen, Hilden, Germany) according to the manufacturer's protocol. DNA concentration and purity were measured by spectrophotometry (NanoDrop 1000 Spectrophotometer, NanoDrop products, Wilmington, DE). DNA samples showing a 260/230 ratio smaller than 1.70 were additionally purified with a DNA Clean and Concentrator Kit (Zymo Research Corporation, Irvine, CA). Subsequently, DNA integrity was evaluated on 1% agarose gels stained with GelRed™ (Biotium, Inc., Hayward, CA).
Figure 1.
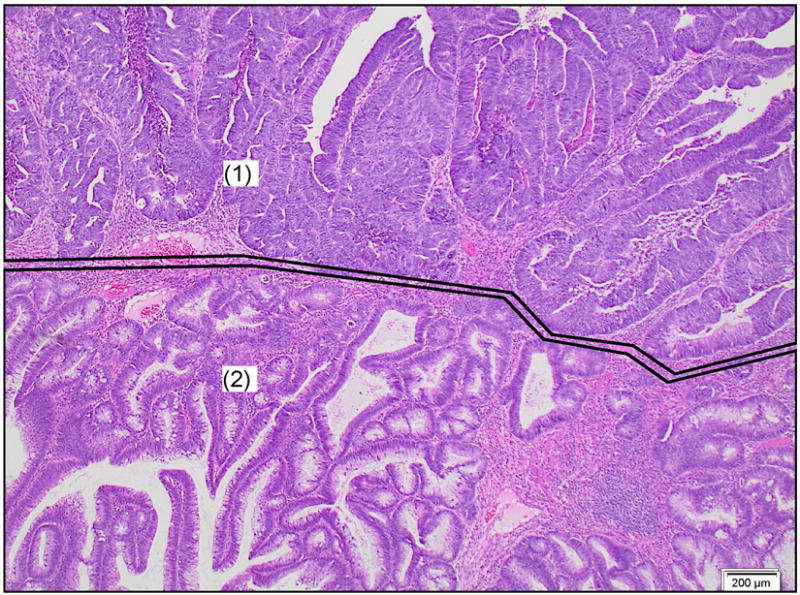
Example of an early, moderately differentiated adenocarcinoma arising in a tubular adenoma and invading below the muscularis mucosae (“malignant polyp”). Enclosed and marked with (1): invasive adenocarcinoma part, enclosed and marked with (2): adenoma part. HE, 20× magnification.
DNA Amplification
100 ng of isolated FFPE DNA was amplified using the beta version of the Ovation® WGA FFPE System (NuGEN), providing linear isothermal WGA. Briefly, after fragmentation and end repair, the 3′-ends were adenosine(A)-tailed. To the A-tailed overhang fragments, adaptors containing target hybridization sequences were ligated for Single Primer Isothermal Amplification (SPIA), followed by a purification step using Agencourt XP Beads (Beckman Coulter, Inc., Brea, CA). DNA/RNA chimeric SPIA primer hybridized to the target sequence present on the adaptors and the DNA polymerase then initiated replication at the 3′-end of each primer. The RNA portion at the 5′-end of the newly synthesized strand was removed by RNase H. Thus, the primer hybridization site was freed, another SPIA primer could bind and the growing new strand led to the displacement of the previously synthesized strand. Size distribution of amplified DNA was assessed by DNA 1000 BioAnalyzer profiles (Agilent Technologies, Inc., Santa Clara, CA).
aCGH
Amplified DNA was enzymatically labeled using the Bioprime® Total Genomic Labeling System (Invitrogen, Life Technologies, Carlsbad, CA) and subsequently hybridized on Agilent SurePrint G3 Human CGH Microarrays 4×180K (Agilent) according to the manufacturer's protocol version 6.2.1, February 2010. Briefly, 1.5 μg of amplified tumor DNA and 1.5 μg of amplified sex-matched human genomic DNA (Promega, Madison, WI) as reference were differentially labeled with Alexa Fluor® 3 and Alexa Fluor® 5 (both Invitrogen), respectively. Unincorporated nucleotides were removed using PureLink™ purification columns (Invitrogen) and a final elution volume of 25 μl was achieved. According to the labeling efficiency determined by NanoDrop, purified labeled samples were combined and hybridized at 65°C and 20 rpm for 40 hours to the CGH Microarrays 4×180K (Agilent). After washing, slides were scanned with microarray scanner G2565BA (Agilent) and images were analyzed with Feature Extraction software version 10.7.1.1 (Agilent). To visualize the aCGH data, CGH Analytics software 4.0.76 (Agilent) and Nexus Copy Number™ software version 5 (BioDiscovery, El Segundo, CA) were used. The quality of the slides was assessed using quality control (QC) metrics provided by CGH Analytics (Agilent). As a proof of principle experiment, we performed aCGH analyses in two of the carcinomas with and without amplification of the same DNA. For non-amplified DNA, 1.5 μg of tumor DNA and 1.5 μg of sex-matched human genomic DNA (Promega) as reference were digested with Alu I and Rsa I (both Promega) at 37°C for 2 hours and then purified using QIAquick PCR Purification Kit (Qiagen) before labeling. All subsequent steps were performed as described.
Statistical Analysis
The significance of chromosomal aberrations in the adenoma and corresponding carcinoma samples was analyzed by binomial testing. False Discovery Rate (FDR) levels of smaller than 0.1 after Benjamini-Hochberg p-value adjustments were considered significant (Benjamini and Hochberg, 1995). Differences between ANCA values were estimated by Student's t-test with a threshold p-value <0.05.
Results
Failure Rate
DNA was isolated from the FFPE blocks of 13 malignant polyps, each consisting of areas of adenoma and carcinoma (Fig. 1). As a threshold for successful amplification, we considered a minimum yield of more than 1.5 μg of DNA, and whole genome coverage after aCGH. Applying these criteria to our samples, we succeeded in both DNA amplification and subsequent aCGH for all cases.
Influence of Block Age and Degree of DNA Degradation on Isothermal WGA and aCGH Performance
Since it is well known that the age of paraffin blocks affects DNA quality (Srinivasan et al., 2002), we evaluated the influence of this factor on WGA performance. The 26 archival DNA samples were divided into three groups according to their age (0-5 years: n=8, 5-10 years: n=12, >10 years: n=6). Prior to amplification, the integrity of archival DNA was determined by agarose gel analysis, showing that the degree of degradation increases with block age (Fig. 2A).
Figure 2.
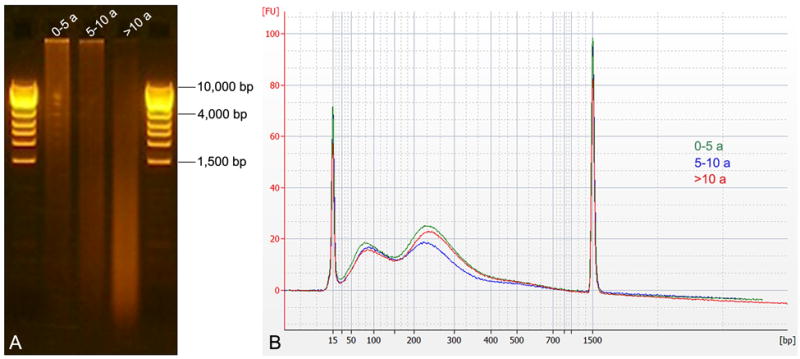
Size distribution of starting material and amplified products. A) Depending on the age of the FFPE block, isolated DNA showed a different degree of degradation, which increased with age (highest in samples >10 years old). B) Regardless of the initial degree of degradation, the Agilent DNA 1000 BioAnalyzer profiles of amplified DNA looked similar.
WGA was performed using an input of 100 ng of isolated DNA. The size of the amplified products was mainly distributed between 50 and 400 bp, and size distributions of amplified DNA were identical as measured with a BioAnalyzer (Agilent), independent of the degree of degradation of the input DNA (Fig. 2B). On average, the newly developed WGA system for FFPE samples yielded 4.01 ± 0.29 μg (mean ± standard deviation (SD)) of DNA, regardless of block age or degree of degradation (Fig. 3A). aCGH performance was evaluated based on the following two QC metrics: Signal-To-Noise Ratio (STNR) and Derivative Log2 Ratio Spread (DLRSpread). The STNR, calculated by dividing signal intensity by background noise, has an important effect on the ability to detect copy number changes. In general, the higher the STNR, the more accurately copy number alterations can be identified (poor signal intensities, or high background noise lower the STNR).
Figure 3.
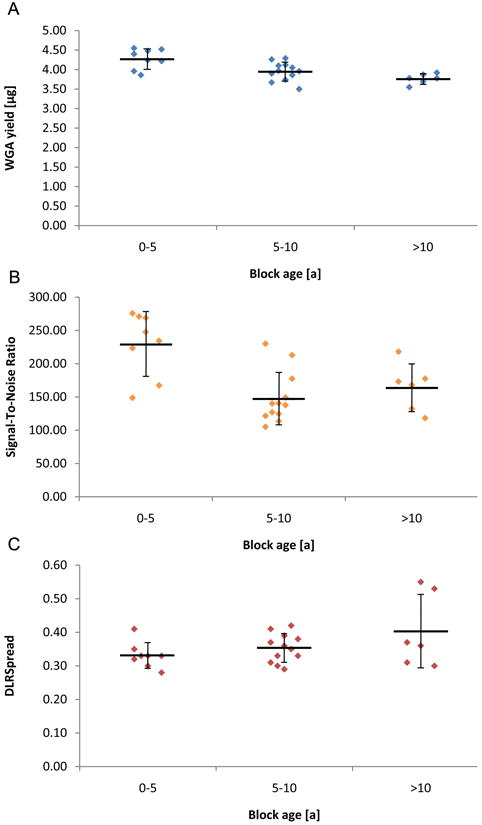
Parameters of whole genome amplification (WGA) and array comparative genomic hybridization (aCGH) as a function of the age of the FFPE blocks (0-5 years: n=8, 5-10 years: n=12, >10 years: n=6). A) Amount of amplified DNA using an input of 100 ng. B) Signal-To-Noise Ratio from aCGH. C) Derivative Log2 Ratio Spread (DLRSpread) from aCGH. Horizontal lines and error bars show mean ± standard deviation.
From our point of view, the most important quality parameter in aCGH is the DLRSpread. The DLRSpread is the SD of the log ratio differences between consecutive probes divided by sqrt(2) and therefore a measure of the probe-to-probe log ratio noise of an array. High DLRSpread values are an indicator for low overall data quality since they make it difficult to detect copy number aberrations. Considering that high DLRSpread values are usually caused by poor DNA quality, the DLRSpread is particularly critical when using FFPE DNA. In summary, the higher the STNR and the lower the DLRSpread, the more accurately copy number changes can be identified.
All 26 CGH microarrays performed with amplified FFPE DNA showed STNR values in the range of “excellent” (>100) (Fig. 3B). The DLRSpread values ranged in “good” (0.20-0.30) or “evaluate” (>0.30), slightly increasing with block age (Fig. 3C). The classification into “excellent”, “good” and “evaluate” was based on QC criteria defined in CGH Analytics (Agilent). Despite the fact that most cases showed only marginal DLRSpread values, all samples resulted in evaluable aCGH aberration profiles and aberration profiles in CGH Analytics (Agilent) were not compromised. In addition, the aCGH profiles generated with amplified FFPE DNA were comparable to the ones with unamplified FFPE DNA (see below).
Identical aCGH Profiles of Amplified and Unamplified FFPE DNA
To exclude that the amplification step itself introduced distortions of the aCGH profiles, matched amplified and unamplified FFPE DNA (n=2) was hybridized to separate CGH microarrays. Analysis of the aberration patterns using CGH Analytics (Agilent) did not reveal any difference between amplified and corresponding unamplified FFPE tumor samples. Both, amplified and unamplified FFPE tumor samples revealed identical aberration patterns (Fig. 4A). All aberrations detected in the unamplified samples, including complex genomic aberration patterns and focal deletions and amplifications, were also reliably detected in the amplified material (Fig. 4B,C).
Figure 4.

Ideograms of chromosomal gains and losses for amplified and unamplified identical FFPE DNA. A) Genome view showing the same aberrations for both amplified (orange) and unamplified (blue) DNA. B,C) Chromosome views of chromosome 17 demonstrate that even small chromosomal aberrations within complex aberration patterns were amplified correctly (B: amplified; C: unamplified).
Patterns of Genomic Imbalances in Adenoma and Carcinoma Areas of Malignant Polyps and Clonal Relationships
We next applied the optimized, newly developed WGA protocol to identify chromosomal aberrations in the adenoma and carcinoma components of 13 malignant polyps. We detected copy number changes in the adenomas in 9 of 13 cases (69%) and in all (13 of 13, 100%) of the carcinomas. Despite the similarity between the frequency plots of genomic imbalances, the carcinomas showed considerably more chromosomal gains and losses (Fig. 5). This was clearly evident when calculating the average number of copy alterations (ANCA) index. The ANCA index, measured by dividing the sum of observed copy number imbalances by the respective number of cases (Ried et al., 1999), amounted to 2.5 in the adenomas and to 7.5 in the carcinomas, indicating increasing genomic instability during tumor progression. The increasing ANCA index was significant for the progression from adenoma to carcinoma (p=0.001). However, this increase was not uniform: while the majority of samples (10 of 13, 77%) showed fewer aberrations in the adenomas than in the carcinomas, three samples (23%) showed an identical number of aberrations, even though the histological evaluation was clearly divergent. Four of those 10 samples (40%) did not show any aberration in the adenoma part. Although the ANCA values of adenomas and carcinomas differed significantly, the aberration patterns of synchronous adenomas and carcinomas in the same patients were similar (Fig. 6). With one exception (loss of chromosome 6 in the adenoma of case number 5, which was not detectable in the carcinoma), all aberrations present in the adenomas were maintained in the respective carcinomas, of course, accompanied by additional aberrations. In summary, these data show the robustness of the methodology by demonstrating a clonal evolution from adenoma to embedded carcinoma within a malignant polyp. This process is driven by the sequential accumulation of genomic imbalances.
Figure 5.

Frequency plot of copy number gains (green) and losses (red) identified by aCGH in adenoma and carcinoma components of malignant polyps.
Figure 6.

Genome views of the adenoma (blue) and carcinoma (red) component of the same malignant polyp. The adenoma component shows losses of 8p, 17p and 18 and gains of 8q and 20. In addition to the aberrations present in the adenoma component, the carcinoma component shows a loss of 16q13-24.3 and gains of 13, 16p and 16q12.1-13.
Gain of 20q is an Important Hallmark Associated with Invasion of Colorectal Cancer
The comparison of adenomas and carcinomas in the same patients, and in identical malignant polyp lesions, afforded us the possibility to dissect the sequence of events required for the sequential transformation of colorectal epithelium. The adenomas frequently showed losses that mapped to chromosome arms 5q and 18q (binomial test p-values 0.01 (5q) and <0.001 (18q)). In the carcinoma components, losses of 8p, 17p, and 18 (binomial test p-values 0.02 (8p), 0.02 (17p), 0.02 (18p) and <0.001 (18q)) and gains of 7, 13, and 20 (0.02 (7), <0.001 (13) and <0.001 (20)) were frequently observed (Table 1). However, after adjusting the p-values for multiple comparisons, loss of 18q remained significant in both adenomas and carcinomas (FDR levels 0.08 and 0.07), whereas only the carcinomas showed a significant gain of 20q (FDR level 0.08). These data suggest that loss of 18q precedes the gain of 20q, and that gain of 20q is associated with progression towards invasiveness (Carvalho et al., 2009).
Table 1. Summary of Gains and Losses.
| Case No. | Entity | Losses | Gains |
|---|---|---|---|
| 1 | A | normal | normal |
| C | 3p14.1-25.3, 4, 8p12-23.3, 10q23.31-25.3, 14, 16, 17p, 18, 19, 20p12.1, 21 | 20p11.1-12, 20p12.1-13, 20q11.21-11.23 | |
| 2 | A | normal | normal |
| C | 8p, 16p12.3-13.3, 17p11.2-13.3, 17q12, 17q21.2-21.31 | 8q, 13, 16p11.2, 17p11.2, 17q11.2-12, 17q21.1-21.2, 17q21.31-24.3 | |
| 3 | A | 8p21.1-23.3, 17p11.2-13.3, 20p12.3-13 | 7, 13, 20q11.21-13.33 |
| C | 4, 8p12-23.3, 8q11.21-11.22, 11, 14, 15, 17p, 18, 20p11.23-13 | 7, 13, 16, 20p11.21-11.23, 20q | |
| 4 | A | normal | normal |
| C | 4, 15q22.31-26.3, 18, 20p | 20q | |
| 5 | A | 5q14.2-23.3 | 6 |
| C | 5q14.2-23.3 | 7, 13q21.1-34 | |
| 6 | A | 1p11.1-22.3, 4, 11q22.1-23.3, 16p12.1-13.3, 16q21-24.3, 18q12.1-23 | 4q12-13.1 |
| C | 1p11.1-22.3, 4, 11q22.1-23.3, 16p12.1-13.3, 16q21-24.3, 18q12.1-23 | 4q12-13.1 | |
| 7 | A | normal | normal |
| C | 18 | 5, 8, 12, 13, 20, X | |
| 8 | A | 5q14.1, 18q12.3-23 | |
| C | 5q14.1, 17p, 18q12.3-23 | ||
| 9 | A | 10q22.3-24.2 | 12p11.1-13.33, 12q12-24.11, 14q24.1 |
| C | 10q22.3-24.2 | 12p11.1-13.33, 12q12-24.11, 14q24.1 | |
| 10 | A | 20p | |
| C | 15q11.2-13.3, 20p, X | ||
| 11 | A | 18q12.2-23 | |
| C | 3p14.2-26.3, 8p, 14q23.1-32.33, 15, 18 | 2q32.2-33.1, 3p11.1-14.2, 3q11.2-13.11, 7, 13, 20 | |
| 12 | A | 8p, 18, 17p | 8q, 20 |
| C | 8p, 16q13-24.3, 17p, 18 | 8q, 13, 16p, 16q12.1-13, 20 | |
| 13 | A | 5q21.3-23.1 | 7, 12, 19, 20, X |
| C | 5q21.3-23.1 | 7, 12, 19, 20, X |
A: Adenoma, C: Carcinoma
Discussion
Archival FFPE tissue samples represent an invaluable resource of tumor material for biomedical research. Importantly, FFPE samples facilitate the retrospective comparison of genetic aberrations with the clinical course, and the establishment of a phenotype/genotype comparison of cancer and its precursor lesions. Accordingly, screening for chromosomal aberrations of DNA extracted from archived lesions by means of aCGH has become an exceedingly important tool in cancer genomics (Speicher et al., 1993; Isola et al., 1994; Ried et al., 1995; Pinkel and Albertson, 2005). However, the use of FFPE samples can be hampered by both limited quality and quantity of DNA. Formalin fixation degrades DNA, and this degradation worsens over time. In addition, obtaining the relatively large quantities of DNA required for high-resolution aCGH can sometimes be rate limiting. This problem, of course, is compounded when small specimens collected through laser capture microdissection or needle biopsies are subject to analysis. Therefore, reliable, reproducible and robust amplification procedures are crucially important.
So far, various WGA techniques (PCR-based and non-PCR-based) have been employed to amplify FFPE DNA for aCGH, but with variable success (Tanabe et al., 2003; Hughes et al., 2005; Johnson et al., 2006; Little et al., 2006; Bosso and Al-Mulla, 2011). In order to overcome this limitation, we assessed the use of a new isothermal WGA method for FFPE DNA and optimized it for aCGH. FFPE DNA from 13 malignant polyps (13 adenoma and 13 carcinoma components) was amplified and analyzed by aCGH. This new amplification procedure produced high-quality DNA (see Materials and Methods for criteria) in all 26 samples used. Starting with 100 ng of isolated FFPE DNA, WGA yielded in all 26 cases sufficient amounts of DNA for aCGH (4.01 ± 0.29 μg, mean ± SD). Subsequent aCGH analyses generated good to excellent results and all aCGH profiles from amplified FFPE DNA could be evaluated. As a control for the uniformity of the WGA procedure, amplified and unamplified DNA from the same sample revealed identical aCGH profiles; we can therefore conclude that this WGA procedure did not introduce any representational bias as measured by aCGH. Thus, our data indicate that our WGA method followed by aCGH provides a promising approach towards studying chromosomal gains and losses in FFPE samples from which only small amounts of DNA can be extracted.
The incentive to optimize this newly developed WGA protocol for aCGH was prompted by the attempt to map chromosomal aberrations during colorectal tumorigenesis in the defined setting of malignant polyps. Analyzing matched adenomas and carcinomas allows for the characterization of the sequel of genomic imbalances in the progression of colorectal cancer (CRC), independent of differences attributable to patients' idiosyncrasies. Analyzing and comparing adenoma and carcinoma part within one lesion is, in our opinion, the most appropriate study design to identify genetic alterations in tumor progression. Towards this goal, we isolated DNA from the non-invasive adenoma and the invasive carcinoma components of 13 malignant polyps. Overall, the observed genomic aberration profiles in all 26 samples were consistent with CGH results from our own group and others (Ried et al., 1996; Meijer et al., 1998; Grade et al., 2006).
The ANCA indices of the adenoma and carcinoma parts from malignant polyps differed significantly (ANCA index of the adenoma components 2.5; ANCA index of the carcinoma components 7.5; p=0.001), supporting evidence that chromosomal imbalances accumulate during CRC progression. The reported ANCA values are similar to those of previous studies (Ried et al., 1999; Habermann et al., 2007; Gaiser et al., 2011).
All chromosomal aberrations that were present in an adenoma component were also present in the associated carcinoma, in which they were accompanied by additional chromosomal aberrations. This sequence of events directly supports a chromosomal progression model in CRC and strongly suggests clonal expansion of premalignant lesions once tumor-initiating aneuploidies were acquired (Vogelstein et al., 1988; Fearon and Vogelstein, 1990; Ried et al., 1999). The fact that all aberrations present in the adenomas were also present in the corresponding carcinomas suggests a clonal origin, whereas the fact that the carcinomas also showed aberrations that were not present in the adenomas points towards an evolution during tumor progression (Klein and Stoecklein, 2009; Stoecklein and Klein, 2010).
Our findings, however, are somewhat discrepant from what was reported by Alcock and colleagues (Alcock et al., 2003). They studied microdissected subregions from 17 CRC cases in order to identify patterns of copy number changes in colorectal tumor progression from adenoma to liver metastasis. In contrast to our data, they found copy number changes in all samples and on every chromosome arm (excluding acrocentric short arms). Each individual sample revealed unique changes, additional to those shared within each case. In other words, all samples (including adenomas) had at least one unique change compared to other samples from the same case. The reasons for this discrepancy are not immediately clear; however, it is somewhat surprising that they observed an average number of chromosomal aberrations in the adenomas that was equal to invasive tumors, and even to liver metastases. Most published data, however, report a continuous destabilization of the genome during tumor progression (Vogelstein et al., 1988; Ried et al., 1996; Meijer et al., 1998; Ried et al., 1999). The degree of aneuploidy also has a direct impact on disease prognosis (Habermann et al., 2009; Schulze and Petersen, 2011).
The chromosomal alterations found in the adenoma and carcinoma components of the 13 malignant polyps targeted certain chromosomes more than others. Notably, three of the 13 adenoma components did not reveal any copy number changes. Since we selected the tumor tissue based on HE sections, it contained mostly (>80%) epithelial cells and it is unlikely that this is due to contamination of tumor tissue with normal cells, stromal cells or lymphocytic infiltrations.
Among the genetic alterations found, 5q and especially the region involving the APC gene was lost in three of 13 (23%) adenoma and corresponding carcinoma components. Remarkably, if present, loss of 5q which is known to be an early event in colorectal tumorigenesis (Boland et al., 1995) could always be observed in both the adenoma and carcinoma component of a malignant polyp and did not occur solely in one of the adenoma or carcinoma components. This suggests in a direct way that a sequence of events underlies the accumulation of chromosomal aberrations during tumor progression and thus provides direct evidence that not only the accumulation of genetic alterations is important but also the sequence in which they occur.
Another frequent alteration in CRC, loss of 18q, could be detected in 4 of 13 (31%) adenoma and 7 of 13 (54%) carcinomas, being statistically significant in both (FDR levels 0.08 and 0.07). This finding is in line with data from the literature (Vogelstein et al., 1988; Boland et al., 1995).
Gain of 20q was detected in 7 of 13 (54%) of the carcinomas (versus 3 of 13 (23%) of the adenomas), thereby reaching a significant level (FDR level 0.08). 20q is frequently gained in CRC and has been associated with colorectal adenoma to carcinoma progression (Carvalho et al., 2009). In contrast to our data, Carvalho and colleagues did not find striking differences for the gain of 20q between the adenoma and carcinoma components of malignant polyps. Independent of their findings in malignant polyps, they also argued for the importance of the gain of 20q based on their aCGH and gene expression results from independent adenoma and carcinoma lesions. Our data at least support an important role for 20q in colorectal adenoma to carcinoma progression.
In conclusion, we showed that isothermally whole genome amplified FFPE DNA is of suitable quality for use in aCGH experiments. The presented approach enabled us to separately analyze DNA by aCGH from adenoma and carcinoma components of malignant polyps. We found that colorectal tumorigenesis is accompanied by the acquisition and maintenance of specific chromosomal imbalances, pointing to the gain of 20q as an indicator for progression from adenoma to carcinoma in malignant polyps.
Acknowledgments
The authors thank Buddy Chen for help with figures and IT-related support and Christoph A. Klein, Chair of Experimental Medicine and Therapy Research, Faculty of Medicine, University of Regensburg, Germany, for providing expert advice. Daniela Hirsch was supported by a scholarship of the RISE program of the German Academic Exchange Service.
Supported by: The Intramural Research Program of the National Institutes of Health, National Cancer Institute.
Footnotes
Conflicts of Interest: DH received travel sponsoring from NuGEN to the AACR Annual Meeting 2011. MS is employed by NuGEN, the manufacturer of the Ovation® WGA FFPE System.
References
- Alcock HE, Stephenson TJ, Royds JA, Hammond DW. Analysis of colorectal tumor progression by microdissection and comparative genomic hybridization. Genes Chromosom Canc. 2003;37:369–380. doi: 10.1002/gcc.10201. [DOI] [PubMed] [Google Scholar]
- Bardi G, Johansson B, Pandis N, Bak-Jensen E, Orndal C, Heim S, Mandahl N, Andren-Sandberg A, Mitelman F. Cytogenetic aberrations in colorectal adenocarcinomas and their correlation with clinicopathologic features. Cancer. 1993;71:306–314. doi: 10.1002/1097-0142(19930115)71:2<306::aid-cncr2820710207>3.0.co;2-c. [DOI] [PubMed] [Google Scholar]
- Bardi G, Johansson B, Pandis N, Mandahl N, Bak-Jensen E, Lindstrom C, Tornqvist A, Frederiksen H, Andren-Sandberg A, Mitelman F, Heim S. Cytogenetic analysis of 52 colorectal carcinomas--non-random aberration pattern and correlation with pathologic parameters. Int J Cancer. 1993;55:422–428. doi: 10.1002/ijc.2910550317. [DOI] [PubMed] [Google Scholar]
- Bardi G, Pandis N, Fenger C, Heim S. Trisomy 7 as the sole cytogenetic aberration in the epithelial component of a colonic adenoma. Cancer Genet Cytogenet. 1995;82:82–84. doi: 10.1016/0165-4608(95)00000-8. [DOI] [PubMed] [Google Scholar]
- Benjamini Y, Hochberg Y. Controlling the False Discovery Rate: A Practical and Powerful Approach to Multiple Testing. J R Stat Soc Series B Stat Methodol. 1995;57:289–300. [Google Scholar]
- Boland CR, Sato J, Appelman HD, Bresalier RS, Feinberg AP. Microallelotyping defines the sequence and tempo of allelic losses at tumour suppressor gene loci during colorectal cancer progression. Nat Med. 1995;1:902–909. doi: 10.1038/nm0995-902. [DOI] [PubMed] [Google Scholar]
- Bosso M, Al-Mulla F. Whole genome amplification of DNA extracted from FFPE tissues. Methods Mol Biol. 2011;724:161–180. doi: 10.1007/978-1-61779-055-3_11. [DOI] [PubMed] [Google Scholar]
- Carvalho B, Postma C, Mongera S, Hopmans E, Diskin S, van de Wiel MA, van Criekinge W, Thas O, Matthai A, Cuesta MA, Terhaar Sive Droste JS, Craanen M, Schrock E, Ylstra B, Meijer GA. Multiple putative oncogenes at the chromosome 20q amplicon contribute to colorectal adenoma to carcinoma progression. Gut. 2009;58:79–89. doi: 10.1136/gut.2007.143065. [DOI] [PubMed] [Google Scholar]
- Fearon ER, Vogelstein B. A genetic model for colorectal tumorigenesis. Cell. 1990;61:759–767. doi: 10.1016/0092-8674(90)90186-i. [DOI] [PubMed] [Google Scholar]
- Gaiser T, Camps J, Meinhardt S, Wangsa D, Nguyen QT, Varma S, Dittfeld C, Kunz-Schughart LA, Kemmerling R, Becker MR, Heselmeyer-Haddad K, Ried T. Genome and transcriptome profiles of CD133-positive colorectal cancer cells. Am J Pathol. 2011;178:1478–1488. doi: 10.1016/j.ajpath.2010.12.036. [DOI] [PMC free article] [PubMed] [Google Scholar]
- Grade M, Becker H, Liersch T, Ried T, Ghadimi BM. Molecular cytogenetics: Genomic imbalances in colorectal cancer and their clinical impact. Cell Oncol. 2006;28:71–84. doi: 10.1155/2006/173815. [DOI] [PMC free article] [PubMed] [Google Scholar]
- Habermann JK, Doering J, Hautaniemi S, Roblick UJ, Bundgen NK, Nicorici D, Kronenwett U, Rathnagiriswaran S, Mettu RK, Ma Y, Kruger S, Bruch HP, Auer G, Guo NL, Ried T. The gene expression signature of genomic instability in breast cancer is an independent predictor of clinical outcome. Int J Cancer. 2009;124:1552–1564. doi: 10.1002/ijc.24017. [DOI] [PMC free article] [PubMed] [Google Scholar]
- Habermann JK, Paulsen U, Roblick UJ, Upender MB, McShane LM, Korn EL, Wangsa D, Kruger S, Duchrow M, Bruch HP, Auer G, Ried T. Stage-specific alterations of the genome, transcriptome, and proteome during colorectal carcinogenesis. Genes Chromosom Canc. 2007;46:10–26. doi: 10.1002/gcc.20382. [DOI] [PubMed] [Google Scholar]
- Heim S, Mitelman F. Cancer Cytogenetics. Hoboken: John Wiley & Sons; 2009. [Google Scholar]
- Hughes S, Arneson N, Done S, Squire J. The use of whole genome amplification in the study of human disease. Prog Biophys Mol Biol. 2005;88:173–189. doi: 10.1016/j.pbiomolbio.2004.01.007. [DOI] [PubMed] [Google Scholar]
- Isola J, DeVries S, Chu L, Ghazrini S, Waldman F. Analysis of changes in DNA sequence copy number by comparative genomic hybridization in archival paraffin-embedded tumor samples. Am J Pathol. 1994;145:1301–1308. [PMC free article] [PubMed] [Google Scholar]
- Johnson NA, Hamoudi RA, Ichimura K, Liu L, Pearson DM, Collins VP, Du MQ. Application of array CGH on archival formalin-fixed paraffin-embedded tissues including small numbers of microdissected cells. Lab Invest. 2006;86:968–978. doi: 10.1038/labinvest.3700441. [DOI] [PMC free article] [PubMed] [Google Scholar]
- Klein CA, Stoecklein NH. Lessons from an aggressive cancer: evolutionary dynamics in esophageal carcinoma. Cancer Res. 2009;69:5285–5288. doi: 10.1158/0008-5472.CAN-08-4586. [DOI] [PubMed] [Google Scholar]
- Little SE, Vuononvirta R, Reis-Filho JS, Natrajan R, Iravani M, Fenwick K, Mackay A, Ashworth A, Pritchard-Jones K, Jones C. Array CGH using whole genome amplification of fresh-frozen and formalin-fixed, paraffin-embedded tumor DNA. Genomics. 2006;87:298–306. doi: 10.1016/j.ygeno.2005.09.019. [DOI] [PubMed] [Google Scholar]
- Meijer GA, Hermsen MA, Baak JP, van Diest PJ, Meuwissen SG, Belien JA, Hoovers JM, Joenje H, Snijders PJ, Walboomers JM. Progression from colorectal adenoma to carcinoma is associated with non-random chromosomal gains as detected by comparative genomic hybridisation. J Clin Pathol. 1998;51:901–909. doi: 10.1136/jcp.51.12.901. [DOI] [PMC free article] [PubMed] [Google Scholar]
- Pinkel D, Albertson DG. Array comparative genomic hybridization and its applications in cancer. Nat Genet. 2005;37(Suppl):S11–17. doi: 10.1038/ng1569. [DOI] [PubMed] [Google Scholar]
- Ried T, Heselmeyer-Haddad K, Blegen H, Schrock E, Auer G. Genomic changes defining the genesis, progression, and malignancy potential in solid human tumors: a phenotype/genotype correlation. Genes Chromosom Canc. 1999;25:195–204. doi: 10.1002/(sici)1098-2264(199907)25:3<195::aid-gcc1>3.0.co;2-8. [DOI] [PubMed] [Google Scholar]
- Ried T, Just KE, Holtgreve-Grez H, du Manoir S, Speicher MR, Schrock E, Latham C, Blegen H, Zetterberg A, Cremer T, Auer G. Comparative genomic hybridization of formalin-fixed, paraffin-embedded breast tumors reveals different patterns of chromosomal gains and losses in fibroadenomas and diploid and aneuploid carcinomas. Cancer Res. 1995;55:5415–5423. [PubMed] [Google Scholar]
- Ried T, Knutzen R, Steinbeck R, Blegen H, Schrock E, Heselmeyer K, du Manoir S, Auer G. Comparative genomic hybridization reveals a specific pattern of chromosomal gains and losses during the genesis of colorectal tumors. Genes Chromosom Canc. 1996;15:234–245. doi: 10.1002/(SICI)1098-2264(199604)15:4<234::AID-GCC5>3.0.CO;2-2. [DOI] [PubMed] [Google Scholar]
- Schulze S, Petersen I. Gender and ploidy in cancer survival. Cell Oncol (Dordr) 2011;34:199–208. doi: 10.1007/s13402-011-0013-0. [DOI] [PMC free article] [PubMed] [Google Scholar]
- Speicher MR, du Manoir S, Schrock E, Holtgreve-Grez H, Schoell B, Lengauer C, Cremer T, Ried T. Molecular cytogenetic analysis of formalin-fixed, paraffin-embedded solid tumors by comparative genomic hybridization after universal DNA-amplification. Hum Mol Genet. 1993;2:1907–1914. doi: 10.1093/hmg/2.11.1907. [DOI] [PubMed] [Google Scholar]
- Srinivasan M, Sedmak D, Jewell S. Effect of fixatives and tissue processing on the content and integrity of nucleic acids. Am J Pathol. 2002;161:1961–1971. doi: 10.1016/S0002-9440(10)64472-0. [DOI] [PMC free article] [PubMed] [Google Scholar]
- Stoecklein NH, Klein CA. Genetic disparity between primary tumours, disseminated tumour cells, and manifest metastasis. Int J Cancer. 2010;126:589–598. doi: 10.1002/ijc.24916. [DOI] [PubMed] [Google Scholar]
- Tanabe C, Aoyagi K, Sakiyama T, Kohno T, Yanagitani N, Akimoto S, Sakamoto M, Sakamoto H, Yokota J, Ohki M, Terada M, Yoshida T, Sasaki H. Evaluation of a whole-genome amplification method based on adaptor-ligation PCR of randomly sheared genomic DNA. Genes Chromosom Canc. 2003;38:168–176. doi: 10.1002/gcc.10269. [DOI] [PubMed] [Google Scholar]
- Vogelstein B, Fearon ER, Hamilton SR, Kern SE, Preisinger AC, Leppert M, Nakamura Y, White R, Smits AM, Bos JL. Genetic alterations during colorectal-tumor development. N Engl J Med. 1988;319:525–532. doi: 10.1056/NEJM198809013190901. [DOI] [PubMed] [Google Scholar]