

Abstract
During waking behavior, animals adapt their state of arousal in response to environmental pressures. Sensory processing is regulated in aroused states, and several lines of evidence imply that this is mediated at least partly by the serotonergic system. However, there is little information directly showing that serotonergic function is required for state-dependent modulation of sensory processing. Here we find that zebrafish larvae can maintain a short-term state of arousal during which neurons in the dorsal raphe modulate sensory responsiveness to behaviorally relevant visual cues. After a brief exposure to water flow, larvae show elevated activity and heightened sensitivity to perceived motion. Calcium imaging of neuronal activity after flow revealed increased activity in serotonergic neurons of the dorsal raphe. Genetic ablation of these neurons abolished the increase in visual sensitivity during arousal without affecting baseline visual function or locomotor activity. We traced projections from the dorsal raphe to a major visual area, the optic tectum. Laser ablation of the tectum demonstrated that this structure, like the dorsal raphe, is required for improved visual sensitivity during arousal. These findings reveal that serotonergic neurons of the dorsal raphe have a state-dependent role in matching sensory responsiveness to behavioral context.
Introduction
Animals are not constantly vigilant but rather modulate their readiness to respond to sensory cues. This is particularly apparent when comparing states of sleep and wakefulness, but, while awake, short-term behavioral states enable the organism to adapt to changing environmental demands. One such state is arousal, in which animals anticipate challenges by showing heightened activity and readiness to respond to sensory stimuli. Increased responsiveness to stimuli across diverse sensory modalities is a hallmark of general arousal, whereas in specific arousal, animals are sensitized to ethologically relevant sensory modalities (for review, see Jing et al., 2009). Precise patterns of neuronal connectivity underlying specific arousal have been described in invertebrates (Weiss et al., 1986; Lebestky et al., 2009), but surprisingly few studies have clearly distinguished general and specific arousal in vertebrates (Garey et al., 2003). In consequence, theories on arousal in vertebrates include arguments that general arousal does not exist (Robbins, 1997), that both general and specific mechanisms contribute to arousal (Garey et al., 2003), and that only a faculty for general arousal is present (Agmo, 2011). To understand the neuronal mechanisms of arousal, it is essential to clearly distinguish between circuits that are activated during general arousal and those that contribute to specific arousal.
Although many brainstem neurotransmitter systems have been implicated in the control of arousal, the interconnectedness of these systems and possible redundancy has made it difficult to parse the contributions of individual neurotransmitter systems to different aspects of arousal. One neurotransmitter system strongly linked to regulation of arousal states across the sleep–wake dimension is the serotonergic system (Trulson and Jacobs, 1979; Geyer, 1996). In mammals, most serotonin-producing neurons reside in the brainstem raphe nuclei and project diffusely throughout the brain (Dahlström and Fuxe, 1964; Steinbusch, 1981). In addition to its effects on arousal, serotonin has been implicated in a variety of behavioral states, including stress, anxiety, aggression, and attention (Edwards and Kravitz, 1997; Gordon and Hen, 2004; Boulougouris and Tsaltas, 2008). Accordingly, it is still unclear whether there is a single unifying function for serotonin in diverse behavioral states.
The relative simplicity and ease of genetic manipulation of the larval zebrafish brain provide an attractive system in which to study vertebrate neuronal circuit function (McLean and Fetcho, 2008). By 5 d post-fertilization (dpf), zebrafish larvae have a wide range of sensorimotor behaviors that, through high-speed video and computational image analysis, can be quantified at a very high level of precision (Portugues and Engert, 2009; Fero et al., 2011). Although sleep and wake states have been defined in zebrafish larvae, the existence of experience-dependent transient changes in level of arousal has not yet been demonstrated. Here we show that such a faculty exists and use behavioral analysis and genetic manipulations to analyze its neuronal substrates. Work in mammals has shown widespread serotonergic modulation of sensory processing (Hurley et al., 2004; Dugué and Mainen, 2009). Our findings build on this to show that the dorsal raphe (DR) has a state-dependent role in modulating sensory responsiveness.
Materials and Methods
Zebrafish lines.
Tübingen long fin strain zebrafish were used in this study. Embryos were raised in E3 medium supplemented with 1.5 mm HEPES, pH 7.3, at 28°C on a 14/10 h light/dark cycle with medium changes every 2 d. Transgenic line Tg(tph2:nfsB-mCherry)y226 was constructed by PCR amplification of a 3408 bp fragment from the tryptophan hydroxylase 2 (tph2; ZDB–GENE–040624-4) promoter (including the first 11 bp of 5′UTR), from Chori bacterial artificial chromosome clone ch211–218c6 using primers 5′-CTGGAAGGGAATCTGCTACG and 5′-TGACACTCTCCTCCCCTGTC, cloned into pCR4–TOPO (Invitrogen), and then subcloned using EcoRI into the UAS:nfsB–mCherry plasmid replacing the 14xUAS element between the EcoRI sites (Davison et al., 2007; Pisharath et al., 2007). Note that this promoter element contains the last intron and two exons of the upstream gene tbc1d15 (see Fig. 3A). Transgenic fish were generated by Tol2 transgenesis (Kawakami, 2004) and bred to isolate single insertions. The tph2 promoter is susceptible to position effect (data not shown), so for Gal4 and nitroreductase stable lines, we screened 10–20 founders to obtain selective expression in the raphe. Each of these lines is also expressed in the spinal cord, but we have not observed movement defects after ablation. Apart from these areas, there is only stochastic transgene expression in rare isolated cells. For genetic ablation, fish expressing the nfsB–mCherry transgene and non-expressing sibling controls were sorted at 3 dpf and treated with 10 mm metronidazole (Sigma) in E3 medium for 48 h under dim light. The bacterial nitroreductase nfsB converts metronidazole into a cell-impermeable cytotoxin (Curado et al., 2007; Pisharath et al., 2007). Larvae were washed twice and kept in fresh E3 medium for at least 24 h before behavioral assays. To detect apoptosis during ablation, larvae were immersed for 1 h in 8 μm PhiPhiLux G1D2 (OncoImmunin) in E3 medium and washed three times before imaging. Laser ablation of labeled fibers in the optic tectum was performed using a MicroPoint pulsed nitrogen laser (Photonic Instruments) as described previously (Burgess et al., 2010). Transgenic line Tg(tph2:Gal4ff)y228 was constructed using the same 3.4 kb fragment but driving Gal4ff (a variant of Gal4 engineered to reduce toxicity) subcloned from pT2KhspGFF (Asakawa et al., 2008). Transgenic line Et(SCP1:Gal4ff)y234 was recovered in an enhancer trap screen (H.A.B., unpublished observations, http://burgesslab.nichd.nih.gov/ubn). By 4 dpf, this line shows strong expression in the trigeminal ganglion and weak expression in the heart and intersegmental vessels of the trunk vasculature. Both Gal4ff-expressing lines were generated using Tol2-mediated transgenesis as above. All in vivo experimental protocols were approved by the local animal care and use committee.
Figure 3.
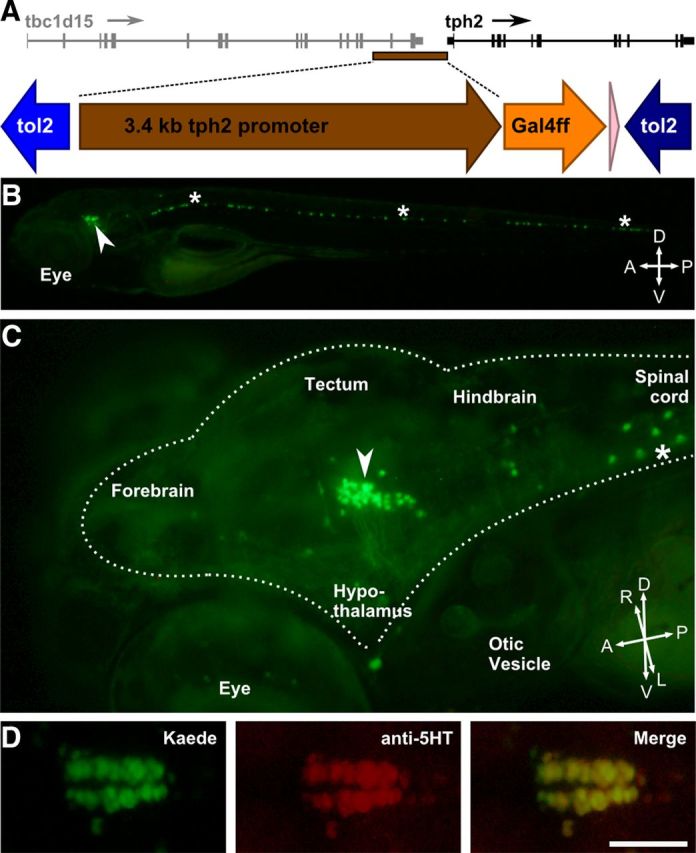
A tph2 promoter fragment labels DR serotonergic neurons. A, Genomic organization of the tph2 gene upstream region from which the 3.4 kb promoter was taken (brown bar) and schematic of the construct used to create the stable transgenic Tg(tph2:Gal4ff)y228 line. B, C, Whole-body lateral (B) and oblique (C) head views of 6 dpf Tg(tph2:Gal4ff)y228; Tg(UAS:Kaede)s1999t double-transgenic larva showing Kaede expression in the ventral midline of the brainstem (arrowheads) and spinal cord (asterisks). Dotted line in C outlines the brain. D, Immunohistochemistry against serotonin (red) confirms that Kaede-expressing cells in the double-transgenic line are serotonergic. Anterior is to the left. The posterior extension of serotonergic neurons that are not labeled in Tg(tph2:Gal4ff)y228 is the inferior raphe. A, Anterior; D, dorsal; L, left; P, posterior; R, right; V, ventral. Scale bar, 50 μm.
Plasmid constructs.
We performed transient transgenic experiments using Tol1 transposase, which recognizes different transposon arms than Tol2 transposase, allowing us to achieve high efficiency of reporter integration without remobilizing the Gal4ff integrated in Tg(tph2:Gal4ff)y228 (Koga et al., 2008). We first modified pDon122 (CosmoBio), which contains Tol1 arms, by adding a 14xUAS element and E1b promoter (Köster and Fraser, 2001) multiple cloning site and ocean pout antifreeze protein poly(A) by standard subcloning techniques (pT1UMP). To make UAS:GCaMP3–v2a–mCherry, we PCR amplified GCaMP3 (Tian et al., 2009) and cloned it in-frame with a v2a–mCherry fusion (Akitake et al., 2011) and then moved the GCaMP3–v2a–mCherry cassette into pT1UMP. To make UAS:lyn–TagRFPT, we synthesized TagRFPT—a variant of red fluorescent protein eqFP578 from Entacmaea quadricolor optimized for photostability (Shaner et al., 2008)—avoiding zebrafish rare codons (Genscript), PCR amplified it adding a lyn kinase membrane targeting sequence (MGCIKSKRKDNLNDDE) (Abankwa and Vogel, 2007) to the 5′ primer, and cloned it into pT1UMP. To make UAS:ChR2–TagRFPT, we synthesized channelrhodopsin2 (ChR2) (Genscript), used overlapping extension PCR to fuse it to TagRFPT in-frame, and cloned it into pT1UMP. For GCaMP3, lyn–TagRFPT, and ChR2–TagRFPT plasmids, the rabbit β-globin intron was PCR amplified and subcloned between the E1b promoter and the translational start. Additional details of construction are available on request. Tol1 mRNA was synthesized using mMessage mMachine SP6 kit (Ambion) from pHel105 (CosmoBio). For Tol1 transgenesis, we injected 80 pg of Tol1 mRNA and 20 ng of plasmid into one-cell-stage embryos.
Stimuli.
All stimuli were delivered using a digital-to-analog card (PCI-6221; National Instruments) with timing controlled by custom software. For electrical stimuli, we modified the protocol used previously for adult zebrafish (Yokogawa et al., 2007) and used the data acquisition (DAQ) card analog output to generate 2-ms-duration square pulses across stainless steel wire mesh electrodes 45 mm apart at opposite edges of the test arena. Light flash stimuli were the brief termination of illuminating white light (150 to <0.1 μW/cm2), lasting 100 or 1000 ms for low- and high-intensity stimuli, respectively. Responsiveness was measured as the proportion of fish executing a large-angle O-bend response within 1 s of the stimulus (Burgess and Granato, 2007b). Acoustic startle responses were elicited using a minishaker (4810; Brüel and Kjær) as described previously (Burgess and Granato, 2007a), with responsiveness measured by the proportion of larvae executing a short-latency C-bend (SLC) response. Stimuli were 2 ms duration. Intensity was calibrated using a Reed VB-8200 Digital Vibration Meter (Calright). For optomotor stimuli, moving sine-wave gratings generated by custom software were produced by a projector (P2 Pico projector; AAXA) and reflected onto a diffusing screen below the test chamber via mirror (see Fig. 2A). Except when otherwise specified, optomotor stimuli were 5.8 mm wavelength, contrast ratio of 50 (white bars, 65μW/cm2; black bars, 1.3 μW/cm2), and velocity of 0.05–2 Hz (0.29–11.8 mm/s) and lasted for 10 s. Turn bias is a measure of the fidelity with which turn maneuvers orient larvae in the direction of motion of the optomotor stimulus. It is calculated as the percentage of turns in which the bend improves alignment with direction of stimulus motion (%TurnTarget) scaled to between −100 and +100 using the formula %TurnTarget × 2 − 100 such that a score of +100 means that all turns are in the direction of the optomotor stimulus and −100 means in the opposing direction. The flow chamber was printed in acrylonitrile–butadiene–styrene (ABS) plastic using a uPrint rapid prototyping machine (Statasys) and then treated with acetone for 30 s to seal against water penetration. The water flow stimulus was generated by a Masterflex L/S with Easy-Load II pump (Cole-Palmer) for 60 s at a flow rate 160 ml/min except when otherwise specified. When testing flow-induced arousal, baseline responsiveness was tested 25 or 30 min after larvae were introduced to the flow chamber, and aroused responsiveness was probed 3 min after the flow stimulus. In all tests, the chamber was mounted on a translucent plastic diffuser with an infrared array below providing illumination (IR100; YY Trade). Behavioral experiments were conducted on 5–7 dpf larvae, well before the onset of sexual differentiation at 3 weeks. Larvae were light adapted for at least 1 h to a light intensity on the holding platform that was the same as on the testing platform with light calibration using a ILT1400A radiometer (International Light).
Figure 2.

Visual sensitivity is selectively modulated by exposure to water flow. A, Flow chamber for testing activity and sensory thresholds. Optomotor stimuli are projected onto the diffuser using a mirror. Leads attached to grids enable electric stimuli. LED mounted above the chamber for visible illumination and flash responses. To test responsiveness, larvae were left in the chamber for 25 min before recording baselines, exposed to a 60 s flow stimulus at 30 min, and retested 3 min after flow. B, C, Responsiveness was measured to an electric stimulus (B) (n = 7 × 20) and a light flash stimulus (C) (n = 9 × 20). D, To test touch responsiveness, larvae expressing ChR2 in the trigeminal ganglion were exposed to five brief blue light pulses before and after water flow (open circles; n = 10 larvae) or before and after an equivalent delay without water flow (“no flow”) to control for habituation (filled circles; n = 11 larvae). E, Average orientation during the first 10 s of water flow. Orientation is the offset (0–180°) from the direction opposite to flow. Larvae orient more quickly to a second exposure to water flow, 3 min after the termination of the first exposure (open circles) than to the initial exposure (filled circles). F, Proportion of larvae in orientation bins (30 ° each) relative to flow direction, 5 s after flow stimulus starts, for first exposure (top) and second exposure (bottom). *p < 0.05 compared with the same orientation at first flow exposure. G, Rate of orienting during the OMR. The proportion of larvae (n = 19 × 20) oriented in the quadrant matching the direction of visual flow was measured throughout stimulus presentation and rate of increase calculated in baseline state (filled circles) or after exposure to flow (open circles). *p < 0.001. H, Turn bias during the OMR. Larvae (n = 23 × 20) were tested in baseline state (filled circles) and then after flow (open circles). *p < 0.05. Graphs show mean and SEM.
Behavioral quantification.
Image stacks for fish behavioral analysis were collected using a Photron FastCam-X 1024 PCI high-speed camera (Tech Imaging) at 1000 frames per second (fps), 512 × 512 pixel resolution and analyzed using Flote tracking software (Burgess and Granato, 2007b). To track groups of free-swimming larvae continuously over long periods of time without resorting to confining individual larvae in small chambers in a grid, we created a real-time tracking system. The tracking system is a C++ implementation of algorithms previously written for multi-larva tracking in Interactive Data Language, incorporated as a new module in our event control software used previously to generate acoustic startle stimuli with the National Instruments DAQ card (Burgess and Granato, 2007a). Video images are acquired at 50 fps from a μEye camera (IDS-5220SE-M; 1stVision). After each 400 ms window, the initial and final position and orientation of each larva is saved, as well as the maximal swim velocity. Maximum swim velocity and total displacement are used to determine whether a larva initiated a swimming movement during the window or whether it remained stationary. We validated the accuracy of the real-time tracking code by comparing it with Flote using a set of prerecorded video images. The real-time code produced very similar measures of larval displacement across a wide range of activity levels (23 groups of larvae imaged for 16 s each, mean displacement for real-time code and Flote correlated with Spearman's ρ = 0.97). A hazard of using swim velocity and displacement to categorize swim versus stationary events is that changes in larval kinematics could affect accuracy. We therefore compared estimates of larval activity during dark adaptation, in which both swim initiation frequency and kinematics vary significantly. Both algorithms produced similar measures of swim initiations (six groups of larvae imaged at four time points during dark adaptation, repeated-measures ANOVA shows no main effect of analysis method, F(1,8) = 0.67, p = 0.80). Measurements of locomotor activity are the average proportion of larvae initiating a swim movement in each 400 ms window, across the recording period for each data point (159 such windows over each 60 s interval).
For ChR2-elicited “head-touch” responses, we injected UAS:ChR2–TagRFPT into transgenic line Et(SCP1:Gal4ff)y234. At 4 dpf, we prescreened larvae in nine-well grids to identify double-transgenic larvae that showed large-angle C-bend responses within 30 ms of a 0.83 mW/mm2, 48 ms duration, 62.5 Hz light pulse from a high-power blue LED (UHP-Mic-LED-460; Prizmatix). Responding larvae were head immobilized at 5 dpf as for calcium imaging (see below) and mounted on a Axioimager.A1 compound microscope (Carl Zeiss) with the condenser removed and replaced by a μEye camera with an Infinigage CW imaging lens (Edmunds) to record tail movements. After 25 min, larvae were tested with five light pulses at 30 s intervals for baseline responsiveness. Larvae were then exposed to water flow (see below) and 2 min later tested with a second set of five light pulses. Light pulses were 62.5 Hz, 48 ms, 13.4 mW/mm2 with the LED focused through a 10× objective onto the head. Tail movements initiated within 30 ms of the stimulus were scored as ChR2-evoked responses, because non-expressing larvae never responded within this timeframe (n = 12 larvae, 20 stimuli each).
Immunohistochemistry.
Larvae were anesthetized with tricaine and then fixed in 4% paraformaldehyde. Dissected brains were treated with 1 mg/ml collagenase for 45 min at room temperature. Primary antibodies used were against 5-HT (MAB352, 1:200, Millipore, Bedford, MA), TagRFP (NC9044899, 1:200; Thermo Fisher Scientific), dsRed (632496, 1:200; Clontech), and GFP (G6795, 1:400; Sigma). Primary antibodies were detected by Alexa Fluor 488-, Alexa Fluor 546-, or Alexa Fluor 594-conjugated secondary antibodies (1:200; Invitrogen). For counterstains, we used Hoechst 33342 (H1399; Invitrogen).
Calcium imaging.
Fish were embedded in 3% low-melt agarose on a 3 cm Petri dish. Agarose was removed caudal to the pectoral fins to allow tail movements. The dish was transferred to a microflow stimulus chamber printed in ABS plastic using a uPrint (see Fig. 4A). Water was ejected onto the tail at a 90° angle, 200 μl/s for 10 s using a Solenoid Micro Pump 100 (Cole-Parmer). To verify that this stimulus produces arousal in embedded larvae, tail-beat movements of embedded larvae were recorded for 8 min, 4 min before and after the microflow stimulus. Movies were tracked by Flote, and the number of swim bouts was counted manually by examining the curvature trace for each fish. GCaMP3-expressing cells were scanned with 20× or 40× water-immersion lenses every 10 s using a confocal microscope (Fluoview FV1000; Olympus). In each experiment, fish were kept on the stage for at least 20 min before scanning. The fluorescence intensity ratio (R) of GCaMP3 and mCherry was calculated using NIH ImageJ, and ΔR/Rm was calculated using FreeMat using the formula described in Results.
Figure 4.

Calcium imaging of DR neurons during flow-induced arousal. A, Schematic of microscope mountable flow chamber. Larvae are head embedded and stimulated with water ejected from a solenoid water pump. Both input and output tube openings are set inside water in a 3 cm Petri dish. B, Dorsal view of DR neurons in Tg(tph2:Gal4ff)y228 transgenic fish injected with UAS:GCaMP3–v2a–mCherry. Anterior is to the top. GCaMP3 and mCherry are expressed mosaically but in the same DR cells. C, Time series for a single neuron. Flow exposure is at time 0. GCaMP3 but not mCherry fluorescence transiently increases after flow. D, Cumulative distribution of ΔR/Rm from 93 individual neurons for 1 min before (pre-flow) and after (post-flow) water-flow stimulus. E, Average ΔR/Rm for neurons responding to the flow stimulus (top trace; n = 28) and not responding (bottom trace; n = 65). Thick and thin lines indicate mean and SEM. Flow stimulus was applied for 10 s (dotted rectangle). *p < 0.05 compared with baseline activity.
Statistical analyses.
n reported in the text refers to either the number of larvae when tested individually (e.g., n = 8 larvae) or to the number of groups of larvae, with the number of larvae per group also reported (e.g., n = 8 × 20). Thus, (n = 8 × 20) means 8 groups of 20 larvae were used, so for statistical purposes n = 8. Data reported in the text are mean and SEM. SPSS was used for statistical analysis. Comparison between groups was performed by two-way ANOVA and significant results followed by Bonferroni's-corrected t tests between groups when appropriate.
Results
Short-term changes in locomotor activity
We first sought to establish whether larval zebrafish modulate their internal state in a manner consistent with short-term arousal. One hallmark of arousal is a persistent change in behavior that endures beyond the termination of a stimulus (Jing et al., 2009). In a previous study, we noted that, after transfer to the testing arena, larval activity is depressed for 2 min (Burgess and Granato, 2007b). We speculated that this might reflect a change in internal state and performed a detailed characterization of larval activity after transfer. Locomotor activity occurred in three phases: initial low-level locomotor activity (0–2 min), a phase of high activity (2–15 min), and finally a steady level of moderate baseline activity (Fig. 1A). To determine what cues trigger this pattern of locomotor activity after transfer, we tested sensory stimuli in isolation. Many visual stimuli elicit robust responses in zebrafish larvae, but none that we tested produced a change in activity that persisted beyond the presentation of the stimulus (Fig. 1B, Loom, Opto., Flash). An intense vibrational stimulus provoked a lasting reduction in activity similar to the first phase seen after transfer (paired t test, t(4) = 3.37, p = 0.028), but this was not followed by a high-activity state (Fig. 1B, Vibration). Because larvae were moved in the Petri dish in which they were raised and because illumination and temperature in the testing arena were carefully matched to the holding area, we considered it unlikely that changes in activity were triggered by thermal cues or changes in water chemistry. Exposure to water flow for 30 s induced a state of increased activity lasting several minutes, similar to the high-activity state induced by transfer (paired t test, t(7) = 4.39, p = 0.003) (Fig. 1B, Flow). Activity induced by water flow was proportional to the duration of exposure (ANOVA, F(3,15) = 26.3, p < 0.001) (Fig. 1C) but not to the intensity of the flow stimulus (F(3,18) = 0.29, p = 0.83) (Fig. 1D).
Figure 1.

Exposure to water flow induces a state of increased locomotor activity. A, Frequency of swim initiation after movement from a holding area to the testing arena (diagrammed in the inset). Epochs of activity patterns are indicated. Black line and shaded area show mean and SEM (n = 6 × 25). *p < 0.05 compared with baseline. B, Change from baseline activity after exposure to sensory cues. Larvae were left on the testing arena for 30 min before testing. Baseline is the mean swim initiation frequency in the 5 min before testing. Responsiveness during the presentation of the stimulus was not recorded, so these graphs do not show acute responses to the stimuli tested. Vibration, 500 ms duration, 10 Hz vertical acceleration, 62 m/s2 peak (n = 5 × 25). Loom, A shadow (contrast ratio of 18:1) moves across arena at 20 mm/s (n = 11 × 25). Optomotor (Opto), 30 s duration, 10 mm grating width, 2 Hz frequency, 18:1 contrast ratio (n = 7 × 20). Light Flash, 30 s dark pulse from baseline illumination at 150 μW/cm2 (n = 7 × 20). Flow, 45 s water flow, 40 ml/min (n = 8 × 20). C, D, Activity is proportional to the duration (C) but not to the velocity (D) of the flow stimulus. Trials were 20 min apart, with measurements taken of the locomotor activity during the 3 min before (black circles) and after (gray circles) each stimulus and activity for each before/after pair normalized so that the average before-flow value was set to 100. To test duration, flow velocity was held at 40 ml/min (n = 6 × 20). To test velocity, flow duration was 30 s (n = 7 × 20). #p < 0.05, *p < 0.01 for paired t tests. E, Kinematic analysis of swimming. The gray bar marks 15 s flow stimulus at 30 min. Pairwise comparisons are to baseline movement at 25 min (circles, n = 8 × 20). *p < 0.05. Graphs show mean and SEM. F, Total displacement generated by swim bouts with pairwise comparisons as for E.
High-speed video imaging allowed us to more precisely quantify changes from baseline swimming (Burgess and Granato, 2007b). Both transfer and water flow elevated locomotor activity by increasing the frequency of initiating normal swimming movements: slow swims (scoots; ANOVA, F(3,28) = 8.8, p < 0.001) and routine turns (R-turns; F(3,28) = 6.0, p = 0.003) (Fig. 1E). Larvae also swam further during each slow swim bout (Fig. 1F; F(3,28) = 3.6, p = 0.025), which we found was attributable to an increase in the frequency of tail bends (F(3,28) = 20.7, p < 0.001) rather than greater tail-bend amplitude (F(3,28) = 0.80, p = 0.50) or longer swim bouts (F(3,28) = 1.12, p = 0.36). Brief exposure to water flow or physical dish movement thus both induce a long-lasting increase in locomotor activity in zebrafish larvae that persists beyond the termination of the stimulus, consistent with a state of arousal.
Sensory responsiveness during elevated activity
A characteristic feature of arousal is the modulation of sensory thresholds in diverse modalities, including for acoustic startle responses (Witvliet and Vrana, 1995; Hubbard et al., 2011). We therefore compared sensorimotor reflexes during baseline and high-activity states. No change in sensitivity to electroshock (ANOVA, F(1,24) = 0.36, p = 0.55) (Fig. 2B) or light flash stimuli (F(1,32) = 0.16, p = 0.68) (Fig. 2C) were found during the high-activity state induced by flow. Similarly, transfer did not alter acoustic startle (F(1,28) = 0.36, p = 0.55) or electroshock thresholds (F(1,28) = 0.07, p = 0.78), but active-state larvae were more responsive to a light flash (main effect of state, F(1,20) = 8.8, p = 0.008). To simulate a head-touch stimulus while avoiding the difficulty of reproducibly applying a mechanical stimulus, we used an optogenetic approach similar to previous studies in zebrafish embryos (Douglass et al., 2008). We used enhancer trap line Et(SCP1:Gal4ff)y234 that expresses Gal4 in the trigeminal ganglion to drive expression of the light-activated ion channel ChR2, using a UAS:ChR2–TagRFPT transgene. Brief blue light pulses elicited SLC (<30 ms) responses in double-transgenic larvae kinematically very similar to head-touch responses (change in head angle during initial C-bend for head-touch responses, 164 ± 1.7°; for ChR2 responses, 157 ± 12.6°; two-sample t test, t(4.1) = 0.52, p = 0.63, n = 5 larvae each). Such responses were never seen in larvae not expressing ChR2 (n = 8 larvae). Flow did not alter responsiveness to the ChR2 evoked “touch” stimulus (paired t test, t(9) = 1.00, p = 0.34, n = 10 larvae) (Fig. 2D). Larvae thus do not show a general increase in sensory responsiveness during high-activity states.
We next asked whether exposure to water flow sensitized larvae to the flow stimulus itself. When exposed to water flow, larvae perform counter-current swimming, aligning themselves against the direction of water flow, so as to be facing “upstream.” Larvae oriented more rapidly to the second presentation of the flow stimulus (repeated-measures ANOVA, F(1,320) = 11.2, p = 0.001) (Fig. 2E), such that, after 5 s of water flow, three times as many larvae were aligned directly against the current (Wilcoxon's Z = −2.1, p = 0.036) (Fig. 2F). Because counter-current swimming in fish is primarily a response to the perception of forward motion of the visual field (Lyon, 1904; Montgomery et al., 1997), we next tested sensitivity to whole-field motion. A moving pattern of dark and light bars provokes an optomotor response (OMR) in zebrafish larvae in which the fish swim in the direction of motion of the grating (Orger et al., 2000). Consistent with sensitization to the flow stimulus, we found that, after exposure to water flow, larvae oriented more quickly in the direction of motion of a weak optomotor stimulus (paired t test, t(18) = 3.23, p = 0.004) (Fig. 2G). A faster orienting response could occur simply because larvae are more active after the flow stimulus. To address this, we measured the accuracy of orienting turn movements. During the OMR, larvae align themselves in the direction of perceived motion by initiating directionally appropriate tail flexions (Orger et al., 2008). Turns induced by the weak optomotor stimulus showed a significantly greater directional bias after exposure to the flow stimulus (t test, t(55) = 2.1, p = 0.04) (Fig. 2H). Thus, the faster orienting during the OMR is not a nonspecific consequence of elevated motor activity but is attributable to heightened sensitivity to the direction of visual motion. The combination of increased movement and heightened sensory responsiveness, each persisting beyond the termination of a stimulus, is characteristic of a short-term state of arousal (Garey et al., 2003). The increase in responsiveness was selective to visual motion among the sensory stimuli that we tested, indicating that flow establishes a state of specific rather than general arousal and that flow does not simply induce a widespread increase in CNS excitability.
Calcium imaging of raphe neurons
The arousal state system is thought to involve diverse neurotransmitter systems, primarily located in the brainstem (Pfaff et al., 2008). Several of these systems converge on the DR nucleus to excite serotonergic neurons (Brown et al., 2002), and stimulation of the DR modulates sensory responsiveness in mammals (Andersen and Dafny, 1982; Petzold et al., 2009). We therefore cloned a 3.4 kb fragment of the promoter for the tph2 gene, which is normally expressed in the anterior-most portion of the zebrafish raphe (Teraoka et al., 2004; Lillesaar et al., 2007) and used it to drive a Gal4ff reporter (Asakawa et al., 2008) in a stable transgenic line Tg(tph2:Gal4ff)y228 (Fig. 3A). To visualize Gal4 expression, we used a Tg(UAS:Kaede)s1999t reporter line (Davison et al., 2007). In 6 dpf double-transgenic fish, a group of 42 ± 1.5 neurons (n = 5 larvae) express Kaede in the rostral midline of the hindbrain with additional expression in a column of ventral neurons in the spinal cord (Fig. 3B,C). We confirmed that the hindbrain expression was the DR by colocalization with serotonin immunohistochemistry, which showed that 89 ± 4% of serotonergic neurons in the DR coexpressed Kaede (n = 5 larvae) (Fig. 3D).
We next sought to monitor the activity of neurons in the DR during arousal by using the fluorescent calcium reporter GCaMP3 (Tian et al., 2009). For activity recording in restrained fish, we designed a microscope-compatible flow chamber in which the head of the larva was embedded for calcium imaging, while the tail was free to move and could be monitored with a high-speed camera (Fig. 4A). Stimulating the tail with water flow elicited a 57% increase in the number of tail-movement bouts during the 4 min after flow relative to the baseline 4 min before flow (baseline, 33.1 ± 8.1; after flow, 52.2 ± 14.4; paired t test, t(17) = 2.62, p = 0.018, n = 18 larvae) similar to flow-induced activity in free-swimming larvae (Fig. 1B). For recording neuronal activity, we injected a Tol1-based 14xUAS:GCaMP3–v2a–mCherry reporter plasmid into Tg(tph2:Gal4ff)y228 to create transient double-transgenic fish. The v2a sequence ensures stoichiometric coexpression of GCaMP3 and mCherry and allows calculation of the ratio of GFP/RFP fluorescence (R). This permits us to reliably measure changes in calcium while avoiding fluorescent intensity artifacts generated by slight movements of the fish within the plane of focus (Fig. 4B,C). Because the reporter was expressed mosaically, we could identify and measure activity in single cells within the DR. For each cell and time point, we calculated the normalized percentage change in fluorescence ratio ΔR/Rm. Rm is the mean fluorescence ratio during the 5 min before flow. Rt is the fluorescence ratio at time point t. ΔR/Rm = 100 × (Rt − Rm)/Rm. The distribution of ΔR/Rm values shifted rightward after the flow stimulus, indicating that at least some cells increase activity (Fig. 4D).
To identify activated neurons, we set a ΔR/Rm threshold of 26.47%, corresponding to 2 SDs from the mean ΔR/Rm for all measurements in the baseline period. By this criterion, flow elicited activity in 28 of 93 neurons measured (Fig. 4E; maximal ΔR/Rm = 89 ± 12.6%, from 18 larvae). Mean activity in the responding cohort remained significantly above baseline levels 80 s after exposure to flow (ΔR/Rm = 8.7 ± 3.5%, paired t test against baseline, p = 0.03). We did not detect any effect of position on activity within the anteroposterior axis of the DR (data not shown). Thus, a brief exposure to water flow induces a persistent increase in activity in DR neurons, consistent with a role for these neurons in regulating arousal.
Raphe ablation
We next asked whether DR neurons are required to maintain the arousal state. We generated transgenic line Tg(tph2:nfsB-mCherry)y226 using the tph2 promoter fragment to drive expression of a nitroreductase–mCherry fusion gene. At 6 dpf in this line, mCherry was expressed in 51 ± 4.5 neurons in the DR (n = 5 larvae). The bacterial nitroreductase nfsB metabolizes metronidazole into a cell-impermeable cytotoxin, allowing cell-specific and temporally controlled ablation (Curado et al., 2007; Pisharath et al., 2007) (Fig. 5A). After 14 h of metronidazole treatment, we detected apoptosis in the DR using the TUNEL assay (data not shown) and PhiPhiLux G1D2, a live fluorescent reporter of caspase-3-like activity (Fig. 5B) (Packard and Komoriya, 2008). After 48 h of treatment with metronidazole, DR neurons were selectively ablated as confirmed by loss of mCherry expression and the absence of DR immunostaining with anti-serotonin antibody, whereas other populations of serotonergic neurons remained intact (Fig. 5C).
Figure 5.

Ablation of the DR blocks enhanced visual sensitivity during arousal. A, Timeline for experiments using metronidazole to ablate the DR in Tg(tph2:nfsB-mCherry)y226 fish. B, Detection of activated caspase-3 during ablation using PhiPhiLux G1D2 (green) reveals ongoing apoptosis selectively in DR mCherry-positive cells in metronidazole-treated (right) but not vehicle-treated (left) larvae. Scale bar, 25 μm. C, Confocal stacks in control (left) and metronidazole-ablated (right) fish. Immunohistochemistry against mCherry (red) and serotonin (green). Scale bar, 50 μm. D, Locomotor activity of control (gray) and ablated (red) fish (n = 9 × 20). A 60 s flow stimulus was applied at 30 min (dotted line). E, F, Turn bias in response to optomotor stimuli presented 5 min before (E) and 3 min after (F) the flow stimulus in control (black) and ablated (red) larvae (n = 14 × 20). *p < 0.05. G, Turn bias of the OMR during transfer arousal in control (black) and DR-ablated (red) larvae (n = 9 × 25). *p < 0.05, **p < 0.001. Graphs show mean and SEM.
After ablation, larvae showed normal baseline locomotor activity (control, 39.1 ± 3.6; ablated, 38.8 ± 4.7; t(16) = 0.07, p = 0.94) (Fig. 5D, 25–30 min) and no change in responsiveness to either acoustic startle stimuli (ANOVA, no effect of ablation, F(1,101) = 0.024, p = 0.874, n = 27 larvae) or to a light flash stimulus (ANOVA, no effect of ablation, F(1,16) = 0.23, p = 0.638, n = 5 × 20), showing that ablation of the DR does not generally decrease larval responsiveness. Moreover, both flow and transfer robustly elicited an increase in locomotor activity in ablated larvae similar to controls (increased activity for flow in controls, 54.1 ± 2.9%; ablated, 53.1 ± 4.1%; t test, t(16) = 0.06, p = 0.95; for transfer in controls, 66.4 ± 3.5%; ablated, 52.9 ± 5.3%, t(16) = 0.68, p = 0.51), indicating that the DR is not required for this aspect of arousal (Fig. 5D). Ablated fish showed a similar pattern of OMR responsiveness to siblings when tested in the baseline state, with no appreciable orientation to the weakest stimulus tested (turn bias for weak stimulus controls, −1.9 ± 10.4; ablated, 4.7 ± 13.5; t(28) = 0.42, p = 0.68) (Fig. 5E). As found previously, after exposure to a flow stimulus to induce arousal, sibling controls showed enhanced sensitivity to a weak optomotor stimulus. In contrast, no such improvement was observed in ablated fish (turn bias controls, 33.3 ± 13.5; ablated, −8.9 ± 13.8; t(26) = 2.19, p = 0.038) (Fig. 5F). Similar results were obtained when DR-ablated fish were tested during transfer arousal, with ablated fish showing greatly reduced sensitivity to weak optomotor stimuli (turn bias controls, 32.0 ± 4.2; ablated, 4.1 ± 5.2; t(16) = 4.19, p < 0.001) (Fig. 5G). Thus, the DR is not necessary for the increase in locomotor activity that occurs during flow-induced arousal but is required for state-dependent modulation of responsiveness to visual motion.
Raphe–tectal connection
We next asked how the DR modulates optomotor responsiveness during arousal. Several studies have shown widespread patterns of serotonin immunoreactivity within the developing zebrafish brain (McLean and Fetcho, 2004; Sallinen et al., 2009), but only a single report has examined efferent connections from serotonergic nuclei (Lillesaar et al., 2009). One target of the DR nucleus in mammals is the superior colliculus (Villar et al., 1988), the homolog of the fish optic tectum, a visual processing structure shown previously to be required for orienting during predation and phototaxis (Gahtan et al., 2005; Burgess et al., 2010). We therefore examined the projection of DR neurons by injecting a UAS-driven membrane-tagged TagRFPT reporter into Tg(tph2:Gal4ff)y228 (Fig. 6A,C). To unambiguously identify the tectum, we used the transgenic line Tg(ath5:GFP), which labels retinal ganglion cells projecting to the tectum (Masai et al., 2003) (Fig. 6B,E). Confocal imaging confirmed that DR neurons project to the optic tectum, with fibers overlapping with retinotectal afferents in the stratum fibrosum et griseum superficiale and also present in the stratum opticum and stratum album centrale (n = 12 larvae) (Fig. 6F).
Figure 6.

The optic tectum receives DR input and is required for accurate responding to a weak visual stimulus. Optic tectum in double-transgenic Tg(tph2:Gal4ff); Tg(ath5:GFP) larvae injected with UAS:lyn–TagRFPT. A–C, Dorsal confocal stack through the tectal neuropil. D–F, Single sagittal confocal section. G, Schematic showing the location of the image planes. Green represents retinotectal projections. IR, Inferior raphe; TeO, optic tectum; RGC, retinal ganglion cells. A, D, TagRFPT labels projections from the DR (anti-TagRFP, red). B, E, GFP labels retinal ganglion cell axons in the tectum (anti-GFP, green). C, Overlap from dorsal view with TeO outlined. Scale bar, 100 μm. F, DR projections are found throughout the tectal neuropil layers, including in the stratum fibrosum et griseum superficiale (SFGS), stratum opticum (SO), and stratum album centrale (SAC). Scale bar, 20 μm. H, I, Turn bias during the OMR under baseline conditions (H) and during transfer arousal (I) for control (black) and optic tectum-ablated (red) larvae (n = 6). Graphs show mean and SEM. *p < 0.05.
Despite the conserved role of the tectum in triggering orienting movements, previous reports have shown that neither severe genetic disruption nor laser ablation of retinotectal afferents to the optic tectum impair the OMR in zebrafish larvae (Neuhauss et al., 1999; Roeser and Baier, 2003). It is therefore generally thought that the OMR is primarily subserved by one of the other nine brain regions that receive input from retinal ganglion cells (Portugues and Engert, 2009). However, previous work did not account for effects of arousal or stimulus strength. We laser ablated both lobes of the optic tectum using GFP-expressing retinotectal afferents as a guide (Roeser and Baier, 2003). Consistent with the previous studies, orienting responses to optomotor stimuli were unimpaired for ablated larvae in the baseline state (Fig. 6H), confirming that the visual circuit that primarily mediates the OMR is normally sufficient for this behavior. However, unlike controls, ablated larvae did not show enhanced responsiveness to weak OMR stimuli during arousal, indicating that the optic tectum is required for the improved sensitivity observed in this state (ANOVA, turn bias controls, F(1,10) = 0.57, p = 0.038; ablated, F(1,10) = 0.99, p = 0.34) (Fig. 6I). The anatomical connection between the DR and tectum and the similar effect of ablation on orienting responses suggests that, during flow-induced arousal, the DR may activate tectal circuitry that can process visual motion cues too weak to engage the primary OMR circuit.
Discussion
Animals show both regular oscillations in arousal during sleep–wake cycles and short-term increases in arousal in response to environmental demands during the wake state. Previous work has established that zebrafish larvae show behavioral states with characteristic features of sleep and wake (Zhdanova et al., 2001; Prober et al., 2006). Here we provide the first evidence that zebrafish larvae also modulate arousal levels during the wake state. In mammals, in which behavioral criteria can be confirmed by independent electrophysiological indices, arousal has been defined as an internal state that persists after the sensory cue that elicits it is no longer present and is characterized by increased mobility and reduced sensory thresholds (Garey et al., 2003; Jing et al., 2009). These criteria have been widely applied in invertebrate species to identify states of arousal. Consistent with these criteria, flow-induced arousal in zebrafish larvae lasts for 5–10 min after water flow ceases and includes increased mobility and responsiveness to visual motion. Vision is the primary modality used to guide counter-current swimming in fish (Lyon, 1904; Montgomery et al., 1997). When pushed backward by the current, fish swim forward to stabilize the apparent motion of the visual world. We find that, during arousal, larvae more rapidly orient during counter-current swimming, an effect that is explained by heightened sensitivity to whole-field visual motion. During flow-induced arousal, larvae are not more responsive to all sensory stimuli, showing that this is not a state of general arousal but a state of specific arousal that may promote the behavioral goal of survival in flowing water.
Locomotor activity and stimulus responsiveness are behaviorally distinct aspects of arousal, suggesting that different neural circuits are coordinately modulated during this state. The brainstem state system that mediates arousal is composed of several neurotransmitter systems that ascend from brainstem to diffusely innervate many brain regions (for review, see Pfaff et al., 2008). Although it has long been suggested that these neurotransmitter systems should either have distinct functions or be activated during different contexts (Robbins, 1997), it has proven difficult to assign unique contributions of neurotransmitter systems to aspects of arousal. In mammals, the baseline activity of neurons in the DR nucleus shows a strong association with behavioral state, whereas transient changes in firing rates are tightly linked to sensory, motor, and reward events (Le Moal and Olds, 1979; Nakamura et al., 2008; Ranade and Mainen, 2009). Consistent with a role in short-term arousal states, firing rates are higher during active or task-engaged wake states than during quiet wakefulness (Trulson and Jacobs, 1979; Fornal et al., 1996; Sakai, 2011) and are reduced during sleep (McGinty and Harper, 1976). Likewise, calcium imaging demonstrated that a subpopulation of serotonergic DR neurons in zebrafish are activated during the short-term flow-induced arousal state. This finding lead us to analyze the contribution of DR neurons to short-term arousal, a question that has been difficult to address in mammals.
In mammals, serotonin influences the electrophysiological properties of many neuronal cell types, including neurons involved in sensory circuits (Kayama et al., 1989; Fitzgerald and Sanes, 1999; Monckton and McCormick, 2002; Liu et al., 2012). Pharmacological manipulation of serotonergic signaling alters the response profile of neurons to sensory stimuli in several modalities (Waterhouse et al., 1990; Ebert and Ostwald, 1992; Hurley and Pollak, 1999; Petzold et al., 2009), and direct electrical stimulation of the DR has been shown to modulate neuronal responsiveness to acoustic, mechanosensory, and olfactory cues (Andersen and Dafny, 1982; Sheibani and Farazifard, 2006; Petzold et al., 2009). A few studies have also demonstrated that behavioral responses to sensory cues are altered by serotonergic signaling, but these have primarily relied on gross lesions or broad-acting pharmacological manipulations (Tenen, 1967; Davis et al., 1980). As noted above, DR activity correlates strongly with different arousal states, and suppression of activity disrupts the highly synchronized oscillations in cortex and hippocampus that occur during attentive states (Fonoff et al., 1999; Womelsdorf and Fries, 2007). Together, these findings have suggested the hypothesis that the DR contributes to changes in sensory thresholds that accompany different behavioral states (Hurley et al., 2004; Petzold et al., 2009; Hurley and Hall, 2011), but there is little work directly linking state-dependent DR activity to sensory modulation (Hall et al., 2010). Here we provide evidence that this is indeed the case, showing that the DR is not only activated during flow-induced arousal but also required in this state to modulate responsiveness to a behaviorally relevant visual stimulus. Because our data show that the DR is not required for the heightened locomotor activity that occurs during flow-induced arousal, we conclude that it plays a specific role in adjusting a sensory threshold in this state.
Acoustic, electroshock, light flash, and mechanosensory responsiveness were not modulated during the short-term arousal states analyzed here, but it is possible that other sensory modalities are affected. In the olfactory bulb of mice, it has been suggested that elevated DR activity serves to reduce sensory gain to maintain a normal dynamic range despite the increased breathing and sniffing associated with behavioral arousal (Petzold et al., 2009). Similarly, during flow-induced arousal in zebrafish, elevated locomotor activity likely increases odorant availability at the olfactory epithelium; thus, DR activity may reduce olfactory gain in the aroused state. Experiments analyzing behavioral or olfactory neuron responses to odorants may resolve this question.
Because the optic tectum is required for orienting during predation and phototaxis in zebrafish larvae, we sought to establish whether it may also enhance orienting to weak optomotor stimuli during flow-induced arousal. We first asked whether the tectum receives an input from the DR. Direct innervation of the superior colliculus by neurons of the DR is well established in mammals (Moore et al., 1978), and the homologous connection between optic tectum and DR has been traced in frogs (Zhao and Debski, 2005). Serotonergic fibers have also been described in the optic tectum of zebrafish (Kah and Chambolle, 1983; Kaslin and Panula, 2001), but the source of this input is less clear. Our finding that DR neurons project to the optic tectum in zebrafish is at odds with a recent report that did not find such a connection, tracing connections of the raphe nucleus using Pet1:GFP transgenic fish (Lillesaar et al., 2009). Not all tph2 neurons in the DR express Pet1; thus, it is possible that these tph2+, pet1− cells are the source of the tectal innervation (Lillesaar et al., 2007). An open question is how serotonergic input shapes tectal processing. In mammals, activation of the DR suppresses retinotectal input to the superior colliculus, facilitating the control of collicular responses by corticotectal projections (Mooney et al., 1996). In frogs, the effect of serotonin in the optic tectum depends on its site of action, because it both suppresses responses to retinal input and reduces inhibitory interactions between tectal neurons (Malayev and Debski, 1998). We found that DR neurons project to both the retinotectal input layer and deep neuropil layers of the tectum. Our working model is thus that, during flow-induced arousal, serotonergic disinhibition of tectal neurons facilitates responses to weak optomotor stimuli, enabling larvae to respond to cues that are too weak to engage the primary OMR circuit. However, whether the DR modulates tectal neuron function directly or through indirect pathways remains to be established.
Our data support the idea that the diverse neurotransmitter systems that are active during arousal may in fact have highly specialized roles in maintaining different aspects of the arousal state. In this model, the DR would be coordinately activated with other systems but function primarily to dynamically modulate sensory responsiveness to relevant stimuli. Our findings confirm that the DR does in fact have a state-dependent role in regulating sensory processing, showing that, during a mode of specific arousal, the DR is required for enhanced sensitivity to an environmentally relevant sensory cue.
Footnotes
This work was supported by the Intramural Research Program of the National Institute of Child Health and Human Development and a research fellowship from the Japan Society of the Promotion of Science (T.Y.).
References
- Abankwa D, Vogel H. A fret map of membrane anchors suggests distinct microdomains of heterotrimeric g proteins. J Cell Sci. 2007;120:2953–2962. doi: 10.1242/jcs.001404. [DOI] [PubMed] [Google Scholar]
- Agmo A. On the intricate relationship between sexual motivation and arousal. Horm Behav. 2011;59:681–688. doi: 10.1016/j.yhbeh.2010.08.013. [DOI] [PubMed] [Google Scholar]
- Akitake CM, Macurak M, Halpern ME, Goll MG. Transgenerational analysis of transcriptional silencing in zebrafish. Dev Biol. 2011;352:191–201. doi: 10.1016/j.ydbio.2011.01.002. [DOI] [PMC free article] [PubMed] [Google Scholar]
- Andersen E, Dafny N. Dorsal raphe nucleus modulates sensory evoked responses in caudate and septum. Int J Neurosci. 1982;17:151–155. doi: 10.3109/00207458208985917. [DOI] [PubMed] [Google Scholar]
- Asakawa K, Suster ML, Mizusawa K, Nagayoshi S, Kotani T, Urasaki A, Kishimoto Y, Hibi M, Kawakami K. Genetic dissection of neural circuits by Tol2 transposon-mediated Gal4 gene and enhancer trapping in zebrafish. Proc Natl Acad Sci U S A. 2008;105:1255–1260. doi: 10.1073/pnas.0704963105. [DOI] [PMC free article] [PubMed] [Google Scholar]
- Boulougouris V, Tsaltas E. Serotonergic and dopaminergic modulation of attentional processes. Prog Brain Res. 2008;172:517–542. doi: 10.1016/S0079-6123(08)00925-4. [DOI] [PubMed] [Google Scholar]
- Brown RE, Sergeeva OA, Eriksson KS, Haas HL. Convergent excitation of dorsal raphe serotonin neurons by multiple arousal systems (orexin/hypocretin, histamine and noradrenaline) J Neurosci. 2002;22:8850–8859. doi: 10.1523/JNEUROSCI.22-20-08850.2002. [DOI] [PMC free article] [PubMed] [Google Scholar]
- Burgess HA, Granato M. Sensorimotor gating in larval zebrafish. J Neurosci. 2007a;27:4984–4994. doi: 10.1523/JNEUROSCI.0615-07.2007. [DOI] [PMC free article] [PubMed] [Google Scholar]
- Burgess HA, Granato M. Modulation of locomotor activity in larval zebrafish during light adaptation. J Exp Biol. 2007b;210:2526–2539. doi: 10.1242/jeb.003939. [DOI] [PubMed] [Google Scholar]
- Burgess HA, Schoch H, Granato M. Distinct retinal pathways drive spatial orientation behaviors in zebrafish navigation. Curr Biol. 2010;20:381–386. doi: 10.1016/j.cub.2010.01.022. [DOI] [PMC free article] [PubMed] [Google Scholar]
- Curado S, Anderson RM, Jungblut B, Mumm J, Schroeter E, Stainier DY. Conditional targeted cell ablation in zebrafish: a new tool for regeneration studies. Dev Dyn. 2007;236:1025–1035. doi: 10.1002/dvdy.21100. [DOI] [PubMed] [Google Scholar]
- Dahlström A, Fuxe K. Evidence for the existence of monoamine-containing neurons in the central nervous system. I. Demonstration of monoamines in the cell bodies of brain stem neurons. Acta Physiol Scand Suppl. 1964;232:5–55. [PubMed] [Google Scholar]
- Davis M, Strachan DI, Kass E. Excitatory and inhibitory effects of serotonin on sensorimotor reactivity measured with acoustic startle. Science. 1980;209:521–523. doi: 10.1126/science.7394520. [DOI] [PubMed] [Google Scholar]
- Davison JM, Akitake CM, Goll MG, Rhee JM, Gosse N, Baier H, Halpern ME, Leach SD, Parsons MJ. Transactivation from Gal4-VP16 transgenic insertions for tissue-specific cell labeling and ablation in zebrafish. Dev Biol. 2007;304:811–824. doi: 10.1016/j.ydbio.2007.01.033. [DOI] [PMC free article] [PubMed] [Google Scholar]
- Douglass AD, Kraves S, Deisseroth K, Schier AF, Engert F. Escape behavior elicited by single, channelrhodopsin-2-evoked spikes in zebrafish somatosensory neurons. Curr Biol. 2008;18:1133–1137. doi: 10.1016/j.cub.2008.06.077. [DOI] [PMC free article] [PubMed] [Google Scholar]
- Dugué GP, Mainen ZF. How serotonin gates olfactory information flow. Nat Neurosci. 2009;12:673–675. doi: 10.1038/nn0609-673. [DOI] [PubMed] [Google Scholar]
- Ebert U, Ostwald J. Serotonin modulates auditory information processing in the cochlear nucleus of the rat. Neurosci Lett. 1992;145:51–54. doi: 10.1016/0304-3940(92)90201-h. [DOI] [PubMed] [Google Scholar]
- Edwards DH, Kravitz EA. Serotonin, social status and aggression. Curr Opin Neurobiol. 1997;7:812–819. doi: 10.1016/s0959-4388(97)80140-7. [DOI] [PubMed] [Google Scholar]
- Fero K, Yokogawa T, Burgess HA. The behavioral repertoire of larval zebrafish. In: Kalueff A, Cachat J, editors. Zebrafish models in neurobehavioral research. New York: Springer; 2011. pp. 249–291. [Google Scholar]
- Fitzgerald KK, Sanes DH. Serotonergic modulation of synapses in the developing gerbil lateral superior olive. J Neurophysiol. 1999;81:2743–2752. doi: 10.1152/jn.1999.81.6.2743. [DOI] [PubMed] [Google Scholar]
- Fonoff ET, Silva CP, Ballester G, Timo-Iaria C. Electro-oscillographic correlation between dorsal raphe nucleus, neocortex and hippocampus during wakefulness before and after serotoninergic inactivation. Braz J Med Biol Res. 1999;32:469–472. doi: 10.1590/s0100-879x1999000400015. [DOI] [PubMed] [Google Scholar]
- Fornal CA, Metzler CW, Marrosu F, Ribiero-do-Valle LE, Jacobs BL. A subgroup of dorsal raphe serotonergic neurons in the cat is strongly activated during oral-buccal movements. Brain Res. 1996;716:123–133. doi: 10.1016/0006-8993(96)00006-6. [DOI] [PubMed] [Google Scholar]
- Gahtan E, Tanger P, Baier H. Visual prey capture in larval zebrafish is controlled by identified reticulospinal neurons downstream of the tectum. J Neurosci. 2005;25:9294–9303. doi: 10.1523/JNEUROSCI.2678-05.2005. [DOI] [PMC free article] [PubMed] [Google Scholar]
- Garey J, Goodwillie A, Frohlich J, Morgan M, Gustafsson JA, Smithies O, Korach KS, Ogawa S, Pfaff DW. Genetic contributions to generalized arousal of brain and behavior. Proc Natl Acad Sci U S A. 2003;100:11019–11022. doi: 10.1073/pnas.1633773100. [DOI] [PMC free article] [PubMed] [Google Scholar]
- Geyer MA. Serotonergic functions in arousal and motor activity. Behav Brain Res. 1996;73:31–35. doi: 10.1016/0166-4328(96)00065-4. [DOI] [PubMed] [Google Scholar]
- Gordon JA, Hen R. The serotonergic system and anxiety. Neuromolecular Med. 2004;5:27–40. doi: 10.1385/NMM:5:1:027. [DOI] [PubMed] [Google Scholar]
- Hall IC, Rebec GV, Hurley LM. Serotonin in the inferior colliculus fluctuates with behavioral state and environmental stimuli. J Exp Biol. 2010;213:1009–1017. doi: 10.1242/jeb.035956. [DOI] [PMC free article] [PubMed] [Google Scholar]
- Hubbard CS, Ornitz E, Gaspar JX, Smith S, Amin J, Labus JS, Kilpatrick LA, Rhudy JL, Mayer EA, Naliboff BD. Modulation of nociceptive and acoustic startle responses to an unpredictable threat in men and women. Pain. 2011;152:1632–1640. doi: 10.1016/j.pain.2011.03.001. [DOI] [PMC free article] [PubMed] [Google Scholar]
- Hurley LM, Hall IC. Context-dependent modulation of auditory processing by serotonin. Hear Res. 2011;279:74–84. doi: 10.1016/j.heares.2010.12.015. [DOI] [PMC free article] [PubMed] [Google Scholar]
- Hurley LM, Pollak GD. Serotonin differentially modulates responses to tones and frequency-modulated sweeps in the inferior colliculus. J Neurosci. 1999;19:8071–8082. doi: 10.1523/JNEUROSCI.19-18-08071.1999. [DOI] [PMC free article] [PubMed] [Google Scholar]
- Hurley LM, Devilbiss DM, Waterhouse BD. A matter of focus: monoaminergic modulation of stimulus coding in mammalian sensory networks. Curr Opin Neurobiol. 2004;14:488–495. doi: 10.1016/j.conb.2004.06.007. [DOI] [PubMed] [Google Scholar]
- Jing J, Gillette R, Weiss KR. Evolving concepts of arousal: Insights from simple model systems. Rev Neurosci. 2009;20:405–427. doi: 10.1515/revneuro.2009.20.5-6.405. [DOI] [PubMed] [Google Scholar]
- Kah O, Chambolle P. Serotonin in the brain of the goldfish, Carassius auratus. An immunocytochemical study. Cell Tissue Res. 1983;234:319–333. doi: 10.1007/BF00213771. [DOI] [PubMed] [Google Scholar]
- Kaslin J, Panula P. Comparative anatomy of the histaminergic and other aminergic systems in zebrafish (Danio rerio) J Comp Neurol. 2001;440:342–377. doi: 10.1002/cne.1390. [DOI] [PubMed] [Google Scholar]
- Kawakami K. Transgenesis and gene trap methods in zebrafish by using the Tol2 transposable element. Methods Cell Biol. 2004;77:201–222. doi: 10.1016/s0091-679x(04)77011-9. [DOI] [PubMed] [Google Scholar]
- Kayama Y, Shimada S, Hishikawa Y, Ogawa T. Effects of stimulating the dorsal raphe nucleus of the rat on neuronal activity in the dorsal lateral geniculate nucleus. Brain Res. 1989;489:1–11. doi: 10.1016/0006-8993(89)90002-4. [DOI] [PubMed] [Google Scholar]
- Koga A, Cheah FS, Hamaguchi S, Yeo GH, Chong SS. Germline transgenesis of zebrafish using the medaka Tol1 transposon system. Dev Dyn. 2008;237:2466–2474. doi: 10.1002/dvdy.21688. [DOI] [PubMed] [Google Scholar]
- Köster RW, Fraser SE. Tracing transgene expression in living zebrafish embryos. Dev Biol. 2001;233:329–346. doi: 10.1006/dbio.2001.0242. [DOI] [PubMed] [Google Scholar]
- Lebestky T, Chang JS, Dankert H, Zelnik L, Kim YC, Han KA, Wolf FW, Perona P, Anderson DJ. Two different forms of arousal in Drosophila are oppositely regulated by the dopamine d1 receptor ortholog DopR via distinct neural circuits. Neuron. 2009;64:522–536. doi: 10.1016/j.neuron.2009.09.031. [DOI] [PMC free article] [PubMed] [Google Scholar]
- Le Moal M, Olds ME. Peripheral auditory input to the midbrain limbic area and related structures. Brain Res. 1979;167:1–17. doi: 10.1016/0006-8993(79)90259-2. [DOI] [PubMed] [Google Scholar]
- Lillesaar C, Tannhäuser B, Stigloher C, Kremmer E, Bally-Cuif L. The serotonergic phenotype is acquired by converging genetic mechanisms within the zebrafish central nervous system. Dev Dyn. 2007;236:1072–1084. doi: 10.1002/dvdy.21095. [DOI] [PubMed] [Google Scholar]
- Lillesaar C, Stigloher C, Tannhäuser B, Wullimann MF, Bally-Cuif L. Axonal projections originating from raphe serotonergic neurons in the developing and adult zebrafish, Danio rerio, using transgenics to visualize raphe-specific pet1 expression. J Comp Neurol. 2009;512:158–182. doi: 10.1002/cne.21887. [DOI] [PubMed] [Google Scholar]
- Liu S, Aungst JL, Puche AC, Shipley MT. Serotonin modulates the population activity profile of olfactory bulb external tufted cells. J Neurophysiol. 2012;107:473–483. doi: 10.1152/jn.00741.2011. [DOI] [PMC free article] [PubMed] [Google Scholar]
- Lyon EP. On rheotropism. I. Rheotropism in fishes. Am J Physiol. 1904;12:149–161. [Google Scholar]
- Malayev AA, Debski EA. Serotonin modulates induced synaptic activity in the optic tectum of the frog. Brain Res. 1998;781:167–181. doi: 10.1016/s0006-8993(97)01230-4. [DOI] [PubMed] [Google Scholar]
- Masai I, Lele Z, Yamaguchi M, Komori A, Nakata A, Nishiwaki Y, Wada H, Tanaka H, Nojima Y, Hammerschmidt M, Wilson SW, Okamoto H. N-cadherin mediates retinal lamination, maintenance of forebrain compartments and patterning of retinal neurites. Development. 2003;130:2479–2494. doi: 10.1242/dev.00465. [DOI] [PubMed] [Google Scholar]
- McGinty DJ, Harper RM. Dorsal raphe neurons: depression of firing during sleep in cats. Brain Res. 1976;101:569–575. doi: 10.1016/0006-8993(76)90480-7. [DOI] [PubMed] [Google Scholar]
- McLean DL, Fetcho JR. Ontogeny and innervation patterns of dopaminergic, noradrenergic, and serotonergic neurons in larval zebrafish. J Comp Neurol. 2004;480:38–56. doi: 10.1002/cne.20280. [DOI] [PubMed] [Google Scholar]
- McLean DL, Fetcho JR. Using imaging and genetics in zebrafish to study developing spinal circuits in vivo. Dev Neurobiol. 2008;68:817–834. doi: 10.1002/dneu.20617. [DOI] [PMC free article] [PubMed] [Google Scholar]
- Monckton JE, McCormick DA. Neuromodulatory role of serotonin in the ferret thalamus. J Neurophysiol. 2002;87:2124–2136. doi: 10.1152/jn.00650.2001. [DOI] [PubMed] [Google Scholar]
- Montgomery JC, Baker CF, Carton AG. The lateral line can mediate rheotaxis in fish. Nature. 1997;389:960–963. [Google Scholar]
- Mooney RD, Huang X, Shi MY, Bennett-Clarke CA, Rhoades RW. Serotonin modulates retinotectal and corticotectal convergence in the superior colliculus. Prog Brain Res. 1996;112:57–69. doi: 10.1016/s0079-6123(08)63320-8. [DOI] [PubMed] [Google Scholar]
- Moore RY, Halaris AE, Jones BE. Serotonin neurons of the midbrain raphe: ascending projections. J Comp Neurol. 1978;180:417–438. doi: 10.1002/cne.901800302. [DOI] [PubMed] [Google Scholar]
- Nakamura K, Matsumoto M, Hikosaka O. Reward-dependent modulation of neuronal activity in the primate dorsal raphe nucleus. J Neurosci. 2008;28:5331–5343. doi: 10.1523/JNEUROSCI.0021-08.2008. [DOI] [PMC free article] [PubMed] [Google Scholar]
- Neuhauss SC, Biehlmaier O, Seeliger MW, Das T, Kohler K, Harris WA, Baier H. Genetic disorders of vision revealed by a behavioral screen of 400 essential loci in zebrafish. J Neurosci. 1999;19:8603–8615. doi: 10.1523/JNEUROSCI.19-19-08603.1999. [DOI] [PMC free article] [PubMed] [Google Scholar]
- Orger MB, Smear MC, Anstis SM, Baier H. Perception of Fourier and non-Fourier motion by larval zebrafish. Nat Neurosci. 2000;3:1128–1133. doi: 10.1038/80649. [DOI] [PubMed] [Google Scholar]
- Orger MB, Kampff AR, Severi KE, Bollmann JH, Engert F. Control of visually guided behavior by distinct populations of spinal projection neurons. Nat Neurosci. 2008;11:327–333. doi: 10.1038/nn2048. [DOI] [PMC free article] [PubMed] [Google Scholar]
- Packard BZ, Komoriya A. Intracellular protease activation in apoptosis and cell-mediated cytotoxicity characterized by cell-permeable fluorogenic protease substrates. Cell Res. 2008;18:238–247. doi: 10.1038/cr.2008.17. [DOI] [PubMed] [Google Scholar]
- Petzold GC, Hagiwara A, Murthy VN. Serotonergic modulation of odor input to the mammalian olfactory bulb. Nat Neurosci. 2009;12:784–791. doi: 10.1038/nn.2335. [DOI] [PubMed] [Google Scholar]
- Pfaff D, Ribeiro A, Matthews J, Kow LM. Concepts and mechanisms of generalized central nervous system arousal. Ann N Y Acad Sci. 2008;1129:11–25. doi: 10.1196/annals.1417.019. [DOI] [PubMed] [Google Scholar]
- Pisharath H, Rhee JM, Swanson MA, Leach SD, Parsons MJ. Targeted ablation of beta cells in the embryonic zebrafish pancreas using E. coli nitroreductase. Mech Dev. 2007;124:218–229. doi: 10.1016/j.mod.2006.11.005. [DOI] [PMC free article] [PubMed] [Google Scholar]
- Portugues R, Engert F. The neural basis of visual behaviors in the larval zebrafish. Curr Opin Neurobiol. 2009;19:644–647. doi: 10.1016/j.conb.2009.10.007. [DOI] [PMC free article] [PubMed] [Google Scholar]
- Prober DA, Rihel J, Onah AA, Sung RJ, Schier AF. Hypocretin/orexin overexpression induces an insomnia-like phenotype in zebrafish. J Neurosci. 2006;26:13400–13410. doi: 10.1523/JNEUROSCI.4332-06.2006. [DOI] [PMC free article] [PubMed] [Google Scholar]
- Ranade SP, Mainen ZF. Transient firing of dorsal raphe neurons encodes diverse and specific sensory, motor, and reward events. J Neurophysiol. 2009;102:3026–3037. doi: 10.1152/jn.00507.2009. [DOI] [PubMed] [Google Scholar]
- Robbins TW. Arousal systems and attentional processes. Biol Psychol. 1997;45:57–71. doi: 10.1016/s0301-0511(96)05222-2. [DOI] [PubMed] [Google Scholar]
- Roeser T, Baier H. Visuomotor behaviors in larval zebrafish after GFP-guided laser ablation of the optic tectum. J Neurosci. 2003;23:3726–3734. doi: 10.1523/JNEUROSCI.23-09-03726.2003. [DOI] [PMC free article] [PubMed] [Google Scholar]
- Sakai K. Sleep-waking discharge profiles of dorsal raphe nucleus neurons in mice. Neuroscience. 2011;197:200–224. doi: 10.1016/j.neuroscience.2011.09.024. [DOI] [PubMed] [Google Scholar]
- Sallinen V, Sundvik M, Reenilä I, Peitsaro N, Khrustalyov D, Anichtchik O, Toleikyte G, Kaslin J, Panula P. Hyperserotonergic phenotype after monoamine oxidase inhibition in larval zebrafish. J Neurochem. 2009;109:403–415. doi: 10.1111/j.1471-4159.2009.05986.x. [DOI] [PubMed] [Google Scholar]
- Shaner NC, Lin MZ, McKeown MR, Steinbach PA, Hazelwood KL, Davidson MW, Tsien RY. Improving the photostability of bright monomeric orange and red fluorescent proteins. Nat Methods. 2008;5:545–551. doi: 10.1038/nmeth.1209. [DOI] [PMC free article] [PubMed] [Google Scholar]
- Sheibani V, Farazifard R. Dorsal raphe nucleus stimulation modulates the response of layers IV and V barrel cortical neurons in rat. Brain Res Bull. 2006;68:430–435. doi: 10.1016/j.brainresbull.2005.09.017. [DOI] [PubMed] [Google Scholar]
- Steinbusch HW. Distribution of serotonin-immunoreactivity in the central nervous system of the rat—cell bodies and terminals. Neuroscience. 1981;6:557–618. doi: 10.1016/0306-4522(81)90146-9. [DOI] [PubMed] [Google Scholar]
- Tenen SS. The effects of p-chlorophenylalanine, a serotonin depletor, on avoidance acquisition, pain sensitivity and related behavior in the rat. Psychopharmacology. 1967;10:204–219. doi: 10.1007/BF00401382. [DOI] [PubMed] [Google Scholar]
- Teraoka H, Russell C, Regan J, Chandrasekhar A, Concha ML, Yokoyama R, Higashi K, Take-Uchi M, Dong W, Hiraga T, Holder N, Wilson SW. Hedgehog and Fgf signaling pathways regulate the development of tphR-expressing serotonergic raphe neurons in zebrafish embryos. J Neurobiol. 2004;60:275–288. doi: 10.1002/neu.20023. [DOI] [PMC free article] [PubMed] [Google Scholar]
- Tian L, Hires SA, Mao T, Huber D, Chiappe ME, Chalasani SH, Petreanu L, Akerboom J, McKinney SA, Schreiter ER, Bargmann CI, Jayaraman V, Svoboda K, Looger LL. Imaging neural activity in worms, flies and mice with improved GCaMP calcium indicators. Nat Methods. 2009;6:875–881. doi: 10.1038/nmeth.1398. [DOI] [PMC free article] [PubMed] [Google Scholar]
- Trulson ME, Jacobs BL. Raphe unit activity in freely moving cats: correlation with level of behavioral arousal. Brain Res. 1979;163:135–150. doi: 10.1016/0006-8993(79)90157-4. [DOI] [PubMed] [Google Scholar]
- Villar MJ, Vitale ML, Hökfelt T, Verhofstad AA. Dorsal raphe serotoninergic branching neurons projecting both to the lateral geniculate body and superior colliculus: a combined retrograde tracing-immunohistochemical study in the rat. J Comp Neurol. 1988;277:126–140. doi: 10.1002/cne.902770109. [DOI] [PubMed] [Google Scholar]
- Waterhouse BD, Azizi SA, Burne RA, Woodward DJ. Modulation of rat cortical area 17 neuronal responses to moving visual stimuli during norepinephrine and serotonin microiontophoresis. Brain Res. 1990;514:276–292. doi: 10.1016/0006-8993(90)91422-d. [DOI] [PubMed] [Google Scholar]
- Weiss KR, Chiel HJ, Koch U, Kupfermann I. Activity of an identified histaminergic neuron, and its possible role in arousal of feeding behavior in semi-intact Aplysia. J Neurosci. 1986;6:2403–2415. doi: 10.1523/JNEUROSCI.06-08-02403.1986. [DOI] [PMC free article] [PubMed] [Google Scholar]
- Witvliet CV, Vrana SR. Psychophysiological responses as indices of affective dimensions. Psychophysiology. 1995;32:436–443. doi: 10.1111/j.1469-8986.1995.tb02094.x. [DOI] [PubMed] [Google Scholar]
- Womelsdorf T, Fries P. The role of neuronal synchronization in selective attention. Curr Opin Neurobiol. 2007;17:154–160. doi: 10.1016/j.conb.2007.02.002. [DOI] [PubMed] [Google Scholar]
- Yokogawa T, Marin W, Faraco J, Pezeron G, Appelbaum L, Zhang J, Rosa F, Mourrain P, Mignot E. Characterization of sleep in zebrafish and insomnia in hypocretin receptor mutants. PLoS Biol. 2007;5:e277. doi: 10.1371/journal.pbio.0050277. [DOI] [PMC free article] [PubMed] [Google Scholar]
- Zhao B, Debski EA. Serotonergic reticular formation cells in Rana pipiens: categorization, development, and tectal projections. J Comp Neurol. 2005;487:441–456. doi: 10.1002/cne.20593. [DOI] [PubMed] [Google Scholar]
- Zhdanova IV, Wang SY, Leclair OU, Danilova NP. Melatonin promotes sleep-like state in zebrafish. Brain Res. 2001;903:263–268. doi: 10.1016/s0006-8993(01)02444-1. [DOI] [PubMed] [Google Scholar]