

Abstract
Malaria parasite prevalence in endemic populations is an essential indicator for monitoring the progress of malaria control, and has traditionally been assessed by microscopy. However, surveys increasingly use sensitive molecular methods that detect higher numbers of infected individuals, questioning our understanding of the true infection burden and resources required to reduce it. Here we analyse a series of data sets to characterize the distribution and epidemiological factors associated with low-density, submicroscopic infections. We show that submicroscopic parasite carriage is common in adults, in low-endemic settings and in chronic infections. We find a strong, non-linear relationship between microscopy and PCR prevalence in population surveys (n=106), and provide a tool to relate these measures. When transmission reaches very low levels, submicroscopic carriers are estimated to be the source of 20–50% of all human-to-mosquito transmissions. Our findings challenge the idea that individuals with little previous malaria exposure have insufficient immunity to control parasitaemia and suggest a role for molecular screening.
 Malaria can persist at levels that escape detection by standard microscopy, but can be detected by PCR. Okell et al. now show that rates of submicroscopic infection can be predicted using more widely available microscopy data, and are most epidemiologically significant in areas with low malaria transmission.
Measuring the prevalence of malaria infection in population surveys underpins surveillance and control of the parasite. During more than a century of malaria research, parasite infection has been assessed by light microscopy of blood films. This wealth of data is widely used to understand malaria epidemiology, to monitor and inform control strategy1, to map the geographical distribution of malaria over time2 and to aid development of mathematical models. Rapid diagnostic tests (RDTs) based on antigen detection are now also used for prevalence surveys. However, both techniques have limited sensitivity. Molecular detection techniques for malaria3 have a much higher sensitivity and are increasingly revealing the widespread presence of infections with parasite densities below the detection threshold of either microscopy or RDTs. These results fundamentally challenge our current view of malaria epidemiology and burden of infection.
In a previous systematic review and meta-analysis we found that microscopy misses on average half of all Plasmodium falciparum infections in endemic areas compared with PCR4. There was high variability between surveys and transmission settings. It remains unclear what factors cause this variation in levels of submicroscopic infections, and to what extent such infections are relevant to current efforts to control and eliminate the parasite. From a clinical perspective, low-density infection has been associated with mild anaemia5 and adverse effects during pregnancy6, but rarely causes acute symptoms. Nevertheless, the public health importance of low-density infections may be significant, as experiments have shown that mosquitoes feeding on individuals who are parasite-negative by microscopy can become infected with malaria7,8.
The probability of detecting malarial infection is a function of the density of parasites and the volume of blood examined. Parasite densities in the peripheral blood fluctuate considerably over the course of any single P. falciparum infection and may dip under the microscopic detection threshold9 due to sequestration during the second half of the 48 h life cycle and varying effectiveness of the host's immune response. The volume of blood examined during microscopy slide-reading, if 100 high-power fields are screened, is 0.1–0.25 μl (refs 10, 11, 12), whereas for PCR detection DNA is extracted from 5 to 100 μl in most commonly used protocols. On the basis of these volumes, the theoretical detection limit for standard thick film microscopy is approximately 4–10 parasites per μl, and for PCR it is 0.01–0.2 parasites per μl. In practice, a low number of parasitized red blood cells in a sample is often not sufficient to enable detection due to technical factors such as loss of parasites during staining of microscopy slides10,13 or use of single versus nested PCR protocols. Calibration against cultures with known parasite densities has shown realistic detection limits of 10–100 parasites per μl for microscopy14 and 0.05–10 parasites per μl for various PCR assays15,16.
From the perspective of control agencies aiming to reduce transmission, the most important question is to what extent do submicroscopic parasite carriers, who are missed during routine surveys, contribute to sustaining transmission? To become infected with malaria, Anopheles vectors need to take up a minimum of one male and one female gametocyte in a 2- to 3-μl bloodmeal. There is still a considerable probability of this happening at parasite densities that will often be missed by microscopy (for example, 1–10 parasites per μl), both according to mathematical theory and data17, and an aggregated distribution of parasites in the blood may assist transmission at very low densities18. During the scale-up of malaria control, public health agencies must decide what screening tools to use in different populations and whether submicroscopic carriers are a priority for intervention19. With sufficient resources, submicroscopic parasites could be detected in active screening programmes20 and included in evaluations where they may alter estimates of how interventions impact the prevalence of infection. Both from a biological and a public health perspective, it is important to understand where and when submicroscopic carriage is mostly likely to occur. Here we compile and analyse epidemiological data sets to assess firstly the prevalence of submicroscopic parasite carriers, and secondly which factors cause these carriers to be more numerous in some areas and population groups. We explore the roles of immunity, anti-malarial treatment, level of malaria endemicity and technical test performance. On the basis of 106 PCR prevalence surveys, we develop an analysis tool to estimate how prevalent such carriers are likely to be in any given area. We estimate the contribution of submicroscopic parasite carriers to the onward transmission of malaria by combining survey data with human-to-mosquito transmission studies.
Results
Submicroscopic parasitaemia across the endemicity spectrum
We compiled survey data in which P. falciparum prevalence was measured by both microscopy and by PCR in the same individuals through updating a previous systematic review4. One hundred and six surveys met our inclusion criteria for analysis, taking place in endemic populations within a defined geographic area where participants were not selected according to malaria symptoms or test results, and where nested PCR or equivalent was used for parasite detection (see also Methods and Supplementary Table S1). Submicroscopic carriers were defined as those individuals with infections detected by PCR but not by microscopy. The specificity of microscopy relative to PCR is very high (98.4% on average4), and given infrequent reporting of specificity in the included studies we assume in our analysis that slide-positive results are also PCR-positive. Microscopy detected, on average, 54.1% (95% confidence interval (CI), 50.3–58.2%) of all PCR-detected infections across the 106 surveys, but this sensitivity varied widely (Fig. 1a) as in previous analysis4. Regression analysis showed that the PCR prevalence of infection has a strong linear relationship with microscopy prevalence on the log odds scale (Fig. 1a). Stratifying by age group improved the fit to the data with microscopy sensitivity being higher in children only (<16 years), lowest in adults (16+years) and at an intermediate level when both adults and children were included in the survey (Fig. 1a and b). The best estimate of PCR prevalence is obtained from microscopic slide prevalence as follows (Fig. 1a and b):
Figure 1. Prevalence of infection by PCR versus microscopy in 106 prevalence surveys and model fits.

Bayesian Markov chain Monte Carlo methods were used in model fitting to allow for measurement error in both microscopy and PCR prevalence measures50. Posterior medians are shown. (a) Prevalence data with 95% CI from 86 surveys containing both adults and children, and fitted model (blue line) with 95% credible interval of the mean (light blue area). The model fitted was a linear relationship on the log odds scale. (b) Age-specific prevalence with 95% CI for survey data containing children only (<16 years, red dots, n=28) or adults only (≥16 years, orange dots, n=13). Fitted models (lines) with 95% CI (shaded areas) were obtained using the same methods as in a. (c) Correlation between observed and model-predicted PCR prevalence in the all-age surveys (a), obtained using leave-one-out cross-validation. Correlation coefficient=0.941. (d) Estimated average sensitivity of microscopy and 95% credible interval of the mean in the all-age surveys according to underlying PCR prevalence.
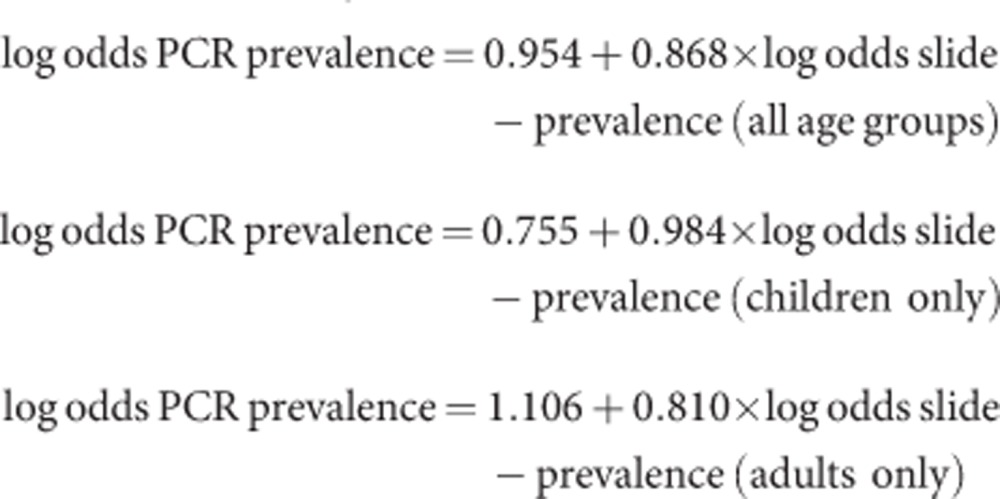 |
where prevalence is a proportion (on the scale 0 to 1), log odds=loge(prevalence/(1–prevalence)) and prevalence=e(log odds)/(1+e(log odds)).
As the effect of age on the sensitivity of microscopy was significant, and most surveys (n=86) included both children and adults, we focussed on these studies with a wide age range for further analysis. We assessed the ability of the regression model to predict PCR prevalence from slide prevalence using a leave-out-one cross validation procedure. The correlation coefficient between observed and predicted values was 0.941, indicating good agreement (Fig. 1c). Using the fitted model, we provide a supplementary spreadsheet tool (Supplementary Software) to estimate PCR prevalence in areas where only slide-prevalence data are available and vice versa, using the equations above, with 95% uncertainty bounds on the prediction that take into account both the uncertainty in our fitted model and the sample size of the user-entered prevalence measure (see Methods). Our tool applies to cross-sectional population surveys with participants from all age groups, and readers should be cautious about using this tool if their data is from a different type of study population. Further details are provided in the Supplementary Software.
Our fitted model indicates that the numbers of submicroscopic carriers as a proportion of the total infected population show a striking trend with changing transmission intensity, decreasing from an average of between 70 and 80% in areas with low PCR prevalence to 20% in the highest prevalence areas (Fig. 1d; see also 4). In the following sections we examine the evidence for the potential role of several host and parasite factors in giving rise to low-level parasitaemia and whether these could drive the observed trend over the transmission intensity spectrum.
Submicroscopic parasitaemia in malaria-naive individuals
Malaria therapy studies, in which laboratory-infected patients were monitored closely over time, are an important source of information on the within-host dynamics of malaria parasites in non-immune individuals21,22. We examined longitudinal data from 89 individuals infected with P. falciparum, who had not previously had malaria and were not treated with anti-malarials at any point. Although only microscopic detection was available at the time, blood slides were taken continually even after a patient had become slide-negative. This showed that most patients experienced a phase when parasite densities fluctuated under and over the microscopic detection threshold, and allowed periods of submicroscopic infection to be identified. The time since infection was an important determinant of parasite density and detectability. The probability of detecting parasites in patients who had not yet had their last episode of slide-positive parasitaemia, that is, they were still infected, showed a clear decline over time (Fig. 2a), dropping to ∼0.85 after 50 days, and less than 0.25 after 200 days (Fig. 2a). The fact that parasite densities are reduced below the microscopic detection threshold is likely to reflect an anti-parasitic immune response developing in these individuals as they experience their first malaria infection.
Figure 2. Trends in parasite densities within-host and across different transmission settings.

(a) Average probability of microscopic detection over the course of a single P. falciparum infection in 89 individuals, among those who had not yet had their last episode of patent parasitaemia (data from malaria therapy studies 21,22). None were treated nor had a record of previous infection. Results are shown up to 300 days (some patients had longer infections, but there were few data points after this time). Points and CIs were calculated in 10-day time bands. (b) Relationship between slide prevalence and parasite density among infected individuals in 24 Tanzanian villages (data from Drakeley et al.24 red points=data with 95% CI, red line=linear regression fit on log scale), and the estimated percentage of infections which are submicroscopic in all age groups based on the model in Fig. 1a (blue dashed line).
Age and acquired immunity
Increasing age has been clearly linked to lower parasite densities12,23, and our analysis above also finds a significantly higher proportion of submicroscopic carriers among surveys of adults compared with children (Fig. 1b). For a more detailed analysis of the role of age, we extracted data from 11 studies where prevalence by microscopy and PCR was broken down for three or more age groups. The data shows a general trend for more infections to be submicroscopic in older children and adults compared with young children (Fig. 3). In linear regression analysis, the proportion of all infections detected by microscopy decreased by 0.7% (95% CI, 0.2–1.2%) per year of age in the pooled age-specific data. This almost certainly represents greater immunity in older individuals, likely due to both cumulative exposure and a more developed immune system.
Figure 3. Age-specific microscopy and PCR prevalence.

Eleven studies reported prevalence for three or more age groups (references a–b51, c–d52, e53, f54, g55, h56, i57, j58, k59). Microscopy prevalence in the whole study population is shown in the top-right corner of each panel.
Given the role of immunity in suppressing parasite densities, individuals living in areas of high transmission with greater exposure might be expected to have less readily detectable infections. However, the between-area comparison of 106 surveys shows the opposite, with submicroscopic carriers predominating in areas of lower transmission (Fig. 1d). In the detailed age-specific data (Fig. 3), age and underlying population PCR prevalence remain significant predictors of microscopy sensitivity in linear regression analysis after mutual adjustment (P<0.001 for both factors). There was no evidence that increasing age had a more pronounced effect on the proportion of submicroscopic infections in areas of higher endemicity, where a larger age-dependent difference in acquired immunity may be expected. Indeed, there was a borderline significant association for a smaller effect of age in higher transmission settings (P=0.055). These data suggest that other factors override the effects of population immunity to produce on average more detectable, high-density infections in high-transmission areas. To further quantify the relationship between parasite densities and transmission intensity, we examined data from 24 Tanzanian villages where transmission intensity varied across from less than 1 infectious bite per person per year, to ∼100 and was reflected by slide prevalence ranging from 2 to 57%24. Parasite densities assessed by microscopy show a clear trend of increasing with increasing transmission intensity (Fig. 2b). This is in line with the trend showing more readily detectable infections where transmission in high and with previous observations25. As more quantitative PCR data becomes available, it should be possible to confirm whether this relationship holds when submicroscopic densities are taken into account.
Antimalarial treatment
When many of the PCR prevalence surveys in the review data were carried out, there was spreading resistance to the most commonly used antimalarial drugs available at the time, chloroquine and sulphadoxine-pyrimethamine. These partially effective treatments could have been a contributing factor to the levels of submicroscopic carriage in the data through allowing persistent, low-level infections26. We contrasted national first-line treatment policies at the time of the studies in our review, and found that 21 countries recommended artemisinin combination therapies and 85 recommended non-artemisinin-based treatments such as sulphadoxine-pyrimethamine. There was no significant difference in the proportion of infections that were submicroscopic, in surveys carried out when artemisinin combination therapies were the first-line treatment (P=0.186), which should have been fully effective at clearing parasitaemia at the times and locations that the surveys were done. Nor was there any trend in changing microscopy sensitivity according to the year the study was carried out (P=0.868), as might have been expected because of increasing drug resistance over time. These results give no evidence for an important role for suboptimal treatment in explaining the distribution of submicroscopic infections between populations.
Parasite detection methods
Variation in microscopy and PCR methodology is known to affect their performance and sensitivity. In the systematic review data, there were borderline significant increases in microscopy sensitivity with the volume of blood examined, as indicated by the number of microscopic fields examined (P=0.043) or the number of leucocytes counted (P=0.046; see also 4). There was no association of microscopy sensitivity relative to PCR with the other methodological variables we examined in our analysis: the volume of blood used for DNA extraction (information available for 27 studies), the PCR protocol (Snounou et al.15 or McNamara et al.16 versus other protocols, n=106 (see also 4)) or the quantity of extracted DNA used in the PCR (n=23). Some of these variables are known to be important from previous studies, so the number of surveys with the relevant data available may have been too small to detect any associations, or other variation between studies could have obscured them. Indeed, variation between laboratories has been found to be more important than variation between protocols for PCR performance27. Using dried blood collected on filter paper for PCR analysis also did not affect sensitivity, in line with previous findings27.
PCR can be subject to contamination, giving false positives and potentially overestimating submicroscopic carriage28. Negative controls should be included during every PCR. However, there was no association between studies reporting use of a negative control and the proportion of submicroscopic infections as previously found4. In addition, assuming any amount of PCR contamination (that is false-positive PCR results) considerably worsened the fit of the model; for example, the deviance information criterion for the model with 5% contamination was 175 larger than the model with no contamination, giving no support for contamination being a significant cause of apparent submicroscopic carriage.
Implications for control programmes and elimination
To assess the contribution of submicroscopic infections to malaria transmission, we reviewed human-to-mosquito transmission studies and identified four experiments which included individuals who tested negative for malaria by microscopy in malaria-endemic areas (defined as no asexual parasites nor gametocytes; 7,29,30 and ALO, unpublished data; Table 1). Further studies tested the infectiousness of individuals with asexual parasites but no gametocytes; however, we focussed on carriers who would not be identified at all during routine, microscopy-based surveys. Molecular studies have shown that most people with asexual parasites also carry gametocytes17,31, although they are more rarely detected by microscopy because they occur at a lower density8. The results varied from showing an approximate 2-fold to a 16-fold reduction in infectivity in submicroscopically infected versus microscopy-positive individuals. The estimate of a two-fold reduction came from a study where an unusually low proportion of mosquitoes were infected in total; only 0.4% of those fed on slide-positives, increasing the uncertainty of the estimate30. In the analysis, therefore, we used the other three estimates that show a 4- to 16-fold reduction in infectivity (Table 1).
Table 1. Infectiousness of submicroscopic parasite carriers versus slide-positive carriers.
| Study | Country | N people | N mosquitoes | % Mosquitoes infected, slide-positives | % Mosquitoes infected, submicroscopic infections |
|---|---|---|---|---|---|
| Ouedraogo 2011 (ALO, unpublished data) | Burkina Faso | 260 | 10,244 | 12.8 | 3.2 |
| Jeffery and Eyles29 | USA | 95 | 10,096 | 20.3 | 2.0 |
| Coleman et al.30 | Thailand | 237 | 9,210 | 0.4 | 0.2* |
| Young et al.7 | USA | 124 | 6,600 | 8.4 | 0.5* |
Proportion of mosquitoes infected during human-to-mosquito transmission studies. In two of these studies, the prevalence of submicroscopic carriage among microscopy-negatives was not assessed and therefore this was estimated using the relationship in Fig. 1a.
*Prevalence of submicroscopic carriers estimated.
We estimated the contribution of the submicroscopic reservoir to sustaining malaria transmission, that is, the proportion of mosquito infections originating from submicroscopic carriers. We combined the average prevalence of submicroscopic infection across different malaria endemicities from the survey data analysis (Fig. 1a) with each of the three studies on infectiousness (Table 1).
Two of the infectiousness studies7,29 suggest that submicroscopic carriers are relatively unimportant, except when transmission is very low (Fig. 4). Submicroscopic carriers are estimated to be the source of over 20% of mosquito infections only where slide prevalence is under 4%, for the first of these two studies,29 or under 0.5% for the second study.7 The third study (ALO, unpublished data) suggests submicroscopic infections are the source of over 20% of mosquito infections where slide prevalence is up to 24%, and as much as 50% of mosquito infections in very low-transmission areas (slide prevalence <0.5%). This analysis has limitations and additional estimates on the infectiousness of microscopic and submicroscopic parasite carriers are required, taking into account that the infectiousness of submicroscopic parasite carriers may vary between settings. Despite these uncertainties, all results indicate that submicroscopic infections are important contributors to transmission in areas with low or very low transmission intensity (under ∼0.5%) and they may be important when slide prevalence is up to 24%, but contribute considerably less to transmission in areas of high transmission intensity.
Figure 4. Estimated contribution of submicroscopic infections to the infectious reservoir.

Percentage of mosquito infections originating from submicroscopic carriers, according to the observed slide prevalence of infection. Estimates are based on results from Fig. 1a and measures of infectiousness from three studies (7,21 and ALO, unpublished data). The estimated % of all infections which are submicroscopic from Fig. 1a is shown as a black dashed line.
Discussion
Our analysis shows that submicroscopic infections are likely to be important in sustaining transmission in areas where slide prevalence is low (<10–20%). For example, in an area where slide prevalence is 3%, submicroscopic infections are present in a further 8% of the population and, our calculations suggest, are responsible for 14–40% of all mosquito infections (Fig. 4). Submicroscopic carriers will become increasingly important as current control programmes continue to successfully reduce transmission intensity. We find that the prevalence of submicroscopic carriage can be estimated relatively precisely for a given population from microscopic slide prevalence using a simple model. As PCR methods are not yet widely available in the field, such a relationship can provide a useful approximate guide to underlying submicroscopic carriage in areas where only slide prevalence is available. Control and elimination programmes may wish to consider using molecular methods to identify infected individuals; our results warn against a relaxation of control efforts once prevalence of infection appears low according to microscopy. Molecular screening for parasites will be facilitated by the development of newer, field-adapted molecular tests32.
The common assumption that individuals with little previous exposure to malaria have a limited immune response against parasites and usually experience high-density infections is challenged by molecular data. The prevalence of submicroscopic infections in both low-transmission areas and in children suggests that a parasite-suppressing immune response develops more efficiently than commonly assumed. In malaria therapy patients, a common pattern is that initial high parasite density is followed by a long phase of low-density parasitaemia, which often drops below the microscopy detection threshold. There is evidence that in semi-immune individuals living in endemic areas, new infections similarly cause a phase of higher parasitaemia followed by a chronic low-density phase23,33, although this is difficult to confirm as multiple infections often overlap and most current genotyping methods do not show the contribution of each clone to total parasite density. However, the arrival of new parasite genotypes in a host has been linked to clinical attacks, even in the presence of asymptomatic infection with other parasite clones, reflecting a rise in parasite density34. Seasonal patterns also indicate a rise in parasite density during the rainy season when rates of infection are high, even when there is little seasonal variation in parasite prevalence.25
On the basis of these observations, combined with malaria therapy data, we hypothesize that frequent infection and superinfection in high-transmission areas increase the average parasite density in infected individuals, whereas in lower transmission areas infections are on average older and more likely to have reached a submicroscopic phase. Figure 5 shows a schematic representation of our hypothesis. Although immunity clearly has some role in suppressing parasite densities to low levels (as shown by the age patterns of microscopy and PCR prevalence in Fig. 3), it cannot explain the varying rates of submicroscopic carriage across endemic settings. We hypothesize that the average time since last being infected overrides the effects of immunity in determining the low rate of submicroscopic parasitaemia in high-endemic settings (Fig. 5). The reason that new infections result in higher parasite density and clinical attacks is not fully understood, but suggests hosts may have only partial cross-immunity against different parasite clones. Being infected with multiple clones has also been correlated with higher parasite density35. This could simply reflect a higher probability of having a recent infection, or may alternatively demonstrate an independent effect on parasite density. For example, host immune systems may be overwhelmed by the additional number or variety of parasites, or parasites may facultatively increase their growth rates in the presence of competing clones36.
Figure 5. Hypothesized within-host dynamics of parasitaemia.

Schematic showing hypothesized patterns of parasitaemia in a single host in low- and high-transmission settings, showing infection times (arrows) and periods of submicroscopic parasitaemia (grey areas). Grey lines indicate detection limits of microscopy and PCR.
If our hypothesis is correct, the prevalence of submicroscopic infections in an area may reflect recent dynamics of transmission and indeed levels of control interventions37. A high proportion of submicroscopic infections could indicate a recent decrease in transmission. This is consistent with data from northern Tanzania showing high (33%) prevalence of almost entirely submicroscopic infections during a time of declining transmission38. Such dynamics may occur when the local transmission potential is stably reduced, for example, by ongoing vector control. However, submicroscopic infections can be sufficient to restart transmission in the right conditions. For example in Sudan, slide prevalence declines to zero during the long dry season but some PCR-positive cases remain26, who are presumed to explain the resurgence of transmission with the next rainy season once there are sufficient vectors. Therefore, a successful control programme should not be relaxed while submicroscopic infections persist.39
There may be additional factors associated with submicroscopic carriage that we could not examine in our current analysis. Haemoglobinopathies and other human polymorphic traits, which protect against malaria, are associated with lower parasite density40. However, such traits are generally more common when malaria transmission is high, which would not explain the lower proportion of submicroscopic infections in these areas as observed in our review data. Parasites may also have varying genetic propensities to reach particular densities when infecting hosts, for example, through different multiplication rates41. Genetic diversity in an area may affect parasite densities. Molecular studies have shown that low genetic diversity is linked with low transmission intensity42, suggesting that after people are infected once, subsequent infections contain antigenically very similar parasites and may therefore be easier to control. There is also a short submicroscopic phase at the beginning of an infection during initial blood-stage parasite multiplication. In adults in endemic areas, this multiplication rate is over three-fold lower than in non-immune hosts43, which could contribute to the age patterns of parasite detectability. Although our analysis did not find a role of partially effective anti-malarial treatment in enhancing low-level parasitaemia, there is evidence from Sudan that chronic submicroscopic infections were associated with recent chloroquine treatment during a time of increasing parasite resistance44; further molecular follow-up data from clinical trials would provide clarification on this.
We did not analyse the relationship between RDT and PCR prevalence because of a paucity of surveys reporting both measures. However, the development of large, publicly available prevalence data sets45 will provide the opportunity to characterize the relative sensitivity of microscopy and different RDT types, and from there it will be possible to get a clearer idea of RDT–PCR prevalence relationships. In clinical settings, the sensitivity of standard RDTs is generally high but their detection limits are around 100 parasites per μl46; therefore, they will be generally somewhat less sensitive than microscopy in population surveys, where parasite densities are lower. There are also known to be malaria infections with very low density missed by both microscopy and PCR47.
The ubiquity of submicroscopic carriers in low-transmission sites indicates that assessing parasite carriage with molecular tools will be critical in monitoring malaria elimination programmes, where microscopy measures are insufficient to assess the scale of public health measures required. Identifying these carriers and their characteristics could also shed new light on ecological or sociodemographic risk factors for malaria in areas where most infections are submicroscopic. The evolutionary advantage to the parasite of these chronic, low-density infections is clear, particularly as mosquitoes can still become infected. In some areas with highly seasonal or sporadic vector populations, the ability to create chronic infections in the human host may be essential for parasite survival26. This advantage also extends to the human host, as such low-density infections cause minimal disease and can maintain immunity48. The increasing quantity of emerging molecular data will continue to enlighten our understanding of human-parasite interactions and their co-evolution.
Methods
Systematic review update and analysis
We compiled malaria prevalence data where both microscopy and PCR methods had been used to determine infection status, through updating a previous systematic review using the same methods4. We searched from January 2009, when the previous review was completed, to the 1 November 2011, retrieving 636 records using the search terms ‘malaria' and ‘PCR', and through searching reference lists in the articles retrieved. Surveys were included if they took place in endemic populations within a defined geographic area, and were excluded if participants were selected according to malaria symptoms or test results, if the survey was gametocyte-specific, or if there was a large-scale intervention before data collection. We also excluded surveys of pregnant women, which are a special case and have been reviewed elsewhere49. After screening titles and abstracts, we retained 73 for full-text evaluation. Fifteen of these were included and yielded 51 microscopy and PCR prevalence survey data pairs. Together with the previous systematic review results, this gave a total of 122 prevalence surveys. We restricted analysis to 106 surveys, which used a nested or semi-nested PCR or a PCR with an additional ligase detection reaction step16, to aim for equivalent sensitivity, and those which provided the age range of survey participants. We extracted information on covariates with potential influence on microscopy sensitivity, including the age range of participants and details of microscopy and PCR procedures.
We used the method described by Sharp et al.50 to fit a linear relationship to the log odds of PCR and microscopy prevalence data:
 |
 |
where ΩPi is the log odds of PCR prevalence in trial i, ΩMi is the log odds of microscopy prevalence, δ is the log odds ratio (OR) of PCR to microscopy prevalence,  is the mean log odds of microscopy prevalence across trials, δ′ is the expected log OR PCR:microscopy prevalence when the log odds of microscopy prevalence is equal to the mean across trials, and β0 is a regression coefficient. Any prevalence survey showing zero positive results by either microscopy or PCR was assumed to have 0.5 positive individuals, that is, half the detection limit, so they could be included in the analysis. The specificity of microscopy relative to PCR is very high (98.4% on average4), so we assumed in our analysis that all slide-positive results are also PCR-positive. The model was fitted using Bayesian Markov Chain Monte Carlo techniques in Winbugs to allow for the different sample sizes and thus sampling variation in each survey. Each observed prevalence value is assumed to be drawn from a binomial distribution with the sample size of the survey. The log OR of microscopy: PCR prevalence was allowed to vary between surveys, with both the log OR and the log odds of microscopy prevalence assumed to be normally distributed. Uninformative priors were used. We assessed the predictive value of the fitted model using a leave-out-one cross validation procedure. Using the best fitting model, we developed a spreadsheet tool, which converts user-entered slide-prevalence data to PCR prevalence, or vice versa. Uncertainty bounds on the prediction were calculated by applying the delta method to the posterior distributions of fitted parameters and the Bayesian CI of the prevalence data entered by the user.
As an amplification technique, any contamination of PCR could have a significant effect on the model; therefore, we tested it as a potential covariate. The observed PCR prevalence IPi was assumed to contain a constant proportion of contaminated samples c, that is, false positives. We fitted the model above with the following modification:
 |
where ÎPi is the PCR prevalence that would be observed in the absence of contamination, and ΩPi in equation 1 above becomes the log odds of  rather than the log odds of IPi. We tried both fitting and fixing the proportion of samples that are contaminated. When this was fixed, we used a value of 5% based on reports from laboratories28. We additionally examined whether several other variables, particularly variations in the PCR and microscopy technical methods, influenced microscopy sensitivity using standard random-effects meta-analysis and meta-regression.
Malaria therapy data
We analysed data from patients infected with the El-Limon, McLendon or Santee-Cooper (gametocyte-producing) strains of P. falciparum21,22. We excluded patients who were treated or reported a previous infection, and data from the day after the last microscopic detection of parasites for each patient. Infectiousness of submicroscopic relative to microscopic cases was assessed using data from days when a human-to-mosquito transmission experiment was done and no asexual or gametocytes were detected in the patients' blood by microscopy, and comparing with measures taken when either or both parasite life stages were present in the blood. Mosquito feeding was more likely to be carried out if gametocytes were present and, therefore, we weighted the analysis by gametocyte status and by stage of infection (grouped into days 1–20, 21–40, 41–60, 61–80, 81–100, 101–200 and >200) so that measures were representative of an average infection.
Other human infectiousness studies
We searched the literature to find as many studies as possible measuring human-to-mosquito transmission from individuals in malaria-endemic areas with neither asexual parasites nor gametocytes detectable by microscopy, using PubMed and modern transmission studies17,31 as starting points and searching through the relevant literature using bibliographies and a review8. We identified three further relevant studies in addition to the malaria therapy data. One of these directly measured submicroscopic parasitaemia using quantitative nucleic acid sequence-based amplification as well as slide positivity31. Two further human-to-mosquito transmission experiments measured the infectiousness of slide-negative individuals, but their infection status was not tested by molecular methods7,30. We estimated the PCR prevalence in these study populations using the log linear model described in the main text (equation 1, Fig. 1a) and the reported slide prevalence in the study. The prevalence of submicroscopic carriage was calculated as:
 |
We assumed all infections from slide negatives arose from these submicroscopic carriers, using them as the denominator in calculating infectiousness. The contribution of slide-positives or submicroscopic carriers to the infectious reservoir was calculated as:
 |
The proportion of mosquito infections which would originate from submicroscopic infections was estimated as:
 |
Age-prevalence data
We extracted the data from all studies which included children and adults and which gave a breakdown of prevalence by microscopy and PCR for at least three age groups. We fit a linear relationship between microscopy sensitivity and age, using the midpoint of the age group, and tested whether underlying population PCR prevalence was a modifying factor. Here we used log prevalence ratios, as log ORs of microscopy: PCR positivity would decline as PCR prevalence increased, even with constant sensitivity in all settings.
Author contributions
L.C.O. updated the systematic review, did the analysis and drafted the manuscript, T.B. reviewed the studies and collected data, J.T.G. advised and contributed to the analysis, A.L.O. contributed data. All authors contributed to interpretation of data, writing and revising the manuscript, and have seen and approved the final version.
Additional information
How to cite this article: Okell, L. C. et al. Factors determining the occurrence of submicroscopic malaria infections and their relevance for control. Nat. Commun. 3:1237 doi: 10.1038/ncomms2241 (2012).
Supplementary Material
Supplementary Table S1 and Supplementary References
Spreadsheet permitting estimation of PCR prevalence from microscopy slide prevalence and vice-versa
Acknowledgments
We thank Cally Roper, Brian Greenwood and Geoff Targett for useful discussions on interpretation of data, and Freya Fowkes for advice on statistical analysis. L.C.O. and J.T.G. are funded by the UK Medical Research Council fellowships; T.B. is funded by the European Union FIGHTMAL project of the European Community's Seventh Framework Programme (FP7/2007–2013; grant PIAP-GA-2008-21816.4); A.L.O. is funded by the Netherlands Fellowship Programme (grant CF2913/2006); and C.J.D. is funded by the Wellcome Trust (grant 091924). A.C.G. acknowledges Centre support from the Medical Research Council. L.C.O., J.T.G. and A.C.G. also acknowledge support from the Bill and Melinda Gates Foundation Vaccine Modeling Initiative. The funders had no role in the study design, in the collection, analysis and interpretation of data, in the writing of the report, or in the decision to submit the paper for publication.
References
- Monitoring and Evaluation to Assess and Use Results Demographic and Health Surveys (MEASURE-DHS). Malaria Indicator Surveys http://www.measuredhs. com/What-We-Do/Survey-Types/MIS.cfm.
- Hay S. I. et al. A world malaria map: Plasmodium falciparum endemicity in 2007. PLoS Med. 6, e1000048 (2009). [DOI] [PMC free article] [PubMed] [Google Scholar]
- Snounou G. et al. The importance of sensitive detection of malaria parasites in the human and insect hosts in epidemiological studies, as shown by the analysis of field samples from Guinea Bissau. Trans. R. Soc. Trop. Med. Hyg. 87, 649–653 (1993). [DOI] [PubMed] [Google Scholar]
- Okell L. C., Ghani A. C., Lyons E. & Drakeley C. J. Submicroscopic infection in Plasmodium falciparum-endemic populations: a systematic review and meta-analysis. J. Infect. Dis. 200, 1509–1517 (2009). [DOI] [PubMed] [Google Scholar]
- Ladeia-Andrade S., Ferreira M. U., de Carvalho M. E., Curado I. & Coura J. R. Age-dependent acquisition of protective immunity to malaria in riverine populations of the Amazon Basin of Brazil. Am. J. Trop. Med. Hyg. 80, 452–459 (2009). [PubMed] [Google Scholar]
- Arango E., Maestre A. & Carmona-Fonseca J. Effect of submicroscopic or polyclonal Plasmodium falciparum infection on mother and gestation product: systematic review. Rev. Bras. Epidemiol. 13, 373–386 (2010). [DOI] [PubMed] [Google Scholar]
- Young M. D. et al. The infectivity of native malarias in South Carolina to Anopheles quadrimaculatus. Am. J. Trop. Med. Hyg. 28, 303–311 (1948). [DOI] [PubMed] [Google Scholar]
- Bousema T. & Drakeley C. Epidemiology and infectivity of Plasmodium falciparum and Plasmodium vivax gametocytes in relation to malaria control and elimination. Clin. Microbiol. Rev. 24, 377–410 (2011). [DOI] [PMC free article] [PubMed] [Google Scholar]
- O'Meara W. P., Collins W. E. & McKenzie F. E. Parasite prevalence: a static measure of dynamic infections. Am. J. Trop. Med. Hyg. 77, 246–249 (2007). [PMC free article] [PubMed] [Google Scholar]
- Dowling M. A. & Shute G. T. A comparative study of thick and thin blood films in the diagnosis of scanty malaria parasitaemia. Bull. World Health Organ. 34, 249–267 (1966). [PMC free article] [PubMed] [Google Scholar]
- Greenwood B. M. & Armstrong J. R. Comparison of two simple methods for determining malaria parasite density. Trans. R. Soc. Trop. Med. Hyg. 85, 186–188 (1991). [DOI] [PubMed] [Google Scholar]
- Bruce-Chwatt R. W. Essential Malariology. 4th edn, (2002). [Google Scholar]
- Bejon P. et al. Thick blood film examination for Plasmodium falciparum malaria has reduced sensitivity and underestimates parasitaemia. Malar. J. 5, 104 (2006). [DOI] [PMC free article] [PubMed] [Google Scholar]
- Wongsrichanalai C., Barcus M. J., Muth S., Sutamihardja A., Wernsdorfer W. H. A review of malaria diagnostic tools: microscopy and rapid diagnostic test (RDT). Am. J. Trop. Med. Hyg. 77, 119–127 (2007). [PubMed] [Google Scholar]
- Snounou G. et al. High sensitivity of detection of human malaria parasites by the use of nested polymerase chain reaction. Mol. Biochem. Parasitol. 61, 315–320 (1993). [DOI] [PubMed] [Google Scholar]
- McNamara D. T. et al. Diagnosing infection levels of four human malaria parasite species by a polymerase chain reaction/ligase detection reaction fluorescent microsphere-based assay. Am. J. Trop. Med. Hyg. 74, 413–421 (2006). [PMC free article] [PubMed] [Google Scholar]
- Schneider P. et al. Submicroscopic Plasmodium falciparum gametocyte densities frequently result in mosquito infection. Am. J. Trop. Med. Hyg. 76, 470–474 (2007). [PubMed] [Google Scholar]
- Pichon G., Awono-Ambene H. P. & Robert V. High heterogeneity in the number of Plasmodium falciparum gametocytes in the bloodmeal of mosquitoes fed on the same host. Parasitology 121(Pt 2): 115–120 (2000). [DOI] [PubMed] [Google Scholar]
- malERA Consultative Group on Diagnoses and Diagnostics. A research agenda for malaria eradication: diagnoses and diagnostics. PLoS Med. 8, e1000396 (2011). [DOI] [PMC free article] [PubMed] [Google Scholar]
- Stresman G. H. et al. A method of active case detection to target reservoirs of asymptomatic malaria and gametocyte carriers in a rural area in Southern Province, Zambia. Malar. J. 9, 265 (2010). [DOI] [PMC free article] [PubMed] [Google Scholar]
- Jeffery G. M. & Eyles D. E. The duration in the human host of infections with a Panama strain of Plasmodium falciparum. Am. J. Trop. Med. Hyg. 3, 219–224 (1954). [DOI] [PubMed] [Google Scholar]
- Collins W. E. & Jeffery G. M. A retrospective examination of sporozoite- and trophozoite-induced infections with Plasmodium falciparum: development of parasitologic and clinical immunity during primary infection. Am. J. Trop. Med. Hyg. 61, 4–19 (1999). [DOI] [PubMed] [Google Scholar]
- Sama W., Owusu-Agyei S., Felger I., Dietz K. & Smith T. Age and seasonal variation in the transition rates and detectability of Plasmodium falciparum malaria. Parasitology 132, 13–21 (2006). [DOI] [PubMed] [Google Scholar]
- Drakeley C. J. et al. Estimating medium- and long-term trends in malaria transmission by using serological markers of malaria exposure. Proc. Natl Acad. Sci. USA 102, 5108–5113 (2005). [DOI] [PMC free article] [PubMed] [Google Scholar]
- Smith T. et al. Absence of seasonal variation in malaria parasitaemia in an area of intense seasonal transmission. Acta Trop. 54, 55–72 (1993). [DOI] [PubMed] [Google Scholar]
- Roper C. et al. Detection of very low level Plasmodium falciparum infections using the nested polymerase chain reaction and a reassessment of the epidemiology of unstable malaria in Sudan. Am. J. Trop. Med. Hyg. 54, 325–331 (1996). [DOI] [PubMed] [Google Scholar]
- Proux S. et al. Considerations on the use of nucleic acid-based amplification for malaria parasite detection. Malar. J. 10, 323 (2011). [DOI] [PMC free article] [PubMed] [Google Scholar]
- Wilson S. M. Detection of malaria parasites by PCR. Trans. R. Soc. Trop. Med. Hyg. 88, 363 (1994). [DOI] [PubMed] [Google Scholar]
- Jeffery G. M. & Eyles D. E. Infectivity to mosquitoes of Plasmodium falciparum as related to gametocyte density and duration of infection. Am. J. Trop. Med. Hyg. 4, 781–789 (1955). [DOI] [PubMed] [Google Scholar]
- Coleman R. E. et al. Infectivity of asymptomatic Plasmodium-infected human populations to Anopheles dirus mosquitoes in western Thailand. J. Med. Entomol. 41, 201–208 (2004). [DOI] [PubMed] [Google Scholar]
- Ouedraogo A. L. et al. Substantial contribution of submicroscopical Plasmodium falciparum gametocyte carriage to the infectious reservoir in an area of seasonal transmission. PLoS One 4, e8410 (2009). [DOI] [PMC free article] [PubMed] [Google Scholar]
- Schulze H., Giraud G., Crain J. & Bachmann T. T. Multiplexed optical pathogen detection with lab-on-a-chip devices. J. Biophotonics 2, 199–211 (2009). [DOI] [PubMed] [Google Scholar]
- Babiker H. A., Abdel-Muhsin A. M., Ranford-Cartwright L. C., Satti G. & Walliker D. Characteristics of Plasmodium falciparum parasites that survive the lengthy dry season in eastern Sudan where malaria transmission is markedly seasonal. Am. J. Trop. Med. Hyg. 59, 582–590 (1998). [DOI] [PubMed] [Google Scholar]
- Missinou M. A., Kun J. F., Lell B. & Kremsner P. G. Change in Plasmodium falciparum genotype during successive malaria episodes in Gabonese children. Parasitol. Res. 87, 1020–1023 (2001). [DOI] [PubMed] [Google Scholar]
- Ofosu-Okyere A. et al. Novel Plasmodium falciparum clones and rising clone multiplicities are associated with the increase in malaria morbidity in Ghanaian children during the transition into the high transmission season. Parasitology 123, 113–123 (2001). [DOI] [PubMed] [Google Scholar]
- Pollitt L. C. et al. Competition and the evolution of reproductive restraint in malaria parasites. Am. Nat. 177, 358–367 (2011). [DOI] [PMC free article] [PubMed] [Google Scholar]
- Gatton M. L. & Cheng Q. Interrupting malaria transmission: quantifying the impact of interventions in regions of low to moderate transmission. PLoS One 5, e15149 (2010). [DOI] [PMC free article] [PubMed] [Google Scholar]
- Shekalaghe S. A. et al. A cluster-randomized trial of mass drug administration with a gametocytocidal drug combination to interrupt malaria transmission in a low endemic area in Tanzania. Malar. J. 10, 247 (2011). [DOI] [PMC free article] [PubMed] [Google Scholar]
- Karl S. et al. A sub-microscopic gametocyte reservoir can sustain malaria transmission. PLoS One 6, e20805 (2011). [DOI] [PMC free article] [PubMed] [Google Scholar]
- Kiwanuka G. N. Genetic diversity in Plasmodium falciparum merozoite surface protein 1 and 2 coding genes and its implications in malaria epidemiology: a review of published studies from 1997-2007. J. Vector Borne Dis. 46, 1–12 (2009). [PubMed] [Google Scholar]
- Mackinnon M. J., Gaffney D. J. & Read A. F. Virulence in rodent malaria: host genotype by parasite genotype interactions. Infect. Genet. Evol. 1, 287–296 (2002). [DOI] [PubMed] [Google Scholar]
- Schoepflin S. et al. Comparison of Plasmodium falciparum allelic frequency distribution in different endemic settings by high-resolution genotyping. Malar. J. 8, 250 (2009). [DOI] [PMC free article] [PubMed] [Google Scholar]
- Douglas A. D. et al. Substantially reduced pre-patent parasite multiplication rates are associated with naturally acquired immunity to Plasmodium falciparum. J. Infect. Dis. 203, 1337–1340 (2011). [DOI] [PMC free article] [PubMed] [Google Scholar]
- Roper C. et al. Seasonal changes in the Plasmodium falciparum population in individuals and their relationship to clinical malaria: a longitudinal study in a Sudanese village. Parasitology 116(Pt 6): 501–510 (1998). [DOI] [PubMed] [Google Scholar]
- Gething P. W. et al. A new world malaria map: Plasmodium falciparum endemicity in 2010. Malar. J. 10, 378 (2011). [DOI] [PMC free article] [PubMed] [Google Scholar]
- Ochola L., Vounatsou P., Smith T., Mabaso M. & Newton C. The reliability of diagnostic techniques in the diagnosis and management of malaria in the absence of a gold standard. Lancet Infect. Dis. 6, 582–588 (2006). [DOI] [PubMed] [Google Scholar]
- Bretscher M. T. et al. Detectability of Plasmodium falciparum clones. Malar. J. 9, 234 (2010). [DOI] [PMC free article] [PubMed] [Google Scholar]
- Shekalaghe S. et al. Low density parasitaemia, red blood cell polymorphisms and Plasmodium falciparum specific immune responses in a low endemic area in northern Tanzania. BMC Infect. Dis. 9, 69 (2009). [DOI] [PMC free article] [PubMed] [Google Scholar]
- Kattenberg J. H. et al. Systematic review and meta-analysis: rapid diagnostic tests versus placental histology, microscopy and PCR for malaria in pregnant women. Malar. J. 10, 321 (2011). [DOI] [PMC free article] [PubMed] [Google Scholar]
- Sharp S. J. & Thompson S. G. Analysing the relationship between treatment effect and underlying risk in meta-analysis: comparison and development of approaches. Stat. Med. 19, 3251–3274 (2000). [DOI] [PubMed] [Google Scholar]
- Alves J. et al. Epidemiological characterization of Plasmodium falciparum in the Republic of Cabo Verde: implications for potential large-scale re-emergence of malaria. Malar. J. 5, 32 (2006). [DOI] [PMC free article] [PubMed] [Google Scholar]
- John C. C., McHugh M. M., Moormann A. M., Sumba P. O. & Ofulla A. V. Low prevalence of Plasmodium falciparum infection among asymptomatic individuals in a highland area of Kenya. Trans. R. Soc. Trop. Med. Hyg. 99, 780–786 (2005). [DOI] [PubMed] [Google Scholar]
- Satoguina J. et al. Comparison of surveillance methods applied to a situation of low malaria prevalence at rural sites in The Gambia and Guinea Bissau. Malar. J. 8, 274 (2009). [DOI] [PMC free article] [PubMed] [Google Scholar]
- Cortes A. et al. Plasmodium falciparum: distribution of msp2 genotypes among symptomatic and asymptomatic individuals from the Wosera region of Papua New Guinea. Exp. Parasitol. 106, 22–29 (2004). [DOI] [PubMed] [Google Scholar]
- Steenkeste N. et al. Sub-microscopic malaria cases and mixed malaria infection in a remote area of high malaria endemicity in Rattanakiri province, Cambodia: implication for malaria elimination. Malar. J. 9, 108 (2010). [DOI] [PMC free article] [PubMed] [Google Scholar]
- Mueller I. et al. High sensitivity detection of Plasmodium species reveals positive correlations between infections of different species, shifts in age distribution and reduced local variation in Papua New Guinea. Malar. J. 8, 41 (2009). [DOI] [PMC free article] [PubMed] [Google Scholar]
- Zwetyenga J. et al. No influence of age on infection complexity and allelic distribution in Plasmodium falciparum infections in Ndiop, a Senegalese village with seasonal, mesoendemic malaria. Am. J. Trop. Med. Hyg. 59, 726–735 (1998). [DOI] [PubMed] [Google Scholar]
- Owusu-Agyei S., Smith T., Beck H. P., Amenga-Etego L. & Felger I. Molecular epidemiology of Plasmodium falciparum infections among asymptomatic inhabitants of a holoendemic malarious area in northern Ghana. Trop. Med. Int. Health 7, 421–428 (2002). [DOI] [PubMed] [Google Scholar]
- Ofulla A. V. et al. Age-related differences in the detection of Plasmodium falciparum infection by PCR and microscopy, in an area of Kenya with holo-endemic malaria. Ann. Trop. Med. Parasitol. 99, 431–435 (2005). [DOI] [PubMed] [Google Scholar]
Associated Data
This section collects any data citations, data availability statements, or supplementary materials included in this article.
Supplementary Materials
Supplementary Table S1 and Supplementary References
Spreadsheet permitting estimation of PCR prevalence from microscopy slide prevalence and vice-versa