

Abstract
Knowledge of thalamocortical (TC) processing comes mainly from studying core thalamic systems that project to middle layers of primary sensory cortices. However, most thalamic relay neurons comprise a matrix of cells that are densest in the “nonspecific” thalamic nuclei and usually target layer 1 (L1) of multiple cortical areas. A longstanding hypothesis is that matrix TC systems are crucial for regulating neocortical excitability during changing behavioral states, yet we know almost nothing about the mechanisms of such regulation. It is also unclear whether synaptic and circuit mechanisms that are well established for core sensory TC systems apply to matrix TC systems. Here we describe studies of thalamic matrix influences on mouse prefrontal cortex using optogenetic and in vitro electrophysiology techniques. Channelrhodopsin-2 was expressed in midline and paralaminar (matrix) thalamic neurons, and their L1-projecting TC axons were activated optically. Contrary to conventional views, we found that matrix TC projections to L1 could transmit relatively strong, fast, high-fidelity synaptic signals. L1 TC projections preferentially drove inhibitory interneurons of L1, especially those of the late-spiking subtype, and often triggered feedforward inhibition in both L1 interneurons and pyramidal cells of L2/L3. Responses during repetitive stimulation were far more sustained for matrix than for core sensory TC pathways. Thus, matrix TC circuits appear to be specialized for robust transmission over relatively extended periods, consistent with the sort of persistent activation observed during working memory and potentially applicable to state-dependent regulation of excitability.
Introduction
The prefrontal cortex (PFC) is a group of cortical areas considered critical for executive function and intimately linked to psychiatric diseases (Lewis et al., 2005; Ruzicka et al., 2007; Curtis and Lee, 2010; Lehman et al., 2011). It is thought to exert control throughout the brain to regulate goal-directed behaviors (Miller and Cohen, 2001; Uylings et al., 2003; Vertes, 2006; Sotres-Bayon and Quirk, 2010). There is a widely held belief that the PFC is itself regulated by an ascending activating system involving projections to layer 1 (L1) from the so-called “matrix” or nonspecific thalamocortical (TC) relay neurons located predominantly in the midline, intralaminar, and paralaminar thalamic nuclei (Krettek and Price, 1977; Herkenham, 1986; Vogt, 1991; Jones, 2001; Van der Werf et al., 2002; Rubio-Garrido et al., 2009). Large bilateral lesions encompassing the midline and intralaminar thalamic nuclei reportedly reduce behavioral responsiveness and may even induce coma, whereas electrical activation of these nuclei increases behavioral and cortical arousal (Moruzzi and Magoun, 1949; Jasper, 1960; Jones, 2007; Schiff, 2008; Shah and Schiff, 2010). The mechanisms by which matrix thalamic projections regulate the cortex are unknown, primarily because we know so little about the synaptic influences of these projections on the neocortex. For example, it is unclear whether they have weak and slow modulatory effects or, like core sensory TC projections, they can drive fast and robust cortical responses (Alonso and Swadlow, 2005; Boudreau and Ferster, 2005; Rose and Metherate, 2005; Bruno and Sakmann, 2006; Cruikshank et al., 2010). More fundamentally, the identity of their main postsynaptic target type within L1 is uncertain, i.e., pyramidal dendrites or local inhibitory interneurons. It is not even known whether matrix TC projections cause net excitation or net inhibition in cortex; the existence and magnitude of feedforward inhibition has not been characterized.
Investigation of matrix TC synapses has lagged, in part, because it has been impractical to study them using conventional electrophysiological methods. For example, TC pathways are often nonplanar so their axons tend to become severed in the types of slice preparations normally used for in vitro studies (Lee et al., 2007). Furthermore, selective electrical stimulation of matrix TC axons within the cortex is nearly impossible because of the proximity of these TC axons to other (nontargeted) cells and axons. Here we apply an optogenetic strategy to overcome these difficulties (Petreanu et al., 2009; Cruikshank et al., 2010; Yizhar et al., 2011a) and study the synaptic effects of thalamic matrix input on PFC for the first time. Channelrhodopsin-2 (ChR2) was expressed in matrix thalamic neurons projecting to L1 of medial areas of PFC (mPFC). ChR2 expression occurred throughout the membranes of the thalamic neurons, including their extended axons. Using optical stimuli, we selectively excited these TC axons within L1 of mPFC and characterized their synaptic influences on local cortical neurons and circuits.
Materials and Methods
Subjects and optogenetic virus injections.
Procedures were approved by the Brown University Institutional Animal Care and Use Committee. Viruses carrying fusion genes for ChR2 and fluorescent proteins were injected unilaterally into thalamus or cortex of mice of either sex in vivo between postnatal days 13 and 17. For TC synaptic experiments, paralaminar and midline thalamic nuclei that project to L1 of mPFC were targeted for the injections (Table 1) (Krettek and Price, 1977; Herkenham, 1986; Paxinos and Franklin, 2001; Rubio-Garrido et al., 2009). For corticocortical (CC) synaptic experiments, the anterior part of the mPFC (the prelimbic area, 1.98–2.68 mm anterior to bregma) was the target for virus injection.
Table 1.
Locations of thalamic injections and postsynaptic cortical cells for the TC studies
| Mouse | Center of thalamic injection |
Loci of cells from which TC responses were measured |
|||
|---|---|---|---|---|---|
| AP position (posterior from bregma, mm) | Thalamic nucleus | AP position (anterior from bregma, mm) | Cortical area | Postsynaptic cell class | |
| 1 | −1.82 | VM | 1.94 | Cg1/M2 | LS L1 (n = 1), other L1 (n = 1) |
| 2 | −1.22 | VM/Sub | 1.98 | PrL | Other L1 (n = 1), Pyr L2/L3 (n = 1) |
| 3 | −1.06 | AM | 1.98 | Cg1 | LS L1 (n = 1), other L1 (n = 1) |
| 4 | −0.82 | AM | 0.38 | Cg1 | LS L1 (n = 1), other L1 (n = 1) |
| 5 | −0.70 | AM | 2.22 | Cg1 | Other L1 (n = 1), Pyr L2/L3 (n = 1) |
| 1.78 | PrL | Other L1 (n = 1) | |||
| 0.98 | Cg2 | Pyr L2/L3 (n = 2) | |||
| 6 | −1.06 | AM | 1.18 | Cg2 | LS L1 (n = 1), other L1 (n = 1) |
| 0.74 | Cg2 | Other L1 (n = 2) | |||
| 7 | −1.06 | AM/Sub | 1.70 | PrL | Pyr L2/L3 (n = 1) |
| 1.34 | Cg1 | Other L1 (n = 1), Pyr L2/L3 (n = 1) | |||
| 8 | −0.82 | AM/Re | 1.98 | PrL | NLS L1 (n = 1), Pyr L2/L3 (n = 1) |
| 1.70 | PrL | LS L1 (n = 1), NLS L1 (n = 1), Pyr L2/L3 (n = 1) | |||
| 9 | −1.06 | AM/CM | 1.94 | PrL | LS L1 (n = 1), Pyr L2/L3 (n = 1) |
| 1.18 | Cg1 | Other L1 (n = 2) | |||
| 10 | −1.06 | AM/PC/CM | 1.98 | Cg1 | LS L1 (n = 1), NLS L1 (n = 1) |
| 1.54 | Cg1 | LS L1 (n = 1) | |||
| 0.98 | Cg2 | NLS L1 (n = 1), other L1 (n = 1) | |||
| 11 | −1.06 | AM/IAM/CM | 1.18 | Cg2 | Pyr L2/L3 (n = 2) |
| 0.74 | Cg2 | LS L1 (n = 1), other L1 (n = 1) | |||
| 0.14 | Cg2 | NLS L1 (n = 1) | |||
| 12 | −1.06 | AM/IAM | 0.38 | Cg2 | LS L1 (n = 1) |
| 13 | −1.06 | PC/AM | −0.10 | Cg1 | LS L1 (n = 1), other L1 (n = 1) |
| Cg2 | Other L1 (n = 2) | ||||
| 14 | −0.70 | Re | 1.98 | Cg1 | Other L1 (n = 2) |
| 1.54 | PrL | Other L1 (n = 1), Pyr L2/3 (n = 1) | |||
| 15 | −1.46 | Rh | 1.18 | Cg2 | Other L1 (n = 2) |
| 16 | −1.34 | Rh | 1.98 | Cg1 | NLS L1 (n = 1), other L1 (n = 1) |
| 1.18 | Cg2 | Other L1 (n = 1) | |||
Locations of thalamic virus injections for each mouse (columns 2 and 3) were determined from EYFP expression in slices (>8 d after injections), aided by the mouse brain atlas of Paxinos and Franklin (2001). Centers of the injections are indicated by both anteroposterior (AP) position relative to bregma and the thalamic nuclei involved. The injections included in the study were centered on ventromedial, anteromedial, reuniens, or rhomboid thalamic nuclei and resulted in concentrated terminal arbors in outer L1 of mPFC. Injections involving mediodorsal thalamic nucleus also resulted in outer L1 projections, but the mediodorsal thalamic nucleus projections had additional terminations in L3 (n = 2; data not shown). Given the potential for light scattering to L3 axons during high-intensity L1 stimulation, we chose not to study TC synapses in these animals. Locations of the cortical cells from which TC synaptic responses were measured are shown in columns 4 and 5, and cell types are shown in column 6. For each mouse/injection, the recordings were generally targeted to the region of most intense terminal labeling within L1 of mPFC. AM, Anteromedial thalamic nucleus; Cg1 and Cg2, cingulate cortices, areas 1 and 2; CM, central medial thalamic nucleus; IAM, interanteromedial thalamic nucleus; LS L1, late-spiking interneuron in L1; MD, mediodorsal thalamic nucleus; M2, secondary motor cortex; NLS L1, non-late-spiking interneuron in L1; Other L1, uncategorized interneuron in L1; PC, paracentral thalamic nucleus; PrL, prelimbic cortex; Pyr L2/L3, pyramidal cell in L2 or L3; Re, reuniens thalamic nucleus; Rh, rhomboid thalamic nucleus; Sub, submedius thalamic nucleus; VM, ventromedial thalamic nucleus (Paxinos and Franklin, 2001).
Viral DNA was generously provided by Karl Deisseroth (Stanford University, Stanford, CA). For all of the TC injections and one-third of the PFC injections, we used a lentivirus [pLenti–synapsin–ChR2(H134R)–EYFP–WPRE] that had an enhanced ChR2–EYFP fusion gene driven by a synapsin1 promoter. For the remainder of the PFC injections, we instead used adeno-associated viruses (AAVs): pAAV–CaMKIIa–hChR2(H134R)–EYFP and pAAV–Ef1a–DIO–hChR2(H134R)–EYFP were each used for one-third of the CC experiments. Sequence information can be found at www.stanford.edu/group/dlab/optogenetics/. After amplification using Qiagen kits, vesicular stomatitis virus-G pseudotyped lentivirus or AAV2 or AAV2/5 viruses were produced at the University of Pennsylvania Vector Core. Injection volumes were 0.2–2 μl. All three viruses produced effective ChR2–EYFP expression in cells at the injection sites and in their downstream axons and terminals, including those in L1 of PFC.
Of the 45 mice studied here, 37 had ICR genetic backgrounds and eight had mixed backgrounds (either ICR/C57 or ICR/FVB). Three of the latter were Cre driver mice from GENSAT (the MR90–CRE line) in which we injected a Cre-dependent virus [pAAV–Ef1a–DIO–hChR2(H134R)–EYFP] into the PFCs to obtain ChR2 expression mainly in L3 pyramidal cells.
Slices and solutions.
After allowing 8–90 d for ChR2 expression (usually ∼14 d), acute brain slices (325–375 μm thick, coronal plane) containing mPFC areas ipsilateral to the virus injections were made for in vitro recording and optical stimulation using previously described methods (Cruikshank et al., 2010). The mPFC areas targeted for recording included the first and second cingulate cortices (Cg1 and Cg2), the prelimbic cortex (PrL), and occasionally the infralimbic cortex (IL), medial orbital cortex, or the border between Cg1 and the secondary motor cortex (M2) as defined by the atlas of Paxinos and Franklin (2001). Mean and median ages at the day of recording were P28 and P27, respectively. Experiments were conducted at 32°C in a submersion recording chamber. Slices were bathed in artificial CSF (ACSF) containing the following (in mm): 126 NaCl, 3 KCl, 1.25 NaH2PO4, 2 MgSO4, 26 NaHCO3, 10 dextrose, and 2 CaCl2 (saturated with 95% O2/5% CO2). Patch micropipettes were filled with the following (in mm): 130 K-gluconate, 4 KCl, 2 NaCl, 10 HEPES, 0.2 EGTA, 4 ATP-Mg, 0.3 GTP-Tris, and 14 mm phosphocreatine-K, pH 7.25 (∼290 mOsm). All drugs were applied through the bathing solution.
Whole-cell recordings and measurements of intrinsic properties.
Cells in L1–L3 of mPFC were visualized with infrared differential interference contrast (DIC) microscopy and initially targeted by anatomical position and soma size/shape. After achieving whole-cell configurations, intrinsic membrane and synaptic properties of the neurons were characterized (Beierlein et al., 2003; Chu et al., 2003; Cruikshank et al., 2007; Lee et al., 2010). Recordings were conducted with Molecular Devices hardware and software (Multiclamp 700B, Digidata 1440A, pClamp 10). Series resistances (∼12–30 MΩ) were compensated online (100% for current clamp, 50–70% for voltage clamp). Voltages were corrected for a 14 mV liquid junction potential. Resting potentials were measured within 2 min of break-in, and then steady-state potentials were usually adjusted to −79 mV with intracellular current. Membrane time constants (τm), input resistances (Rin), and input capacitances (Cin) were calculated from voltage responses to small negative current injections (typically 10–20 pA, 600 ms). For τm, the voltage responses were fitted with a single exponential to the initial 100 ms of the response, omitting the first 1 ms. Rin was determined from Ohms law. Cin was calculated as τm/Rin. Sag potentials were determined using large negative currents (>100 pA, 600 ms) that reached peak negative potentials of −115 mV or greater. Peak sag amplitude was measured relative to the voltage at the end of the 600 ms current step. Latency-to-sag peak was measured from the onset of the step. Sag width was measured at half of the peak amplitude.
Intrinsic spiking properties were characterized by injecting suprathreshold positive current steps (usually ≥50 pA). Spike threshold was determined as the membrane potential occurring 50 μs before the peak of the third derivative of the voltage, verified by visual inspection. Peak spike amplitude was measured relative to threshold. Spike width was measured at half of the peak amplitude. Afterhyperpolarization was measured as the voltage change from spike threshold to the trough after the spike. Spike latency was measured relative to the onset of a 600 ms threshold intensity current injection. Spike frequency adaptation was quantified by calculating the adaptation ratio, defined as the number of spikes in the second half of a 600 ms current injection divided by the number of spikes in the first half, averaged across all sweeps in which the cell fired at mean rates of 10–40 Hz. Cells were tested for the presence of slow afterdepolarizations by injecting a 3–5 ms suprathreshold current and then determining whether or not the resulting spike was followed by an afterdepolarization (with a 30–100 ms latency to peak) (Hestrin and Armstrong, 1996; Chu et al., 2003).
Optical stimulation of ChR2-expressing pathways and postsynaptic recordings.
Synaptic responses to blue laser stimulation (447 nm) of the ChR2-expressing TC or CC axons were measured from postsynaptic cortical neurons (which were ChR2 negative) recorded in whole-cell current clamp and voltage clamp. The laser was focused as a 10-μm-diameter spot through a 40× water-immersion objective. Maximum total laser power of the optical stimulation system at the focal plane of the slice was ∼11.3 mW. In many experiments, the intensity was reduced (specified in Results). For synaptic stimulation, 0.1–2 ms flashes (usually 1 ms) were delivered either directly in or near the cortical column of the recorded cell to excite the ChR2-expressing axons and terminals in the TC or CC pathways that were presynaptic to the recorded cell. Error bars in the figures are SEM.
Results
The majority of virus injections into paralaminar and midline thalamic nuclei (16 of 24) resulted in ChR2/EYFP-expressing TC terminal arbors that were concentrated in the outer half of cortical L1. An example illustrating the fluorescence expression pattern is shown in Figure 1A. Using functional mapping (Petreanu et al., 2009), we found that excitable matrix TC axons and synapses were localized to outer L1, consistent with the fluorescence patterns (Fig. 1B–D). For example, optical stimulation of ChR2-expressing TC axons in outer L1, in which EYFP labeling was intense, evoked strong postsynaptic responses in L1 cortical neurons (Fig. 1B,C). In contrast, stimulation of deeper locations, such as the faintly labeled L1–L2 boundary region, was far less effective (Fig. 1C). A similar laminar gradient of effective stimulation sites was observed when TTX and 4-AP were applied to block axon conduction but allow direct optical stimulation of ChR2-expressing boutons (Petreanu et al., 2009; Cruikshank et al., 2010) (Fig. 1D). Under these pharmacological conditions, the locations of effective optical stimulation sites correspond with the locations of ChR2-expressing synapses; thus, it appears that the highest density of matrix TC synapses were in outer L1 (Fig. 1D). The locations of thalamic injections used in the synaptic experiments that follow are presented in Table 1. Consistent with previous anatomical studies, the thalamic origins of outer L1 projections included the ventromedial, anteromedial, reunions, or rhomboid nuclei (i.e., paralaminar and ventral midline nuclei; Table 1) (Krettek and Price, 1977; Herkenham, 1986; Vogt, 1991; Monconduit and Villanueva, 2005; Rubio-Garrido et al., 2009). We also observed that injections into several other thalamic nuclei, including the paratenial nucleus, resulted in projections to inner or middle tiers of L1 (n = 7; data not shown); these are not further considered here.
Figure 1.

Matrix TC projections terminate in outer L1 of mPFC, and their activation drives robust synaptic responses in L1 interneurons. A, Example of matrix TC terminal labeling in cortical L1. Left, Drawing of coronal slice at the focus of the thalamic virus injection (1.82 mm posterior from bregma). The injection was centered on the ventromedial (VM) thalamus (symbolized by green shading). Right, Drawing of coronal slice at plane that received dense TC projections (1.94 mm anterior to bregma). Dashed red rectangle indicates region shown at high magnification in adjacent bright-field (DIC) and fluorescence (EYFP) images. Location of L1–L2 boundary in fluorescence image indicated by dashed line. Intense EYFP/ChR2 labeling of TC arbors was concentrated in outer L1 of the mPFC areas IL, PrL, and Cg, as well as M2. B, Robust TC synaptic responses from an L1 interneuron recorded ∼38 μm from the pia (near position 2 in A). High-intensity laser flashes (11.3 mW, 1 ms, 10 Hz train) were centered ∼30 μm from the pia, near the soma. Green arrows indicate flash times. Spikes were evoked in 4 of 10 sweeps. Inset shows time-locked EPSPs after synaptic delay for two sweeps, one of which leads to a spike. C, Lower-intensity flashes (0.54 mW) evoked subthreshold EPSPs. Short-term synaptic depression was apparent during 10 Hz trains. EPSPs were far stronger when stimuli were delivered near TC terminals in outer L1 (same location as in B) than at L1–L2 border (position 4 in A, right). Similar patterns were observed in 18 of 18 tested L1 cells; PSP responses to matching low-intensity stimuli (mean, 0.76 ± 0.13 mW) averaged 6.4 ± 1.5 mV versus 0.7 ± 0.1 mV for stimuli to outer L1 and the L1/L2 border, respectively. D, Functional evidence that matrix TC synapses are located in outer L1. TTX (1 μm) and 4-AP (1 mm) were applied to block axon conduction but allow optogenetic excitation of ChR2-expressing presynaptic boutons (Petreanu et al., 2009; Cruikshank et al., 2010), and then EPSPs to laser stimuli (2.6 mW) covering a range of positions (positions 1–7 in A) were recorded (from the same interneuron as in B, C) to map the laminar locations of the TC synapses. Responses were strongest for stimuli in outer L1 (positions 1–2), consistent with the EYFP fluorescence pattern. Steady-state Vm was −79 mV for B–D. CL, Centrolateral thalamic nucleus; CM, central medial thalamic nucleus; Ins, insular cortex; M1, primary motor cortex; MD, mediodorsal thalamic nucleus; Pir, piriform cortex; Po, posterior thalamic nucleus; Re, reuniens thalamic nucleus; S1, primary somatosensory cortex; VM, ventromedial thalamic nucleus; VP, ventral posterior thalamic nucleus.
Matrix TC projections are widespread (Herkenham, 1986; Van der Werf et al., 2002; Monconduit and Villanueva, 2005; Jones, 2007; Rubio-Garrido et al., 2009), and there is a long-held assumption that their synaptic effects are slow and diffuse, potentially important for modulating cortical tone rather than for transmitting the kinds of temporally precise information carried by core sensory TC projections (Morison and Dempsey, 1941; Moruzzi and Magoun, 1949; Jasper, 1960; Shah and Schiff, 2010). In contrast to this assumption, we found that optical stimulation of matrix TC arbors within L1 drove robust and fast postsynaptic responses in mPFC neurons, including L1 interneurons and L2/L3 pyramidal cells (see Figs. 1–3). Mean EPSP amplitudes were 9.8 ± 1.2 mV and onset latencies were 2.4 ± 0.1 ms (n = 53 and 50 cells, respectively; 1.0 ms laser stimuli applied to L1 at maximum intensity). As illustrated in Figure 1B, optical activation of the matrix TC synapses could, in some cases, drive action potentials in postsynaptic neurons (13 of 53 tested neurons).
Figure 2.
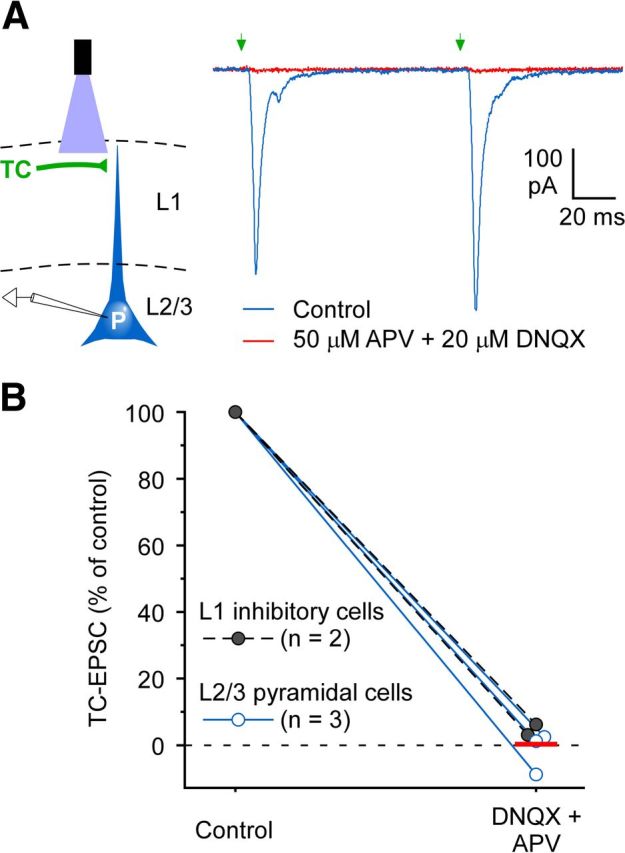
Matrix TC synaptic responses in mPFC require ionotropic glutamate receptors. A, Left, Schematic of whole-cell recording from an L2/L3 pyramidal cell (P) during optical stimulation of matrix TC axons in L1. Right, Effects of glutamate receptor antagonists on TC responses in a pyramidal cell (Vhold = −89 mV). In control ACSF, pairs of TC laser stimuli (1 ms, 11.3 mW, 10 Hz, aimed 30 μm below the pia) evoked fast EPSCs (blue trace). Combined infusion of 50 μm APV and 20 μm DNQX for 6–10 min blocked the EPSCs almost fully (red). The pyramidal cell body was located 20 μm below the L1/L2 border in PrL, 1.7 mm anterior to bregma. The thalamic virus injection was centered 1.06 mm posterior from bregma in the anteromedial thalamic nucleus/submedius thalamic nucleus. B, Ionotropic glutamate receptor antagonists had similar suppressive effects on the matrix TC responses of L2/L3 pyramidal cells (n = 3, blue symbols) and L1 interneurons (n = 2, black symbols). Response areas (integrated over the initial 50 ms of EPSCs) were measured while cells were held at −89 mV holding potentials. Infusion of 50 μm APV and 20 μm DNQX for 6–12 min blocked the EPSCs nearly completely. The red horizontal bar indicates the mean response for the five cells tested during antagonist infusion.
Figure 3.

L1 inhibitory interneurons are excited more strongly than pyramidal cells by matrix TC input. A, Schematic of dual whole-cell recording from an L1 inhibitory interneuron (I) and a L2/L3 pyramidal cell (P) during optical stimulation of ChR2-expressing matrix TC axons (blue light and green axons, top). B, Synaptic responses to matrix TC input; recordings and stimulation as depicted in A. The L1 interneuron responded far more strongly than the simultaneously recorded pyramidal cell in both current-clamp (IC) and voltage-clamp (VC) modes. The thalamic injection was centered on the anteromedial thalamic nucleus, 0.7 mm posterior from bregma. The cortical cell pair was recorded in area Cg1, 2.22 mm anterior to bregma. The interneuron was 90 μm from the pia, and the pyramidal soma was 160 μm from the pia, just below the L1/L2 border (within 15 μm). Laser flashes were 11.3 mW, delivered ∼20 μm below the pia, directed at the dense TC terminal labeling in L1. Steady-state Vm in current clamp was −79 mV, and Vhold in voltage clamp was −89 mV. C, Left, Mean TC-evoked EPSP amplitudes across the population of L1 inhibitory interneurons were nearly threefold larger than those of L2/L3 pyramidal cells (p < 0.05, repeated-measures ANOVA, interneuron vs pyramidal groups). In 11 of 12 pyramidal cells, the responses of the pyramidal cell were weaker than any of the L1 interneurons recorded from the same brains. Optical stimuli were 11.3 mW delivered in L1, typically 20–50 μm below pia. Thalamic virus injections were centered on the ventromedial, anteromedial, reuniens, or rhomboid thalamic nuclei, and all resulted in clear ChR2-expressing projections to outer L1. The intensity of ChR2 expression in L1 TC axons was approximately similar for slices containing the interneurons and the pyramidal cells. Seven of the 12 pyramidal cells were recorded simultaneously with a paired L1 interneuron in the same cortical column, so ChR2 expression of their inputs was matched. For the remaining five pyramidal cells, at least one interneuron was recorded from the same brain as the pyramidal cell, although not simultaneously. For three of these cases, the L1 TC fluorescence levels for slices containing the pyramidal cells and interneurons were within ∼10%. In the other two cases, they were ∼30% stronger for the pyramidal cell slices. Right, Short-term synaptic dynamics of the TC-evoked EPSPs were significantly different for the two postsynaptic cell groups (p < 0.02, repeated-measures ANOVA). Pyramidal responses typically underwent an initial facilitation during repetitive stimulation, whereas the interneuron responses immediately depressed.
The short latencies of the TC responses suggest that they are likely mediated by fast ionotropic rather than metabotropic (i.e., modulatory) glutamate receptors. To test this directly, we blocked ionotropic NMDA- and AMPA/kainate-type glutamate receptors while monitoring the effects on TC-evoked synaptic responses. Combined application of these glutamate receptor antagonists essentially eliminated the responses, with no obvious slow metabotropic receptor-mediated components remaining (Fig. 2). Thus, matrix thalamic pathways to L1 of mPFC excite postsynaptic cells mainly via fast ionotropic glutamate receptors, and these circuits could, in principle, carry high-fidelity information.
It has been suggested previously that TC synapses within L1 are mainly located on distal dendrites of pyramidal cells that extend apical processes into L1 (Vogt, 1991; Jones, 2001; Monconduit and Villanueva, 2005; Murayama et al., 2009; Rubio-Garrido et al., 2009). Thus, excitatory TC inputs to L1 would presumably depolarize the membrane potentials of pyramidal cells, enhancing their ability to respond to synaptic signals from other sources that are directed more proximally. However, other potential targets of TC terminals in L1 are the often-neglected inhibitory interneurons that inhabit the layer (Zhou and Hablitz, 1996a; Chu et al., 2003; Zhu and Zhu, 2004; Lee et al., 2010; Wozny and Williams, 2011; Arroyo et al., 2012). Unexpectedly, we found that matrix TC pathways were much more effective at exciting L1 interneurons than L2/L3 pyramidal cells. This is illustrated in Figure 3, A and B, with a simultaneously recorded cell pair. In that pair, the TC-evoked EPSCs were ∼3.5 times larger in the L1 interneuron than in the L2/L3 pyramidal cell, and there were even larger differences in EPSPs for the two cells (Fig. 3B; VC and IC, respectively). Across the tested population, L1 cells had approximately threefold larger TC-evoked EPSPs than the pyramidal cells (Fig. 3C). The L1 interneurons were also more likely than pyramidal cells to be excited above spike threshold by matrix TC input (29% of interneurons vs 8% of pyramidal cells). In addition to differences in response amplitudes, there were clear differences in short-term synaptic dynamics among postsynaptic cell types, with pyramidal responses typically undergoing initial facilitation during repetitive TC stimulation, whereas interneuron responses generally exhibited modest depression (Figs. 1C, 2A, 3B,C; discussed below).
Interneurons of L1, which are believed to be exclusively GABAergic, are physiologically, morphologically, and neurochemically heterogeneous (Zhou and Hablitz, 1996a; Chu et al., 2003; Zhu and Zhu, 2004; Lee et al., 2010; Wozny and Williams, 2011). Although no consensus exists regarding nomenclature of L1 cells, we were able to use previously described criteria (Chu et al., 2003; Zhu and Zhu, 2004; Lee et al., 2010) to classify the majority of our recorded L1 interneurons into unambiguous late-spiking (LS) or non-late-spiking (NLS) types (Fig. 4, Table 2). The remaining L1 interneurons could not be definitively assigned to either group and were therefore left uncategorized. Strikingly, this sorting revealed that TC responses of LS cells were more than twice as large as those of NLS cells, on average (Fig. 4C,D). We also found that NLS cell bodies tended to cluster in the inner half of L1, whereas LS cells were more dispersed (Fig. 4E). This anatomical distinction could potentially explain the weaker TC responses in NLS cells. Recall that matrix TC terminals were located in outer L1 (Fig. 1, Table 1), relatively far from the NLS somata. In contrast, these TC terminals were spatially intermixed with a large fraction of LS somata, putting the LS cells in a potential position to receive effective TC synaptic input on their proximal dendrites. Consistent with the idea that terminal–somata proximity could affect response strength, there was a marked overall correlation between somatic position in L1 and TC-evoked EPSP amplitude, with cells in outer L1, near the TC terminals, responding most strongly (Fig. 4F).
Figure 4.

Distinct interneuron subtypes have different TC-evoked response strengths, consistent with their spatial distributions in L1. A, Intrinsic physiological properties of an LS interneuron in L1. Top left, Absence of spike frequency adaptation during moderate spike rates (Chu et al., 2003). Middle left, A marked delay from current onset to the time of first spike during a just-suprathreshold current (Chu et al., 2003; Zhu and Zhu, 2004; Lee et al., 2010). Inset shows large afterhyperpolarization at high magnification (dashed arrow) (Chu et al., 2003; Lee et al., 2010). Bottom left voltage trace, Extremely fast voltage sag (arrow) and no conventional slower sag in response to a large hyperpolarizing current. We found this to be a consistent feature that distinguished LS from NLS cells. Injected current amplitudes for top, middle, and bottom left: +165, +155, and −725 pA. Bottom right, A slow afterdepolarization (ADP) after single spikes evoked by short (3 ms), large amplitude (+550 pA), current pulses (Chu et al., 2003). This LS cell was in Cg2, 0.98 mm anterior to bregma, 80 μm from the pia. B, Intrinsic physiological properties of an NLS interneuron in L1. Top left, Relatively strong spike frequency adaptation during moderate spike rates. Middle left, Only a short latency from current onset to the time of the first spike during a just-suprathreshold current. Inset shows a small afterhyperpolarization (dashed arrow). Bottom left voltage trace, A conventional slow voltage sag (arrow) in response to a hyperpolarizing current, with slower kinetics than in LS cells. Current amplitudes: +130, +70, and −150 pA. Bottom right, No slow afterdepolarization after single spikes (current, +300 pA). This NLS cell was in Cg1, 0.86 mm anterior to bregma, 120 μm from the pia. C, Top, Schematic for dual whole-cell recording of synaptic responses from an LS and NLS cell to optical stimulation of ChR2-expressing matrix TC axons. Bottom, TC-evoked EPSP amplitudes of the LS cell were more than twice those of the simultaneously recorded NLS cell. The cell pair was in area Cg1, 1.98 mm anterior to bregma (LS cell was 90 μm and NLS cell was 120 μm below the pia). The thalamic injection was centered on the anteromedial thalamic nucleus, 1.06 mm posterior from bregma. Laser flashes were 11.3 mW, aimed directly between the two cells. Steady-state membrane potentials were between −79 and −81 mV for A–C. D, Mean group TC-evoked EPSP amplitudes of LS cells were more than double those of NLS cells (p < 0.03, repeated-measures ANOVA, LS vs NLS groups). Optical stimuli were 11.3 mW aimed at or near the recorded cells within L1. Thalamic virus injections were centered on the ventromedial, anteromedial, reuniens, or rhomboid thalamic nuclei, and all resulted in clear ChR2-expressing projections to outer L1. The ChR2–EYFP fluorescence intensities in L1 were approximately equal for the slices containing the NLS cells and the slices containing the LS cells from the same brains (within 10%, n = 5; data not shown). E, Sublamination of interneuron types within L1. Histograms indicate number of recorded cells of each type as a function of the percentage distance between the pia (0%) and the L2 border (100%). The NLS cells were found in the lower half of L1, whereas the LS and other (unclassified) L1 cells were more evenly distributed throughout the layer. F, There was a significant correlation between matrix TC-evoked PSP amplitudes and interneuron soma location within L1 (p < 0.03, r = 0.35, n = 41). Responses tended to be large for cells located in outer L1 and smaller for cells of inner L1. Optical stimuli, thalamic virus injections, and their projections same as D.
Table 2.
Intrinsic cell properties
| L1 interneurons |
L2/3 Pyramidal cells (all n ≥ 24) | |||
|---|---|---|---|---|
| LS (all n ≥ 14) | NLS (all n ≥ 11) | Other L1 cells (all n ≥ 9) | ||
| Postnatal age at time of recording (days) | 26.0 ± 0.7 | 29.1 ± 2.1 | 27.3.x ± 0.4 | 27.1 ± 1.6 |
| Resting potential (mV) | −82.1 ± 0.7 | −74.1 ± 1.2 | −76.8 ± 1.3 | −81.2 ± 1.1 |
| Input resistance (MΩ) | 283.1 ± 17.7 | 359.8 ± 30.2 | 268.7 ± 20.6 | 231.6 ± 14.8 |
| Input capacitance (pF) | 60.1 ± 2.3 | 57.5 ± 2.6 | 66.5 ± 2.9 | 175.2 ± 8.9 |
| Membrane time constant (ms) | 15.9 ± 0.6 | 19.5 ± 0.9 | 16.4 ± 0.5 | 38.7 ± 2.1 |
| Voltage sag amplitude (mV) | 2.9 ± 0.4 | 5.9 ± 0.9 | 2.3 ± 0.4 | Not tested |
| Voltage sag latency (ms) | 20.6 ± 5.6 | 118.0 ± 22.1 | 41.1 ± 12.9 | Not tested |
| Voltage sag width (ms) | 37.6 ± 13.4 | 198.0 ± 16.6 | 87.0 ± 31.6 | Not tested |
| Action potential threshold (mV) | −49.1 ± 0.5 | −51.3 ± 0.5 | −51.3 ± 0.6 | −50.1 ± 0.4 |
| Action potential amplitude (mV) | 68.0 ± 1.0 | 76.8 ± 1.2 | 71.4 ± 1.1 | 85.8 ± 0.9 |
| Action potential width (ms) | 0.81 ± 0.02 | 0.67 ± 0.02 | 0.72 ± 0.02 | 1.06 ± 0.02 |
| Afterhyperpolarization amplitude (mV) | 19.1 ± 0.6 | 13.1 ± 0.6 | 14.2 ± 0.7 | 16.4 ± 0.7 |
| Afterhyperpolarization latency (ms) | 7.0 ± 0.5 | 9.3 ± 2.0 | 6.0 ± 0.8 | 52.2 ± 3.9 |
| Action potential latency (ms) | 266.9 ± 21.2 | 71.5 ± 6.6 | 94.0 ± 16.0 | Not tested |
| Slow ADP incidence = (number of cells with ADP/number of cells tested) | 20/22 | 0/11 | 7/12 | Not tested |
| Spike frequency adaptation ratio | 1.02 ± 0.02 | 0.59 ± 0.03 | 0.87 ± 0.03 | 0.74 ± 0.01 |
Values are means ± SEM for each of the cell groups, except for the “slow ADP incidence.” The latter is the tally of cells in which a slow afterdepolarization (ADP) was observed relative to number tested. Details of the measurements are described in Materials and Methods. LS and NLS cells differed on all of the measures listed except postnatal age, input capacitance, and afterhyperpolarization latency (p < 0.02, Fisher's exact test for slow afterdepolarization incidence and Mann–Whitney U test for all others). The “Other L1 cell” group generally had values between the LS and NLS groups (exceptions are input resistance and capacitance, voltage sag amplitude, and afterhyperpolarization latency). Properties used to categorize the L1 interneurons into LS or NLS groups included the voltage sag measures, afterhyperpolarization amplitude, action potential latency (at threshold), slow afterdepolarization incidence, and spike frequency adaptation ratio. A variety of intrinsic properties are also presented for L2/L3 pyramidal cells as a reference for comparison with the L1 interneurons. Pyramidal cells had higher input capacitances, longer time constants, and larger/wider action potentials with slower afterhyperpolarizations than the L1 interneurons (p < 0.001, Mann–Whitney U test).
Although NLS cells received relatively weak TC input, we observed that they could respond quite strongly to optogenetically activated CC excitatory input (Fig. 5). In contrast with the TC terminals, CC terminals were often observed in inner L1, near the NLS somata (Fig. 5) (Vogt et al., 1981; Vogt, 1991; Miró-Bernié et al., 2006; Smith et al., 2010). These data suggest a possible sublamination of inhibitory information processing in L1, with NLS cells concentrated in the inner tier, interacting preferentially with CC circuits, and LS cells handling the TC signals that arrive in the outer tier. It will be important to investigate the possible effects of such sublaminar processing in future studies, especially given previous observations that NLS cells are more likely than LS cells to send inhibitory axons to deep cortical layers (Chu et al., 2003; Zhu and Zhu, 2004).
Figure 5.

NLS cells in mPFC respond to CC input that terminates in inner L1. A, Example of CC projections that terminate in inner L1 of mPFC. The virus injection was centered ∼2.5 mm anterior to bregma in the ipsilateral PrL (data not shown). CC terminal arbors were widespread, but in some prefrontal cortical regions, and often in Cg1 as illustrated, the terminals were concentrated in inner L1. Bright-field (DIC) and fluorescence (EYFP) images of a slice with heavy terminal labeling in inner L1 are shown (0.86 mm anterior to bregma). Location of pia in EYFP image indicated by dashed line. B, Functional evidence that CC axons are located in inner L1. EPSC responses of an NLS cell to laser stimuli (1.1 mW) covering a range of positions (positions 1–7 in A) were recorded to map the laminar locations of the CC synapses. Responses were strongest for stimuli in inner L1 and L2 (positions 3 and 4), approximately consistent with the EYFP fluorescence pattern. Holding potential, −89 mV. Cell located 120 μm below pia, 28 μm above L1/L2 border (at position 3 in A). Six other NLS cells were similarly mapped after cortical virus injections, and all responded better to CC optical stimuli delivered to inner L1 than to outer L1. C, Robust CC synaptic responses from the same NLS cell as in B with stimulus aimed at the soma. Same intensity laser flashes (1.1 mW, at position 3 in A). Green arrows indicate flash times. Recording is in current clamp. Inset shows time-locked EPSPs after synaptic delay for two sweeps, one of which led to a spike. D, Mean NLS cell responses to CC inputs were larger than to matrix TC input. TC responses redrawn from Figure 4D. CC responses include six NLS cells in Cg1, far posterior from the virus injections or the cells in the ipsilateral PrL that gave rise to the CC terminals (mean anteroposterior separation between the injection and recording sites were 1.35 ± 0.20 mm). The remaining three NLS cells were in L1 of PrL, in the same column as the cells that gave rise to the CC terminals. Mean CC-evoked EPSPs across the NLS cells were approximately twice the amplitudes of those evoked by TC input. Both the CC and TC stimuli were 11.3 mW, delivered over the recorded NLS cells (mean percentage distances between the pia and white matter for the NLS cells were 72.1 ± 3.8% for the CC experiments and 69.9 ± 4.0% for the TC experiments. Average ChR2–EYFP expression levels across the L1 presynaptic arbors were approximately comparable for the CC and TC experiments (their fluorescence levels were within 10%). Steady-state potentials were approximately −79 mV for C and D. E, Example with sublaminar separation of TC and CC arbors in L1 of mPFC. Viruses carrying genes for ChR2–MCherry and ChR2–EYFP fusion proteins were injected in paralaminar/midline thalamus and mPFC, respectively. The thalamic injection was focused approximately −1.6 mm from bregma, infecting ventromedial, reuniens, and rhomboid thalamic nuclei. The cortical injection was approximately +2.3 mm from bregma, infecting mainly PrL. Neither injection site is shown. Anterograde projections were widespread, but some cortical target areas showed segregation of TC and CC axons within L1, as in the example shown here (imaged slice was approximately +0.14 mm from bregma, centered over Cg1–Cg2). The MCherry-expressing TC terminals (red) are predominately located in outer L1, whereas the EYFP-expressing CC terminals (green) are more focused on inner L1.
It is clear from the present findings that matrix TC inputs can strongly excite L1 interneurons (especially LS cells; Figs. 1, 3, 4), so we next tested the consequences of this activation. As a first step, we used paired whole-cell recordings to characterize the synaptic connections between L1 interneurons and neighboring cortical cells in mPFC. L1 interneurons had high probabilities of forming inhibitory synapses onto L2 pyramidal cells and other L1 interneurons (∼50% incidence; Fig. 6A–C). IPSPs in both types of postsynaptic cells underwent similar short-term depression when stimulated repetitively at 10 Hz. The unitary IPSPs were smaller and had slower rates of rise in postsynaptic pyramidal cells than in interneurons, consistent with more distal synaptic locations for the pyramidal cells (Fig. 6A–C). Unlike inhibition, excitatory connections between L2 pyramidal cells and L1 interneurons were rare (1 of 19 pairs), similar to results from somatosensory cortex (Chu et al., 2003; Wozny and Williams, 2011).
Figure 6.

Widespread unitary inhibition and matrix TC-evoked feedforward inhibition mediated by L1 interneurons. A, Unitary IPSPs between pairs of L1 interneurons have fast kinetics and strong short-term depression. Top, Schematic of paired cell recording between presynaptic (I1) and postsynaptic (I2) L1 interneurons. Middle, IPSP in a postsynaptic LS cell evoked with single spikes in a neighboring presynaptic LS cell. The cells were located in Cg2, 0.98 mm anterior to bregma. Bottom, IPSP train in an unclassified L1 cell evoked with repetitive spikes in a presynaptic NLS cell. Cells in Cg1, 0.86 mm anterior to bregma. B, Unitary IPSPs between L1 inhibitory interneurons and L2 pyramidal cells have slower kinetics and strong short-term depression. Top, Schematic of paired cell recording between presynaptic interneuron (I) and postsynaptic pyramidal cell (P). Middle, IPSP in a pyramidal cell evoked with single spikes in a presynaptic LS cell. Cells in PrL, 2.1 mm anterior to bregma. Bottom, IPSP train in pyramidal cell evoked with repetitive spikes in a presynaptic NLS cell. Cells in PrL, 1.7 mm anterior to bregma. C, Group data comparing unitary IPSPs for postsynaptic L1 interneurons versus postsynaptic pyramidal cells. Inhibitory synapse incidence equals the number of cell pairs with inhibitory connections divided by the total number of pairs tested (25 of 44 for postsynaptic L1 cells, 9 of 19 for postsynaptic L2 pyramidal cells). Paired-pulse ratios (i.e., IPSP amplitude evoked by the second spike in a short train divided by IPSP amplitude evoked by the first spike) were measured at average presynaptic spike intervals of 58.6 ± 2.9 ms (range, 20–100 ms). Steady-state potentials of postsynaptic cells were between −62 and −67 mV for IPSP measurements in A–C. IPSP amplitudes were smaller, and rise times longer, for pyramidal cells than for L1 interneurons (p values <0.02, unpaired t tests, n = 34). D, Optical stimulation of matrix TC axons led to disynaptic feedforward inhibition. Left, Schematic of circuitry and recording of feedforward inhibition. Optical stimulation of TC axons in L1 excites both L1 interneurons (I) and pyramidal cells with apical dendrites in L1 (P). Excitation of the interneurons causes IPSPs in pyramidal cells. Middle, TC-evoked postsynaptic currents recorded from a pyramidal cell in voltage clamp. The fastest response was a monosynaptic EPSC (strongest at −89 mV holding potential). There was subsequently a disynaptic IPSC after a short delay (strongest at +6 mV). The EPSC and IPSC can both be seen at −54 mV, between the reversal potentials for excitation and inhibition. The dotted red line is drawn at the onset of the EPSC. Right, PSC trains evoked by repetitive optical TC stimulation from same cell. Note short-term facilitation of the EPSC (at −89 mV) and depression of the IPSC (at +6 mV). Laser flashes were 11.3 mW, 30 μm below pia. Cell located in PrL, 1.7 mm anterior to bregma, 15 m below the L1/L2 border.
The observations that L1 interneurons are excited by TC inputs and inhibit neighboring neurons leads to the prediction that matrix TC activation should initiate disynaptic feedforward inhibition. We confirmed this prediction: optical stimulation of TC axons in L1 resulted in feedforward inhibition in 7 of 15 L1 interneurons and 7 of 8 L2/L3 pyramidal cells tested (Fig. 6D). This inhibition was generally strongest early during a 10 Hz TC stimulus train and then depressed subsequently (Fig. 6D; responses at +6 mV). In pyramidal cells, the valence of short-term plasticity for disynaptic inhibition was opposite that for monosynaptic TC excitation, because excitatory responses facilitated slightly during the first few stimuli in a train (Figs. 2A, 3C, 6D).
Discussion
We have shown that matrix TC axons make robust synapses with both excitatory and inhibitory cell targets in outer L1 of mPFC. The matrix TC inputs most strongly excited inhibitory interneurons of L1, and it is highly probable that these interneurons mediated the rapid feedforward inhibition observed after TC stimulation.
L1 cells have only rarely been considered in discussions of TC circuitry (Mitani and Shimokouchi, 1985; Vogt, 1991; Zhu and Zhu, 2004). This is surprising given recent interest in these cells and studies of their developmental origins (Lee et al., 2010; Rudy et al., 2011), unique features of their physiology, pharmacology, and morphology (Christophe et al., 2002; Chu et al., 2003; Zhu and Zhu, 2004; Wozny and Williams, 2011; Arroyo et al., 2012), and their critical roles in learning and sensory processing (Letzkus et al., 2011; Palmer et al., 2012). L1 neurons are also interesting because of emerging evidence that disruption of inhibition and interneurons, including L1 interneurons, has a pivotal role in neuropsychiatric diseases (Lewis et al., 2005; Ruzicka et al., 2007; Yizhar et al., 2011b; Marín, 2012).
Recently, Letzkus et al. (2011) made the remarkable observation that L1 interneurons respond briskly to footshock stimulation even when they are located in cortical areas not generally associated with somatic sensation (i.e., auditory and visual cortices). This raises the possibility that L1 interneurons have common roles (perhaps signaling nociception or arousal) that are independent of the modalities of the cortical areas in which they are embedded (i.e., visual, auditory, etc.). It will be important to determine whether this is true for L1 cells of mPFC and other cortical areas. Much of the footshock-induced L1 cell activity reported by Letzkus et al. depended on nicotinic acetylcholine receptors, but the fastest component appeared to be glutamatergic. Based on previous studies of nociceptive processing in thalamus (Monconduit et al., 1999; Monconduit and Villanueva, 2005), it seems that this glutamateric component could be mediated by one or more of the nonspecific/matrix TC pathways studied here, suggesting potentially shared routes of activation across multiple cortical areas.
Surprisingly, Letzkus et al. (2011) reported that L1 cell activation produced strong inhibition of inhibitory interneurons in the underlying cortical layers but no observable inhibition of pyramidal cells. This was consistent with a previous study using cholinergic agonists to activate L1 cells (Christophe et al., 2002) but strikingly different from our findings using paired cell recording. We found that L1 interneurons monosynaptically inhibited neighboring L2/L3 pyramidal cells with a high (∼50%) probability. Likewise, other studies using paired cell methods also reported L1 cell inhibition of pyramidal cells (Chu et al., 2003; Wozny and Williams, 2011). These data alone might lead to a reasonable hypothesis that cholinergic activation somehow negatively gates L1 cell output to pyramidal cells. However, a recent study involving optogenetic activation of cholinergic axons (Arroyo et al., 2012) refutes this simple possibility by demonstrating that excitation of L1 cells via selective activation of cholinergic axons can produce inhibition of L2/L3 pyramidal cells.
To be sure, it will be important to reconcile the differences in L1 cell effects observed in different investigations. Nevertheless, it is clear from our experiments that matrix TC activation strongly excites L1 interneurons and can trigger feedforward inhibition of pyramidal cells. Some of this feedforward inhibition is almost certainly produced by L1 synapses on the apical dendrites of the pyramidal cells, in which many L1 interneurons (especially LS/neurogliaform cells) project dense terminal arbors (Hestrin and Armstrong, 1996; Zhou and Hablitz, 1996b; Chu et al., 2003; Zhu and Zhu, 2004). Such inhibition could have a variety of effects, including providing a potent means of regulating dendritic action potentials (Kim et al., 1995; Murayama et al., 2009). Along these lines, Palmer et al. (2012) recently presented evidence that sensory-evoked activation of L1 interneurons causes GABAB inhibition in apical compartments of L5 pyramidal cells, suppressing their dendritic action potentials.
Matrix-evoked feedforward inhibition suggests that matrix TC input may have a suppressive function within cortex, at least in part. In addition, it is possible that inhibition of other interneurons could result in a disinhibitory (i.e., net excitatory) effect on pyramidal cells, as discussed previously (Christophe et al., 2002; Letzkus et al., 2011; Arroyo et al., 2012). We observed clear inhibition of L1 interneurons (Fig. 6A,C), and it remains to be seen how the matrix TC input affects interneurons of lower layers.
Of course, matrix TC axons themselves make glutamatergic synapses on apical dendrites of pyramidal cells. As with core TC pathways, the effect of this direct excitation is sometimes suppressed after a short latency by feedforward inhibition (Fig. 6D). An interesting possibility is that the temporal precision of the suppression may be enforced by specialized spatial relationships between the TC and inhibitory synapses (Kubota et al., 2007). In any case, feedforward inhibition can impose a narrow “window of opportunity” for excitation (Gabernet et al., 2005; Cruikshank et al., 2007). During trains of matrix TC stimulation, the direct excitatory responses in pyramidal cells tended to facilitate, whereas the disynaptic inhibition depressed. This suggests a dynamic shift in the net effect of the matrix TC input during repeated activation, from net inhibition to net excitation (Gabernet et al., 2005). It is possible that this progressive increase in excitatory/inhibitory balance might play a role in the production of the “recruiting response,” an evoked potential generated near the cortical surface that can be triggered by repeated stimulation of certain nonspecific thalamic nuclei and that has eluded a satisfying mechanistic explanation for >70 years (Dempsey and Morison, 1941; Jasper, 1960; Castro-Alamancos and Connors, 1997).
A particularly interesting property of matrix TC input is its short-term synaptic plasticity. As just discussed, monosynaptic TC responses of pyramidal cells underwent short-term facilitation (Fig. 3C), and this contrasts with most TC synapses characterized previously. With rare exceptions (Tan et al., 2008; Viaene et al., 2011), core sensory TC synapses undergo robust short-term depression (Gibson et al., 1999; Beierlein et al., 2003; Boudreau and Ferster, 2005; Rose and Metherate, 2005; Bruno and Sakmann, 2006), including when they are tested with optogenetic methods identical to those applied here (Fig. 7) (Cruikshank et al., 2010). Furthermore, although matrix TC synapses on L1 inhibitory interneurons generally showed some short-term depression, it was markedly weaker than the depression observed in interneurons of the somatosensory system (Fig. 7) (Cruikshank et al., 2010). The striking differences in short-term dynamics of core sensory and matrix TC synapses are directly illustrated in Figure 7. Altogether, these observations about synaptic dynamics indicate that matrix TC synapses are far more capable of sustained responses during repeated activation than are core sensory TC synapses. The distinctive dynamics may be specializations tailored to the divergent functions of the circuits in which they are embedded. For example, sensory TC systems may be optimized for processing transient signals, such as onsets and offsets of sensory stimuli (Zhu and Zhu, 2004; Rose and Metherate, 2005; Bruno and Sakmann, 2006), whereas matrix TC systems could transmit information with more sustained profiles, including the arousal state of the organism (Harris and Thiele, 2011). However, the capacity of matrix circuits for maintaining responsiveness during repetitive activation should not be confused with kinetic sluggishness. On the contrary, the individual EPSPs within trains of matrix TC stimulation were relatively fast as well as strong. The ability of matrix TC circuits to carry rapid signals over sustained periods to L1 of PFC may contribute to the celebrated propensity of this cortical area to process high-frequency (e.g., gamma) oscillations and persistent activity associated with attention and memory (Miller and Cohen, 2001; Lewis et al., 2005; Curtis and Lee, 2010; Sotres-Bayon and Quirk, 2010).
Figure 7.

Synaptic responses during repetitive TC activation are more sustained for matrix than core pathways. Short-term synaptic dynamics to 10 Hz optical stimulus trains are compared for matrix TC projections to L1 of mPFC (data from Fig. 3C) versus core sensory TC projections from the ventrobasal thalamus to L4–L6 of somatosensory cortex. The sensory TC data were obtained using the same optogenetic methods applied in the present study and are adapted from Cruikshank et al. (2010), their Figure 6c. A, Group synaptic dynamics for excitatory cortical cells in response to 10 Hz optical stimulation of TC arbors. Responses to matrix TC input (in L2/L3 pyramidal cells) typically exhibited short-term facilitation followed by weak depression, whereas responses to core sensory TC input (in L4 excitatory spiny stellate cells and L5/L6 pyramidal cells) depressed strongly. B, Same configuration as in A except postsynaptic cells are inhibitory interneurons. Responses to matrix TC input (in L1 interneurons) generally exhibited weak depression, whereas responses to core sensory TC input (in L4 and L5/L6 fast-spiking inhibitory interneurons) depressed strongly. Note that short-term synaptic depression is likely to be artificially enhanced and short-term facilitation blunted because of desensitization of ChR2 in the presynaptic axons/terminals (discussed by Cruikshank et al., 2010). Thus, matrix TC synapses are probably even more capable of maintaining sustained transmission than indicated by the dynamics plotted here.
Footnotes
This work was supported by National Institutes of Health Grants NS025983 and MH086400, National Science Foundation Grant EFRI-0937848, Department of Defense Grant DARPA-BAA-09-27, and the Brown Institute for Brain Science. We thank Karl Deisseroth and Charu Ramakrishnan for generous support with DNA and their time.
References
- Alonso JM, Swadlow HA. Thalamocortical specificity and the synthesis of sensory cortical receptive fields. J Neurophysiol. 2005;94:26–32. doi: 10.1152/jn.01281.2004. [DOI] [PubMed] [Google Scholar]
- Arroyo S, Bennett C, Aziz D, Brown SP, Hestrin S. Prolonged disynaptic inhibition in the cortex mediated by slow, non-alpha7 nicotinic excitation of a specific subset of cortical interneurons. J Neurosci. 2012;32:3859–3864. doi: 10.1523/JNEUROSCI.0115-12.2012. [DOI] [PMC free article] [PubMed] [Google Scholar]
- Beierlein M, Gibson JR, Connors BW. Two dynamically distinct inhibitory networks in layer 4 of the neocortex. J Neurophysiol. 2003;90:2987–3000. doi: 10.1152/jn.00283.2003. [DOI] [PubMed] [Google Scholar]
- Boudreau CE, Ferster D. Short-term depression in thalamocortical synapses of cat primary visual cortex. J Neurosci. 2005;25:7179–7190. doi: 10.1523/JNEUROSCI.1445-05.2005. [DOI] [PMC free article] [PubMed] [Google Scholar]
- Bruno RM, Sakmann B. Cortex is driven by weak but synchronously active thalamocortical synapses. Science. 2006;312:1622–1627. doi: 10.1126/science.1124593. [DOI] [PubMed] [Google Scholar]
- Castro-Alamancos MA, Connors BW. Thalamocortical synapses. Prog Neurobiol. 1997;51:581–606. doi: 10.1016/s0301-0082(97)00002-6. [DOI] [PubMed] [Google Scholar]
- Christophe E, Roebuck A, Staiger JF, Lavery DJ, Charpak S, Audinat E. Two types of nicotinic receptors mediate an excitation of neocortical layer I interneurons. J Neurophysiol. 2002;88:1318–1327. doi: 10.1152/jn.2002.88.3.1318. [DOI] [PubMed] [Google Scholar]
- Chu Z, Galarreta M, Hestrin S. Synaptic interactions of late-spiking neocortical neurons in layer 1. J Neurosci. 2003;23:96–102. doi: 10.1523/JNEUROSCI.23-01-00096.2003. [DOI] [PMC free article] [PubMed] [Google Scholar]
- Cruikshank SJ, Lewis TJ, Connors BW. Synaptic basis for intense thalamocortical activation of feedforward inhibitory cells in neocortex. Nat Neurosci. 2007;10:462–468. doi: 10.1038/nn1861. [DOI] [PubMed] [Google Scholar]
- Cruikshank SJ, Urabe H, Nurmikko AV, Connors BW. Pathway-specific feedforward circuits between thalamus and neocortex revealed by selective optical stimulation of axons. Neuron. 2010;65:230–245. doi: 10.1016/j.neuron.2009.12.025. [DOI] [PMC free article] [PubMed] [Google Scholar]
- Curtis CE, Lee D. Beyond working memory: the role of persistent activity in decision making. Trends Cogn Sci. 2010;14:216–222. doi: 10.1016/j.tics.2010.03.006. [DOI] [PMC free article] [PubMed] [Google Scholar]
- Dempsey EW, Morison RS. The production of rhythmically recurrent cortical potentials after localized thalamic stimulation. Am J Physiol. 1941;135:293–300. [Google Scholar]
- Gabernet L, Jadhav SP, Feldman DE, Carandini M, Scanziani M. Somatosensory integration controlled by dynamic thalamocortical feed-forward inhibition. Neuron. 2005;48:315–327. doi: 10.1016/j.neuron.2005.09.022. [DOI] [PubMed] [Google Scholar]
- Gibson JR, Beierlein M, Connors BW. Two networks of electrically coupled inhibitory neurons in neocortex. Nature. 1999;402:75–79. doi: 10.1038/47035. [DOI] [PubMed] [Google Scholar]
- Harris KD, Thiele A. Cortical state and attention. Nat Rev Neurosci. 2011;12:509–523. doi: 10.1038/nrn3084. [DOI] [PMC free article] [PubMed] [Google Scholar]
- Herkenham M. New perspectives on the organization and evolution of nonspecific thalamocortical projections. In: Jones EG, Peters A, editors. Cerebral cortex. New York: Plenum; 1986. pp. 403–445. [Google Scholar]
- Hestrin S, Armstrong WE. Morphology and physiology of cortical neurons in layer I. J Neurosci. 1996;16:5290–5300. doi: 10.1523/JNEUROSCI.16-17-05290.1996. [DOI] [PMC free article] [PubMed] [Google Scholar]
- Jasper HH. Unspecific thalamocortical relations. In: Field J, Magoun HW, Hall VE, editors. Handbook of physiology. Washington, DC: American Physiological Society; 1960. pp. 1307–1321. [Google Scholar]
- Jones EG. The thalamic matrix and thalamocortical synchrony. Trends Neurosci. 2001;24:595–601. doi: 10.1016/s0166-2236(00)01922-6. [DOI] [PubMed] [Google Scholar]
- Jones EG. The thalamus. Ed 2. Cambridge, UK: Cambridge UP; 2007. Part IV. Individual thalamic nuclei; pp. 705–1342. [Google Scholar]
- Kim HG, Beierlein M, Connors BW. Inhibitory control of excitable dendrites in neocortex. J Neurophysiol. 1995;74:1810–1814. doi: 10.1152/jn.1995.74.4.1810. [DOI] [PubMed] [Google Scholar]
- Krettek JE, Price JL. The cortical projections of the mediodorsal nucleus and adjacent thalamic nuclei in the rat. J Comp Neurol. 1977;171:157–191. doi: 10.1002/cne.901710204. [DOI] [PubMed] [Google Scholar]
- Kubota Y, Hatada S, Kondo S, Karube F, Kawaguchi Y. Neocortical inhibitory terminals innervate dendritic spines targeted by thalamocortical afferents. J Neurosci. 2007;27:1139–1150. doi: 10.1523/JNEUROSCI.3846-06.2007. [DOI] [PMC free article] [PubMed] [Google Scholar]
- Lee CM, Chang WC, Chang KB, Shyu BC. Synaptic organization and input-specific short-term plasticity in anterior cingulate cortical neurons with intact thalamic inputs. Eur J Neurosci. 2007;25:2847–2861. doi: 10.1111/j.1460-9568.2007.05485.x. [DOI] [PubMed] [Google Scholar]
- Lee S, Hjerling-Leffler J, Zagha E, Fishell G, Rudy B. The largest group of superficial neocortical GABAergic interneurons expresses ionotropic serotonin receptors. J Neurosci. 2010;30:16796–16808. doi: 10.1523/JNEUROSCI.1869-10.2010. [DOI] [PMC free article] [PubMed] [Google Scholar]
- Lehman JF, Greenberg BD, McIntyre CC, Rasmussen SA, Haber SN. Rules ventral prefrontal cortical axons use to reach their targets: implications for diffusion tensor imaging tractography and deep brain stimulation for psychiatric illness. J Neurosci. 2011;31:10392–10402. doi: 10.1523/JNEUROSCI.0595-11.2011. [DOI] [PMC free article] [PubMed] [Google Scholar]
- Letzkus JJ, Wolff SB, Meyer EM, Tovote P, Courtin J, Herry C, Lüthi A. A disinhibitory microcircuit for associative fear learning in the auditory cortex. Nature. 2011;480:331–335. doi: 10.1038/nature10674. [DOI] [PubMed] [Google Scholar]
- Lewis DA, Hashimoto T, Volk DW. Cortical inhibitory neurons and schizophrenia. Nat Rev Neurosci. 2005;6:312–324. doi: 10.1038/nrn1648. [DOI] [PubMed] [Google Scholar]
- Marín O. Interneuron dysfunction in psychiatric disorders. Nat Rev Neurosci. 2012;13:107–120. doi: 10.1038/nrn3155. [DOI] [PubMed] [Google Scholar]
- Miller EK, Cohen JD. An integrative theory of prefrontal cortex function. Annu Rev Neurosci. 2001;24:167–202. doi: 10.1146/annurev.neuro.24.1.167. [DOI] [PubMed] [Google Scholar]
- Miró-Bernié N, Ichinohe N, Pérez-Clausell J, Rockland KS. Zinc-rich transient vertical modules in the rat retrosplenial cortex during postnatal development. Neuroscience. 2006;138:523–535. doi: 10.1016/j.neuroscience.2005.11.049. [DOI] [PubMed] [Google Scholar]
- Mitani A, Shimokouchi M. Neuronal connections in the primary auditory cortex: an electrophysiological study in the cat. J Comp Neurol. 1985;235:417–429. doi: 10.1002/cne.902350402. [DOI] [PubMed] [Google Scholar]
- Monconduit L, Villanueva L. The lateral ventromedial thalamic nucleus spreads nociceptive signals from the whole body surface to layer I of the frontal cortex. Eur J Neurosci. 2005;21:3395–3402. doi: 10.1111/j.1460-9568.2005.04160.x. [DOI] [PubMed] [Google Scholar]
- Monconduit L, Bourgeais L, Bernard JF, Le Bars D, Villanueva L. Ventromedial thalamic neurons convey nociceptive signals from the whole body surface to the dorsolateral neocortex. J Neurosci. 1999;19:9063–9072. doi: 10.1523/JNEUROSCI.19-20-09063.1999. [DOI] [PMC free article] [PubMed] [Google Scholar]
- Morison RS, Dempsey EW. A study of thalamo-cortical relations. Am J Physiol. 1941;135:281–292. [Google Scholar]
- Moruzzi G, Magoun HW. Brain stem reticular formation and activation of the EEG. Electroencephalogr Clin Neurophysiol. 1949;1:455–473. [PubMed] [Google Scholar]
- Murayama M, Pérez-Garci E, Nevian T, Bock T, Senn W, Larkum ME. Dendritic encoding of sensory stimuli controlled by deep cortical interneurons. Nature. 2009;457:1137–1141. doi: 10.1038/nature07663. [DOI] [PubMed] [Google Scholar]
- Palmer LM, Schulz JM, Murphy SC, Ledergerber D, Murayama M, Larkum ME. The cellular basis of GABA(B)-mediated interhemispheric inhibition. Science. 2012;335:989–993. doi: 10.1126/science.1217276. [DOI] [PubMed] [Google Scholar]
- Paxinos G, Franklin KBJ. The mouse brain in stereotaxic coordinates. Ed 2. San Diego: Academic; 2001. [Google Scholar]
- Petreanu L, Mao T, Sternson SM, Svoboda K. The subcellular organization of neocortical excitatory connections. Nature. 2009;457:1142–1145. doi: 10.1038/nature07709. [DOI] [PMC free article] [PubMed] [Google Scholar]
- Rose HJ, Metherate R. Auditory thalamocortical transmission is reliable and temporally precise. J Neurophysiol. 2005;94:2019–2030. doi: 10.1152/jn.00860.2004. [DOI] [PubMed] [Google Scholar]
- Rubio-Garrido P, Pérez-de-Manzo F, Porrero C, Galazo MJ, Clasc à F. Thalamic input to distal apical dendrites in neocortical layer 1 is massive and highly convergent. Cereb Cortex. 2009;19:2380–2395. doi: 10.1093/cercor/bhn259. [DOI] [PubMed] [Google Scholar]
- Rudy B, Fishell G, Lee S, Hjerling-Leffler J. Three groups of interneurons account for nearly 100% of neocortical GABAergic neurons. Dev Neurobiol. 2011;71:45–61. doi: 10.1002/dneu.20853. [DOI] [PMC free article] [PubMed] [Google Scholar]
- Ruzicka WB, Zhubi A, Veldic M, Grayson DR, Costa E, Guidotti A. Selective epigenetic alteration of layer I GABAergic neurons isolated from prefrontal cortex of schizophrenia patients using laser-assisted microdissection. Mol Psychiatry. 2007;12:385–397. doi: 10.1038/sj.mp.4001954. [DOI] [PubMed] [Google Scholar]
- Schiff ND. Central thalamic contributions to arousal regulation and neurological disorders of consciousness. Ann N Y Acad Sci. 2008;1129:105–118. doi: 10.1196/annals.1417.029. [DOI] [PubMed] [Google Scholar]
- Shah SA, Schiff ND. Central thalamic deep brain stimulation for cognitive neuromodulation: a review of proposed mechanisms and investigational studies. Eur J Neurosci. 2010;32:1135–1144. doi: 10.1111/j.1460-9568.2010.07420.x. [DOI] [PMC free article] [PubMed] [Google Scholar]
- Smith PH, Manning KA, Uhlrich DJ. Evaluation of inputs to rat primary auditory cortex from the suprageniculate nucleus and extrastriate visual cortex. J Comp Neurol. 2010;518:3679–3700. doi: 10.1002/cne.22411. [DOI] [PMC free article] [PubMed] [Google Scholar]
- Sotres-Bayon F, Quirk GJ. Prefrontal control of fear: more than just extinction. Curr Opin Neurobiol. 2010;20:231–235. doi: 10.1016/j.conb.2010.02.005. [DOI] [PMC free article] [PubMed] [Google Scholar]
- Tan Z, Hu H, Huang ZJ, Agmon A. Robust but delayed thalamocortical activation of dendritic-targeting inhibitory interneurons. Proc Natl Acad Sci U S A. 2008;105:2187–2192. doi: 10.1073/pnas.0710628105. [DOI] [PMC free article] [PubMed] [Google Scholar]
- Uylings HB, Groenewegen HJ, Kolb B. Do rats have a prefrontal cortex? Behav Brain Res. 2003;146:3–17. doi: 10.1016/j.bbr.2003.09.028. [DOI] [PubMed] [Google Scholar]
- Van der Werf YD, Witter MP, Groenewegen HJ. The intralaminar and midline nuclei of the thalamus. Anatomical and functional evidence for participation in processes of arousal and awareness. Brain Res Brain Res Rev. 2002;39:107–140. doi: 10.1016/s0165-0173(02)00181-9. [DOI] [PubMed] [Google Scholar]
- Vertes RP. Interactions among the medial prefrontal cortex, hippocampus and midline thalamus in emotional and cognitive processing in the rat. Neuroscience. 2006;142:1–20. doi: 10.1016/j.neuroscience.2006.06.027. [DOI] [PubMed] [Google Scholar]
- Viaene AN, Petrof I, Sherman SM. Synaptic properties of thalamic input to layers 2/3 and 4 of primary somatosensory and auditory cortices. J Neurophysiol. 2011;105:279–292. doi: 10.1152/jn.00747.2010. [DOI] [PMC free article] [PubMed] [Google Scholar]
- Vogt AB. The role of layer 1 in cortical function. In: Jones EG, Peters A, editors. Cerebral cortex. New York: Plenum; 1991. pp. 49–80. [Google Scholar]
- Vogt BA, Rosene DL, Peters A. Synaptic termination of thalamic and callosal afferents in cingulate cortex of the rat. J Comp Neurol. 1981;201:265–283. doi: 10.1002/cne.902010210. [DOI] [PubMed] [Google Scholar]
- Wozny C, Williams SR. Specificity of synaptic connectivity between layer 1 inhibitory interneurons and layer 2/3 pyramidal neurons in the rat neocortex. Cereb Cortex. 2011;21:1818–1826. doi: 10.1093/cercor/bhq257. [DOI] [PMC free article] [PubMed] [Google Scholar]
- Yizhar O, Fenno LE, Davidson TJ, Mogri M, Deisseroth K. Optogenetics in neural systems. Neuron. 2011a;71:9–34. doi: 10.1016/j.neuron.2011.06.004. [DOI] [PubMed] [Google Scholar]
- Yizhar O, Fenno LE, Prigge M, Schneider F, Davidson TJ, O'Shea DJ, Sohal VS, Goshen I, Finkelstein J, Paz JT, Stehfest K, Fudim R, Ramakrishnan C, Huguenard JR, Hegemann P, Deisseroth K. Neocortical excitation/inhibition balance in information processing and social dysfunction. Nature. 2011b;477:171–178. doi: 10.1038/nature10360. [DOI] [PMC free article] [PubMed] [Google Scholar]
- Zhou FM, Hablitz JJ. Layer I neurons of rat neocortex. I. Action potential and repetitive firing properties. J Neurophysiol. 1996a;76:651–667. doi: 10.1152/jn.1996.76.2.651. [DOI] [PubMed] [Google Scholar]
- Zhou FM, Hablitz JJ. Morphological properties of intracellularly labeled layer I neurons in rat neocortex. J Comp Neurol. 1996b;376:198–213. doi: 10.1002/(SICI)1096-9861(19961209)376:2<198::AID-CNE3>3.0.CO;2-Z. [DOI] [PubMed] [Google Scholar]
- Zhu Y, Zhu JJ. Rapid arrival and integration of ascending sensory information in layer 1 nonpyramidal neurons and tuft dendrites of layer 5 pyramidal neurons of the neocortex. J Neurosci. 2004;24:1272–1279. doi: 10.1523/JNEUROSCI.4805-03.2004. [DOI] [PMC free article] [PubMed] [Google Scholar]