

SUMMARY
Despite the increasing speculation that oxidative stress and abnormal energy metabolism may play a role in Autism Spectrum Disorders (ASD), and the observation that patients with mitochondrial defects have symptoms consistent with ASD, there are no comprehensive published studies examining the role of mitochondrial variation in autism. Therefore, we have sought to comprehensively examine the role of mitochondrial DNA (mtDNA) variation with regard to ASD risk, employing a multi-phase approach.
In phase 1 of our experiment, we examined 132 mtDNA single-nucleotide polymorphisms (SNPs) genotyped as part of our genome-wide association studies of ASD. In phase 2 we genotyped the major European mitochondrial haplogroup-defining variants within an expanded set of autism probands and controls. Finally in phase 3, we resequenced the entire mtDNA in a subset of our Caucasian samples (~400 proband-father pairs). In each phase we tested whether mitochondrial variation showed evidence of association to ASD. Despite a thorough interrogation of mtDNA variation, we found no evidence to suggest a major role for mtDNA variation in ASD susceptibility. Accordingly, while there may be attractive biological hints suggesting the role of mitochondria in ASD our data indicate that mtDNA variation is not a major contributing factor to the development of ASD.
Keywords: mitochondrial DNA, autism, autism spectrum disorders, association studies, genetic
INTRODUCTION
Autism Spectrum Disorders (ASDs) are neurobehavioral disorders characterized by deficits in social abilities, problems with language and communication, and the presence of patterns of repetitive behaviors, restricted interests, and resistance to change. ASD has an estimated population prevalence of one in every 1000 individuals within the general population with a male:female ratio of 4:1 (Fombonne, 2002; Fombonne, 2009). Autism, along with Asperger’s syndrome, Rett syndrome, and other pervasive developmental disorders, are more generally classified as autism spectrum disorders (ASDs) and may affect as many as one in 88 children in the United States (Autism and Developmental Disabilities Monitoring Network Surveillance Year 2008 Principal Investigators, 2012). Little is known about the etiology of ASD; however overwhelming evidence from numerous studies has indicated that idiopathic autism has a complex genetic etiology. Twin and sibling studies overwhelmingly suggest a strong genetic component and high heritability for ASD. Studies show a concordance rate of ~60% for classic autism and up to ~90% for ASD among monozygotic (MZ) twins and <10% among dizygotic (DZ) twins (Folstein & Piven 1991; Ritvo et al., 1985; Bailey et al., 1995). Numerous linkage and association studies, including genome-wide association studies (GWAS), and candidate gene studies have failed to characterize an appreciable amount of the genetic variation believed to be involved in this devastating disease. These approaches have identified a multitude of possible locations and genes for susceptibility, but few consensus regions or genome-wide significant associations have resulted (Anney et al., 2010; Autism Genome Project Consortium et al., 2007; Ma et al., 2009; Wang et al., 2009; Weiss et al., 2009). Recently, Copy Number Variants have been revealed to explain some of the variation in ASD, strengthening the hypothesis that multiple sources contribute to ASD etiology (Salyakina et al., 2011; Griswold et al., 2012)
The mitochondrial genome is small and circular (16,569 base pairs), possesses a distinct code from the nuclear genome (Wallace et al., 1999) and has a unique maternal inheritance pattern. Multiple copies of the mitochondrial DNA (mtDNA) are contained in each mitochondrion; some differ in sequence, this phenomenon is called ‘heteroplasmy’. It encodes 13 protein subunits of the mitochondrial electron transport chain and a distinct set of rRNAs and tRNAs all of which are critical for life-sustaining oxidative phosphorylation and energy generation (Wallace, 1994). Relative to the nuclear genome, the mitochondrial genome has been understudied in the search for common genetic variation associated to human disease, despite the fact that mitochondria play a vital role in cellular energy production (Wallace et al., 1999; Papa, 1996; Wallace, 1997).
Variation in mitochondrial DNA has been examined in numerous neurological, age-related common genetic diseases (Howell et al., 2005; Raule et al., 2007; Canter et al., 2008; van der Walt et al., 2003; Rollins et al., 2009). Increased production of reactive oxygen species (ROS) due to mitochondrial respiratory activity and the resultant damage to both mtDNA and nuclear DNA have long been implicated in disease (Wallace et al., 1999; Kang & Hamasaki 2003; Scheffler, 2001; Feig et al., 1994; de Zwart et al., 1999; Penta et al., 2001). There has been increasing speculation that oxidative stress and abnormal energy metabolism may play a role in ASD, consistent with some level of mitochondrial dysfunction (Lombard, 1998; Chugani et al., 1999; Chauhan & Chauhan 2006; Clark-Taylor & Clark-Taylor 2004; Oliveira et al., 2005; Rossignol et al., 2007), although this remains somewhat controversial (Lerman-Sagie et al., 2004). In addition, numerous clinical reports have described patients with mitochondrial disorders or mutations who have symptoms consistent with ASD (Oliveira et al., 2005; Poling et al., 2006; Fillano et al., 2002; Tsao & Mendell 2007; Filipek et al., 2003; Graf et al., 2000; Pons et al., 2004). Further, mitochondrial inheritance is consistent with the observed increased neuropsychological abnormalities in the mothers of ASD children (Baron-Cohen et al., 1997; Bishop et al., 2004; Constantino & Todd 2005). To date there has been one investigation of the mitochondrial haplogroups in ASD (Kent et al., 2008). The small sample size (n=162) generated borderline significant results, but the study was underpowered to detect anything but large main effects with odds ratios >2.0.
Additional evidence for the role of mitochondria in autism stems from data regarding the SLC25A12 gene, a nuclear encoded protein for the mitochondrial aspartate/glutamate transporter, ARALAR (De Zwart et al., 1999; Satrustegui et al., 2007)). Mice with a homozygous deletion of the Aralar gene develop severe birth defects soon after birth and die approximately 20 days postnatal. In addition, aralar deficiency causes a large drop in aspartate and its derivative n-acetylaspartate (NAA) in the brain and in primary neuronal cultures. Interestingly, NAA is commonly used in 1H-NMR spectroscopy as a potential diagnostic marker for neuronal function or loss (Pan & Takahashi 2005; Tsai & Coyle 1995), and is reduced in certain brain regions of autistic patients (Otsuka et al., 1999). In humans, two polymorphisms within SLC25A12 were associated with an increased risk of autism in a dataset of 411 families (Ramoz et al., 2004). A positive replication was found in a relatively homogeneous dataset of Irish autism families (Segurado et al., 2005), but negative reports in more heterogeneous datasets (Rabionet et al., 2006; Blasi et al., 2006; Correia et al., 2006) have also been published. There are several possible explanations for the inconsistency of results, including underpowered datasets and genetic heterogeneity, which could arise from having differing mitochondrial haplogroup backgrounds that may affect SLC25A12 function.
In summary, the potential role of mitochondrial variation in ASDs remains intriguing and warrants thorough investigation. While the nuclear genome has been the focus of countless studies over the past couple of decades in search for autism susceptibility genes, our study marks the largest examination of the mitochondrial genome in ASD, and the first report of mtDNA resequencing in ASD.
MATERIALS AND METHODS
Patient Ascertainment and Description
Individual patient samples included in this study (n=1298) (Table 1) consist of samples ascertained at the John P. Hussman Institute for Human Genomics (HIHG) at the University of Miami, Miller School of Medicine (Miami, Florida) (n=668), the University of South Carolina (Columbia, South Carolina) (n=317), the Center for Human Genetics Research at the Vanderbilt University (Nashville, Tennessee) (n=108), and samples obtained from the Autism Genetic Resource Exchange (AGRE) (n=205) (Autism Genetics Resource Exchange, 2008). Families were enrolled through a multi-site genetics study of autism and recruited via family support groups, advertisements, and clinical and educational settings. All participants were ascertained and sampled according to approved Institutional Review Board (IRB) protocols. Participants with ASD met the following minimum criteria for inclusion: (1) chronological age between 3 and 21 years of age; (2) presumptive clinical diagnosis of ASD; (3) expert clinical determination of ASD diagnosis using DSM-IV criteria supported by the Autism Diagnostic Interview (ADI-R) (Rutter et al., 2003b). Diagnostic determination was based on review by clinical psychologists with extensive experience in autism and related disorders. In those instances where an ADI-R was not available, a best-estimate diagnosis was assigned using all available clinical information including clinician summaries, caregiver report, and medical records; (4) minimal developmental level of 18 months as determined by the Vineland Adaptive Behavior Scale (VABS) (Sparrow et al., 1984)or the VABS-II (Sparrow et al., 2005) or an IQ equivalent > 35. These minimal developmental levels assure that ADI-R results are valid and reduce the likelihood of including individuals with severe mental retardation. We excluded participants with severe sensory problems (e.g., visual impairment or hearing loss), significant motor impairments (e.g., failure to sit by 12 months or walk by 24 months), or identified metabolic, genetic, or progressive neurological disorders. Family history and pedigree information (including any known health and psychiatric history of family members) was collected in a standard semi-structured interview with a biological parent of the proband, frequently the mother. Phenotypic data regarding the family also was collected through a review of available medical and psychiatric records of the proband and/or affected sibling, as well as review of available photographs of the proband, siblings and parents in the patient charts. Confounding by race and ethnicity was addressed using both a stratified analysis and a principal components analysis (PCA) in phase 1, haplogroup definition in phase 2, and a homogeneous sample of self-reported Caucasian non-Hispanic individuals in phase 3.
Table 1.
Race/Ethnicity Dataset Descriptions
| Phase (Platform) | *Overall Unique | Phase 1 (Illumina) | Phase 2 (Sequenom) | Phase 3 (Affymetrix) | |||||
|---|---|---|---|---|---|---|---|---|---|
| Race | Ethnicity | Cases | Controls | Cases | Controls | Cases | Controls | Cases | Controls |
| White | Non-Hispanic | 885 | 1524 | 596 | 1212 | 551 | 1391 | 379 | 372 |
| White | Hispanic | 78 | 163 | 63 | 163 | 29 | 22 | 0 | 0 |
| White | Unknown | 145 | 708 | 167 | 182 | 165 | 172 | 0 | 0 |
| Black | Non-Hispanic | 41 | 139 | 40 | 143 | 6 | 3 | 0 | 0 |
| Black | Unknown | 32 | 21 | 32 | 21 | 2 | 1 | 0 | 0 |
| **Other/Unknown | 117 | 91 | 66 | 42 | 65 | 52 | 0 | 0 | |
| TOTAL | 1298 | 2646 | 964 | 1763 | 818 | 1641 | 379 | 372 | |
As different phases of this project contain overlapping samples, this represents the non-overlapping unique sample set.
Contains individuals of self-reported race and ethnicity of American Indian, Asian, and other/unknown.
Control Ascertainment and Description
Control samples utilized in this study (n=2,646) were obtained from multiple sources (Table 1). Healthy children (n=513) between the ages of 4 and 21 years were recruited by the HIHG. Participants were screened for eligibility using a series of preliminary questions to determine whether the child, his or her parent, or sibling has been diagnosed a developmental, behavioral, neurological or other disability or condition. If none of those conditions were present, parents of minor children or participants reviewed and signed the informed consent and completed the Social Communication Questionnaire (Rutter et al., 2003a) to screen for potential ASDs. These control participants provided a saliva sample for these and other ongoing genetic studies. A second set of control individuals (n=327) were part of ongoing studies of preterm birth. These samples were collected via the Centennial Medical Center in Nashville from the cord blood of term pregnancies (> 37 weeks gestation). Mothers between the ages of 18 and 40 were recruited for this collection, with cord blood being collected from live singleton births. Our third set of control individuals (n=582) were from the National Institute of Mental Health (NIMH) Human Genetics Initiative and consist of non-Hispanic European-ancestry DNA samples made available through this resource. These samples and their corresponding data have been used by multiple investigators through permission and collaboration with the Center for Collaborative Studies of Mental Disorders resource (https://www.nimhgenetics.org). Finally, given that mtDNA is maternally inherited, we included the unaffected fathers (n=1,224) from the ascertained autism families (n=614 HIHG; n=290 South Carolina; n=106 Vanderbilt; n=214 AGRE) as additional controls for these experiments.
Phase 1 Dataset (Illumina Genotyping)
Description and Genotyping
A total of 2727 samples (964 cases, 1763 controls) were included in the phase 1 experiment (Table 1; Fig. 1). Cases were selected from among our ASD families, with a single case selected (probands were chosen preferentially) from each nuclear family. Additional cases were chosen from 76 extended multiplex families provided they did not share mitochondrial lineage (i.e. each case chosen had a unique maternal founder). Control data came from the fathers of probands (n=923) and the pediatric controls from the HIHG and the preterm birth study (n=840).
Figure 1.
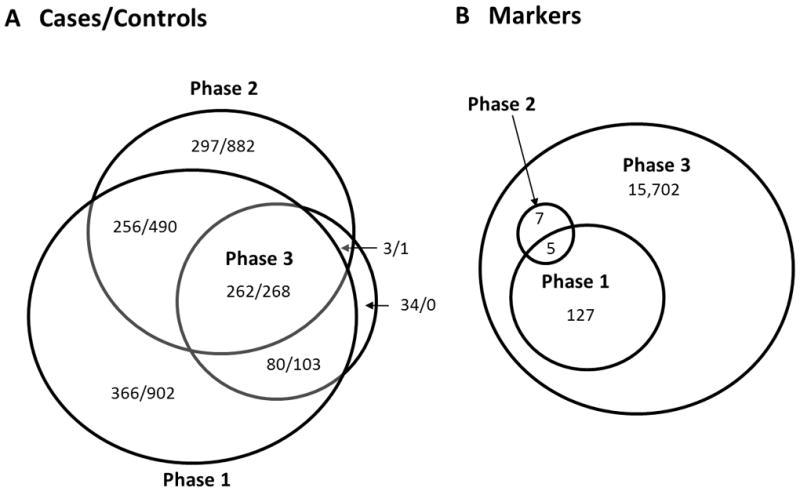
A graphical representation of the three phases of this study for a) samples and b) markers.
Analysis
Individual sample data was selected for cases and controls following a comprehensive quality control (QC) analysis of these samples using the autosomal markers of the GWAS panel as previously reported (Ma et al., 2009; Wang et al., 2009). Of the total 163 mtDNA SNPs genotyped across both the Illumina 1M and Illumina 1M Duo BeadChip arrays, we examined the 132 common to both platforms. These SNPs were examined for call rate (requiring >95% for inclusion). Using the PLINK analysis software package, we next examined the call rate of samples and dropped any sample with a call rate below 95% in this set of SNPs (Purcell et al., 2007). We further checked both samples and SNPs by examining inconsistencies between mother and child genotypes at these 132 mtDNA SNPs with the use of the PLATO software package (Grady et al., 2010). This resulted in the removal of one case sample. Due to the insensitivity of the assay to detect heteroplasmy we set all heterozygous calls to missing.
To test for association while accounting for possible confounding by population stratification, we performed a stratified analysis, using the Cochran-Mantel-Haenszel (CMH) test, as implemented in PLINK, with genetically defined clusters generated with the software program CLUSTER (Table S1, Fig. S1). CLUSTER was developed in-house as an alternative to the STRUCTURE software application (Pritchard et al., 2000). It uses Ward’s clustering algorithm to assign individuals to populations on the basis of information from multiple loci. In addition, to address the issue of population stratification on a finer scale, we conducted Eigenstrat analysis using the 132 mtDNA SNPs (Biffi et al., 2010; Price et al., 2006). This PCA was used to infer continuous axes of genetic variation which control for ancestry in the place of the categorical self-reported ethnicity variable. Eigenstrat analysis resulted in the exclusion of 49 samples with eigenvector values that were ≥ 6 standard deviations from the mean of principal components 1, 2 and 3 (mtPCs). The mitochondrial genomic inflation factor (mtGIF) was used as a measure of deviation from the median of the test statistic distribution. Association analysis was performed using logistic regression as implemented in PLINK, with mtPC1, mtPC2 and mtPC3 used as covariates in the analysis (Table 2). The mtGIF=1.0 with the inclusion of these principal components. We did not attempt to incorporate autosomal data to further correct for mitochondrial population substructure as data suggests it results in little improvement (Biffi et al., 2010). Furthermore, we conducted permutation testing to assess the significance of our results, using PLINK (--mperm 10000 --model-trend options) on the self-reported Caucasian non-Hispanic subset of the phase 1 dataset.
Table 2.
Nominally significant (p<0.05) logistic regression results of mtDNA SNPs analyzed in phase 1
| SNP | Basepair Position | Minor Allele | MAF in controls | MAF in mtDB | P-value | Amino Acid Change | Region |
|---|---|---|---|---|---|---|---|
| MitoG228A | 228 | A | 0.052 | 0.032 | 0.03 | na | D-loop |
| MitoG7522A | 7521 | A | 0.087 | 0.060 | 0.03 | na | t-RNA (Asp) |
| MitoT9900C | 9899 | C | 0.020 | 0.010 | 0.04 | syn | COX 3 |
| MitoG10590A | 10589 | A | 0.013 | 0.017 | 0.02 | syn | ND4L |
| MitoG11378A | 11377 | A | 0.011 | 0.010 | 0.03 | syn | ND4 |
| MitoT13966C | 13965 | C | 0.016 | 0.006 | 0.04 | syn | ND5 |
Phase 2 Dataset (Sequenom Genotyping)
Description and Genotyping
A total of 2459 samples (818 cases, 1641 controls) were included in the phase 2 experiment (Table 1; Fig. 1), only five of which overlap with phase 1. Cases were selected as in phase 1 from among our ASD families (n=613), with additional cases from the AGRE resource (n=205). Control data for this experiment came from the mitochondrially unrelated fathers of probands (n=806), from the cord blood of the term pregnancies (n=253), and from the NIMH Human Genetics Initiative (n=582). In phase 2 of our experiment, we used both the Sequenom MassARRAY iPLEX and TaqMan genotyping platforms to genotype the major European mitochondrial haplogroup defining variants (Table S2). A total of 12 SNPs were genotyped in this effort for the main purpose of defining these haplogroups within our dataset.
Analysis
Cases and controls were chosen for analysis following a QC approach similar to phase 1. As we genotyped our entire ASD dataset on the 12 selected SNPs, our QC analysis in this phase benefited from mother-child as well as cross-platform genotype concordance. Due to the limited number of markers and their importance in haplogroup assignment the sample call rate threshold was set to 100%. After sample and marker checks, any remaining instances of erroneous heterozygous genotype calls or platform discordant genotypes were set to missing for our analysis. Each sample was assigned to a specific haplogroup (Table 3) using information from the 12 genotyped SNPs (Table S2). Logistic regression analysis was conducted using SAS for both haplogroup and single marker tests of association (Table 4).
Table 3.
Phase 2 Haplogroup Results
| Haplogroup | Counts | Frequency | P-value | OR | L95 | U95 | ||
|---|---|---|---|---|---|---|---|---|
| Cases | Controls | Cases | Controls | |||||
| H | 358 | 762 | 0.44 | 0.46 | 0.21 | 0.90 | 0.76 | 1.06 |
| I | 21 | 36 | 0.03 | 0.02 | 0.56 | 1.18 | 0.68 | 2.03 |
| J | 83 | 146 | 0.10 | 0.09 | 0.32 | 1.16 | 0.87 | 1.54 |
| K | 64 | 134 | 0.08 | 0.08 | 0.77 | 0.96 | 0.70 | 1.30 |
| T | 82 | 173 | 0.10 | 0.11 | 0.69 | 0.95 | 0.72 | 1.25 |
| U | 147 | 272 | 0.18 | 0.17 | 0.39 | 1.10 | 0.88 | 1.38 |
| V | 32 | 56 | 0.04 | 0.03 | 0.53 | 1.15 | 0.74 | 1.79 |
| W | 18 | 36 | 0.02 | 0.02 | 0.99 | 1.00 | 0.57 | 1.78 |
| X | 13 | 26 | 0.02 | 0.02 | 0.99 | 1.00 | 0.51 | 1.96 |
| Total | 818 | 1641 | 1.00 | 1.00 | - | - | - | - |
OR, odds ratio; L95/U95, lower and upper bounds of the 95% confidence interval for the OR
Table 4.
Logistic regression results for haplogroup defining mtDNA SNPs analysed in Phase 2
| SNP | Basepair position | Minor Allele | **MAF | P-value | OR | L95 | U95 |
|---|---|---|---|---|---|---|---|
| *MitoA1719G | 1719 | G | 0.04 | 0.44 | 1.18 | 0.78 | 1.79 |
| MitoC4216T | 4216 | T | 0.17 | 0.58 | 1.07 | 0.85 | 1.34 |
| MitoA4580G | 4580 | G | 0.04 | 0.79 | 0.94 | 0.58 | 1.52 |
| *MitoG4917A | 4917 | A | 0.09 | 0.34 | 0.86 | 0.63 | 1.17 |
| MitoC7028T | 7028 | T | 0.39 | 0.30 | 0.83 | 0.58 | 1.18 |
| MitoA8251G | 8251 | G | 0.04 | 0.73 | 1.08 | 0.71 | 1.63 |
| MitoA9055G | 9055 | G | 0.09 | 0.93 | 0.99 | 0.73 | 1.33 |
| *MitoG10398A | 10398 | A | 0.26 | 0.31 | 1.12 | 0.90 | 1.41 |
| *MitoG12308A | 12308 | A | 0.22 | 0.99 | 1.00 | 0.78 | 1.27 |
| MitoA13368G | 13368 | G | 0.1 | 0.66 | 0.94 | 0.69 | 1.26 |
| MitoA13708G | 13708 | G | 0.09 | 0.09 | 1.28 | 0.97 | 1.71 |
| *MitoA16391G | 16391 | G | 0.02 | 0.68 | 1.13 | 0.63 | 2.03 |
These 5 SNPs were also genotyped in Phase 1
Minor allele frequency in controls
OR, odds ratio; L95/U95, lower and upper bounds of the 95% confidence interval for the OR
Phase 3 Dataset (Affymetrix Genotyping)
Description and Genotyping
A subset of Caucasian samples was selected for resequencing of the entire mitochondrial genome (Table 1; Fig. 1). Before QC, the case group consisted of 400 samples that represented one affected individual per family (typically the proband), and the control group consisted of the 400 fathers of these individuals. We utilized the Affymetrix Human Mitochondrial Resequencing Array 2.0. (Affymetrix Inc. Santa Clara, CA) to resequence the entire mtDNA in this sample subset. This array uses microarray chip technology to sequence both strands of the entire mtDNA sequence after performing three long-range PCR amplifications. Each base position is interrogated with eight unique 25-mer probes on the resequencing array, and allows for the detection of both known and novel base substitutions.
Analysis
Haploid calls were initially made by setting the Affymetrix GSEQ software algorithm parameters to the haploid model and the quality score threshold to 12 (Coon et al., 2006). A summary of the sequencing results for each sample was generated with MSDAT, a powerful tool developed by our group for the analysis of mtDNA sequence data. Call rate thresholds were set at 95% for both samples and SNPs. As a result, 842 out of 16,544 positions and 49 out of 800 samples were dropped using the PLATO software package (Grady et al., 2010). Additional base positions were dropped depending on the analysis, with both tri-allelic (n= 29) and monomorphic base calls (n=14,732) being dropped as part of the single marker analysis. In this phase, maternal genotypes were unavailable for conducting additional mitochondrial error checks. The sample call rate threshold reduced the final sample counts to 372 controls and 379 cases. We assessed significance by permutation testing for 183 common (MAF>0.01), variants, and separately for 941 variants (no MAF filter) using the program RVASSOC (Kinnamon, 2010) which implements Cochran-Armitage (CA) max/sum tests (Kinnamon et al., 2012). Moreover, we tested for coding variation (Table 5) and heteroplasmy differences, examined our dataset for presumably rare variation that has been shown to be associated with other mitochondrial disorders (Table 6), and performed mutational burden assessments between our cases and controls. We qualitatively assessed the differences in heteroplasmic SNP distributions between cases and controls (Cutler et al., 2001) using the diploid GSEQ algorithm settings, a quality threshold of 3 and a call rate threshold of 95%. We were able to examine 16,010 out of the 16,544 mitochondrial positions. We followed the approaches set forth by Coon and colleagues to examine both heteroplasmy and mutational burden (Coon et al., 2006). Total mutational burden was calculated as the number of variants observed corrected for the number of sites/positions examined, multiplied by the number of cases or controls (Table 7).
Table 5.
Coding changes per gene in Phase 3 analysis
| Mito Gene | *Synonymous Changes | **Non-synonymous Changes | ||||
|---|---|---|---|---|---|---|
| Controls | Cases | P-Value | Controls | Cases | P-Value | |
| ATPase8 | 12 | 18 | 0.30 | 24 | 19 | 0.41 |
| ATPase6 | 80 | 66 | 0.20 | 93 | 101 | 0.66 |
| ND1 | 100 | 86 | 0.25 | 124 | 117 | 0.55 |
| ND2 | 136 | 152 | 0.43 | 92 | 99 | 0.71 |
| ND3 | 36 | 30 | 0.42 | 100 | 89 | 0.35 |
| ND4 | 525 | 544 | 0.78 | 46 | 32 | 0.10 |
| ND7 | 56 | 63 | 0.59 | 6 | 3 | 0.46 |
| ND5 | 357 | 364 | 0.99 | 131 | 129 | 0.78 |
| ND6 | 133 | 136 | 0.98 | 23 | 20 | 0.60 |
| CO1 | 302 | 306 | 0.95 | 37 | 26 | 0.14 |
| CO2 | 66 | 71 | 0.75 | 10 | 9 | 0.79 |
| CO3 | 117 | 103 | 0.28 | 55 | 70 | 0.22 |
| Cytb | 162 | 151 | 0.43 | 448 | 452 | 0.88 |
Coding changes per gene that DO NOT result in an amino acid change from rCRS
Coding changes per gene that DO result in an amino acid change from rCRS
Table 6.
mtDNA variants shown to be associated with other diseases
| *SNP | Basepair position | Minor Allele | **P-value |
|---|---|---|---|
| MitoT1005C | 1005 | C | 0.50 |
| MitoG1438A | 1438 | A | 0.14 |
| MitoA1555G | 1555 | G | 0.12 |
| MitoG3316A | 3316 | A | 0.50 |
| MitoA3796G | 3796 | G | 0.25 |
| MitoC4025T | 4025 | T | 0.50 |
| MitoC4171A | 4171 | A | 0.50 |
| MitoA4295G | 4295 | G | 0.38 |
| MitoC4640A | 4640 | A | 0.49 |
| MitoT5814C | 5814 | C | 0.50 |
| MitoC6489A | 6489 | A | 0.25 |
| MitoG7444A | 7444 | A | 0.50 |
| MitoA8348G | 8348 | G | 0.50 |
| MitoG9804A | 9804 | A | 0.10 |
| MitoT9957C | 9957 | C | 0.50 |
| MitoT10237C | 10237 | C | 0.49 |
| MitoA11084G | 11084 | G | 0.50 |
| MitoT11253C | 11253 | C | 0.16 |
| MitoG11696A | 11696 | A | 0.51 |
| MitoA12026G | 12026 | G | 0.50 |
| MitoT12297C | 12297 | C | 0.50 |
| MitoT12811C | 12811 | C | 0.25 |
| MitoA13637G | 13637 | G | 0.02 |
| MitoT14325C | 14325 | C | 0.38 |
| MitoG14831A | 14831 | A | 0.25 |
Novel Phase 3 interrogated variation was compared against the “mtDNA Mutations with Reports of Disease-Association” from www.mitomap.org
Fisher’s exact test with 1 degree of freedom
Table 7.
The distribution of mtDNA SNPs between ASD Cases and Controls in the Phase 3 resequencing dataset
| *Total sites possible | Cases | Controls | χ2 P-value | |||||
|---|---|---|---|---|---|---|---|---|
| Total observed | Per individual (N = 379) | **Total mutational burden | Total observed | Per individual (N = 372) | **Total mutational burden | |||
| Sequence variants1 | 16, 010 | 20085 | 53.0 | 0.0033 | 18435 | 49.6 | 0.0031 | NS |
| “n” SNPs | 16, 010 | 13153 | 34.7 | 0.0022 | 11566 | 31.1 | 0.0019 | NS |
| Homoplasmic SNPs2 | 16, 010 | 6932 | 18.3 | 0.0011 | 6869 | 18.5 | 0.0012 | NS |
| Potential heteroplasmic SNPs3 | 16, 010 | 14221 | 37.5 | 0.0023 | 12610 | 33.9 | 0.0021 | NS |
| Heteroplasmic SNPs4 | 16, 010 | 1068 | 2.8 | 0.0002 | 1044 | 2.8 | 0.0002 | > 0.05 |
rCRS probes to 16, 544 positions, 534 of which failed the 95% call rate threshold using the diploid algorithm
Total mutational burden = total variants observed/(total sites possible x N of cases or controls)
Homoplasmic SNPs and n calls
IUPAC codes “a”, “c”, “g”, “t”
IUPAC codes “r”, “y”, “k”, “m”, “s”, “w”, “n”
IUPAC codes “r”, “y”, “k”, “m”, “s”, “w”
Additional QC across all phases
The existence of overlapping sample and marker datasets made a cross-platform genotype concordance QC measure possible. This validation step provided additional confidence and validation of our genotype calls across the different platforms and phases of this project. Examining only non-missing data and comparing phase1 with phase 2 data (6371 pair-wise comparisons across 1276 common samples and five common SNPs), yielded a genotype concordance rate of 0.998. Evaluation of phase1 with phase 3 data considered 713 common samples and 132 common SNPs with a total of 92,516 pair-wise comparisons and yielded a concordance rate of 0.999. Finally, examination of phase 2 with phase 3 considered 6340 comparisons between 534 common samples and 12 common SNPs returned a concordance rate of 1.0.
RESULTS
In phase 1, we had >80% power to detect a genotype relative risk (GRR) of 1.3 for any single SNP, with a type 1 error rate of 0.05 and an allele frequency of 0.10. The small number of individuals with African ancestry in our dataset significantly decreases the power for this subset (12% power for GRR of 1.3, α=0.05, MAF=0.10). Our stratified CMH test identified six nominally significant variants (p≤ 0.05) that do not survive Bonferroni correction (Table S1). Using a continuous variable to control for stratification in a logistic regression framework, we identified six SNPs with nominal p-values (p ≤ 0.05) through our single marker tests of association (Table 2; Fig. 2; Table S3). These nominal associations do not survive either Bonferroni correction or our less conservative assessment via permutation testing using RVASSOC in the homogeneous Caucasian non-Hispanic subset of phase 1 (observed max χ2 =4.81, p=0.93). Of note, four of these six nominally significant variants overlap the stratified and logistic regression approaches; out of these four overlapping variants, two (mtDNA positions 9899 and 10589) tag subgroups of haplogroup L.
Figure 2.
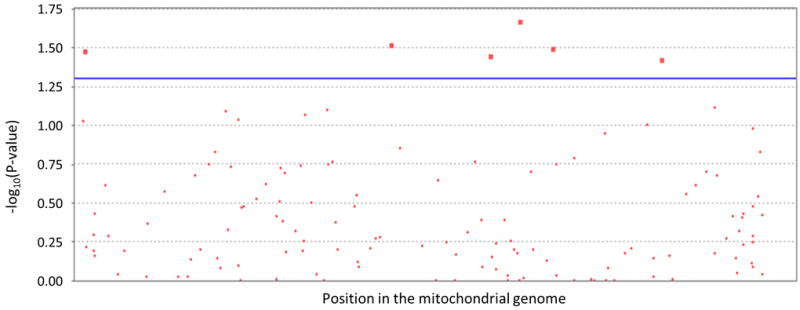
A manhattan plot of the phase 1 logistic regresstion results.
The line represents the uncorrected significance threshold (P ≤ 0.05)
In phase 2, we examined both the major European haplogroups and European haplogroup defining SNPs for association to ASD susceptibility. Our haplogroup analysis yielded no significant difference in the frequency of cases versus controls for any particular haplogroup (Table 3). There are too few SNPs in this phase to control for population substructure using the principal components approach we used in phase 1. Instead, we used the haplogroups as covariates in a logistic regression analysis. We see no significant difference between our cases and controls for any of these single haplogroup defining SNPs (Table 4). Interestingly, individuals with self-reported African ancestry belong to a number of haplogroups other than haplogroup L.
Given that the samples in phase 3 are almost completely overlapping with those genotyped in phase 1 and 2, we chose not to perform single marker association tests of the 139 SNPs previously examined in those phases within this dataset. The advantage of this phase rests in capturing rare variants which cannot be powerfully tested with single marker tests of association. We confirmed the homogeneity of the phase 3 dataset which was based on self-report using the mtGIF calculated with χ2 test statistics from all 941 polymorphic positions. Subsequently, we performed a joint test of these variants, many of which have MAF ≤ 0.01 and are spread across the mitochondrial genome; this returned no significant results (observed max χ2 =6.34, p=0.70).
Furthermore, we examined whether we detected more rare variation in total among cases when compared to controls specifically in the coding regions of the 13 protein subunits of the mitochondrial electron transport chain. We found no significant difference between our cases and controls for either the number of synonymous or non-synonymous changes in these genes (Table 5).
We specifically analyzed our phase 3 dataset to determine if any of our samples contained any of these rare variations as reported and organized by the MitoMap project (http://www.mitomap.org). We identified 25 variants which were not previously examined in phases 1 or 2 that were in the MitoMap tables of ‘mtDNA Mutations with Reports of Disease-Associations’ from http://www.mitomap.org (Table 6). These tables contain any mtDNA variant that is reported in the literature of disease associations, but not necessarily replicated in subsequent investigations. A single variant (A13637G), previously associated to Lieber’s Hereditary Optic Neuropathy (LHON), demonstrated a nominally significant p-value before multiple testing correction (p=0.02) using the Fisher’s Exact test. This rare allele was found in eight ASD cases and a single control.
Finally, we examined our phase 3 dataset for evidence of heteroplasmy and mutational burden differences between cases and controls. We examined the mutational burden in a specific subset of the variants detected, however failed to find any significant difference between our ASD case and control datasets (Table 7). No significant difference was found between cases and controls in the heteroplasmy analysis using individual raw intensity allele data (data not shown).
DISCUSSION
In recent years, there has been considerable speculation that mitochondrial variation may play a role in autism spectrum disorders. We performed the first comprehensive investigation of this hypothesis. Because of common ancestry and maternal inheritance of mtDNA, the vast majority of humans can be assigned to a known haplogroup that arose during ancient migrations. Approximately 40% of Caucasians of European descent belong to haplogroup H, and the total prevalence of the next most common mitochondrial haplogroups (I, J, and K) is approximately 25% (Torroni et al., 1994). Although most persons of African descent belong to haplogroup L, this group is extremely diverse and can be divided into many sub-haplogroups (Chen et al., 1995). This genetic variation results in distinctive sets of human mitochondrial electron transport chains with different capacities for energy production, free radical generation and apoptosis (Swerdlow et al., 1996; Wallace, 2005). Despite the initial sequencing of the mitochondrion in the 1980s, routine full mitochondrial sequencing has been prohibitively expensive and thus the full complement of variation has not been routinely examined in any disease.
In each of the phases of this study, we searched for whether we find evidence of association of mitochondrial variation in ASD. While we do not detect strong evidence for significant main effects of any single mtDNA variation in our current dataset, we identify only a handful of variants demonstrating a mild level of significance. Furthermore, with our substantially larger dataset than the one explored by Kent and colleagues (Kent et al., 2008), we find that there is no compelling evidence that European mitochondrial haplogroups influence risk of developing ASDs. Our inability to detect a significant haplogroup association is not surprising based on the work by Samuels and colleagues noting that the reliable detection of haplogroup associations in complex disease is difficult under most study conditions where power is limited with sample sizes <10,000 (Samuels et al., 2006).
It is intriguing to note that a couple of the nominal hits in phase 1 tag subgroups of haplogroup L. These signals are generated by the small and diverse set of self-reported African-ancestry samples within our dataset. The inherent diversity, which this panel of markers is designed to capture, among individuals of African ancestry combined with probable admixture and consequent misclassification of their mitochondrial ancestry increases the difficulty of appropriately ascertaining matched cases and controls based on self-report. Importantly, our study underlines the need for larger, more powerful studies of patients with African ancestry. These will allow us to make a definitive statement on the involvement of mtDNA in ASD susceptibility in a more inclusive manner.
Beyond our examination of single marker tests for association, we have explored a number of additional possible mechanisms by which mitochondrial variation may play a role in ASD. Collectively, our investigations fail to provide any convincing evidence for a major contribution of mtDNA variation or heteroplasmy to ASD.
Software
MSDAT source code and documentation is available for download at the Hussman Institute for Human Genetics website at http://hihg.med.miami.edu/software-download.
Supplementary Material
Table S1. Results of the phase 1 stratified analysis based on genetically determined clusters
Table S2. Characterization of the European Haplogroups
Table S3. Logistic regression results of mtDNA variation interrogated in phase 1
Figure S1. Phase 1 PC1 × PC2 plots
Acknowledgments
We thank the autism patients and their families, as well as the control parents and children for their participation in our studies. This work would not be possible without their generosity. We gratefully acknowledge the resources provided by the Autism Genetic Resource Exchange (AGRE) Consortium and the participating AGRE families. The AGRE is a program of Autism Speaks and is supported in part, by grant 1U24MH081810 from the National Institute of Mental Health to Clara M. Lajonchere (PI). We thank the individuals who volunteered for the control sample for their participation. A number of control subjects came from the National Institute of Mental Health Schizophrenia Genetics Initiative (NIMH-GI), data and biomaterials were collected by the ‘Molecular Genetics of Schizophrenia II’ (MGS-2) collaboration. The investigators and co-investigators are: ENH/Northwestern University, Evanston, IL, MH059571, Pablo V. Gejman, M.D. (Collaboration Coordinator; PI), Alan R. Sanders, M.D.; Emory University School of Medicine, Atlanta GA, MH59587, Farooq Amin, M.D. (PI); Louisiana State University Health Sciences Center; New Orleans, Louisiana, MH067257, Nancy Buccola APRN, BC, MSN (PI); University of California-Irvine, Irvine, CA, MH60870, William Byerley, M.D. (PI); Washington University, St. Louis, MO, U01, MH060879, C. Robert Cloninger, M.D. (PI); University of Iowa, Iowa City, IA, MH59566, Raymond Crowe, M.D. (PI), Donald Black, M.D.; University of Colorado, Denver, CO, MH059565, Robert Freedman, M.D. (PI); University of Pennsylvania, Philadelphia, PA, MH061675, Douglas Levinson, M.D. (PI); University of Queensland, Queensland, Australia, MH059588, Bryan Mowry, M.D. (PI); Mt. Sinai School of Medicine, New York, NY, MH59586, Jeremy Silverman, Ph.D. (PI). In addition, cord blood samples were collected by V L Nimgaonkar’s group at the University of Pittsburgh, as part of a multi-institutional collaborative research project with J Smoller, MD DSc and P Sklar, MD PhD (Massachusetts General Hospital) (grant MH 63420).
We are grateful to the John P. Hussman Institute for Human Genomics (HIHG) personnel within the Patient and Family Ascertainment Core, the Biorepository, and the Center for Genome Technology for their commitment to this project. This research was supported by grants from the National Institutes of Health (9R01MH080647 and 7P01NS026630) and by a gift from the Hussman Foundation. A subset of the participants was ascertained while Dr. Pericak-Vance was a faculty member at Duke University.
Footnotes
Author contributions
JLM, JLH, and MPV designed the study. JLM, AH, ERM led the writing and revising of the manuscript. PLW, IK, DJH, JG performed and directed all molecular work including the genotyping and mtDNA resequencing efforts. AH, JLM, MS, and ERM performed the QC and statistical analysis. HHW, RKA, MLC, JLH, and MPV were involved in recruiting autism families and controls for this study. RKM and SMW provided control sample DNA. All authors have read and contributed to the manuscript.
Supporting Information
Additional supporting information may be found in the online version of this article:
As a service to our authors and readers, this journal provides supporting information supplied by the authors. Such materials are peer-reviewed and may be re-organised for online delivery, but are not copy-edited or typeset. Technical support issues arising from supporting information (other than missing files) should be addressed to the authors.
Conflict of interest
The authors declare no conflict of interest.
References
- Anney R, Klei L, Pinto D, Regan R, Conroy J, Magalhaes TR, Correia C, Abrahams BS, Sykes N, Pagnamenta AT, Almeida J, Bacchelli E, Bailey AJ, Baird G, Battaglia A, Berney T, Bolshakova N, Bolte S, Bolton PF, Bourgeron T, Brennan S, Brian J, Carson AR, Casallo G, Casey J, Chu SH, Cochrane L, Corsello C, Crawford EL, Crossett A, Dawson G, de Jonge M, Delorme R, Drmic I, Duketis E, Duque F, Estes A, Farrar P, Fernandez BA, Folstein SE, Fombonne E, Freitag CM, Gilbert J, Gillberg C, Glessner JT, Goldberg J, Green J, Guter SJ, Hakonarson H, Heron EA, Hill M, Holt R, Howe JL, Hughes G, Hus V, Igliozzi R, Kim C, Klauck SM, Kolevzon A, Korvatska O, Kustanovich V, Lajonchere CM, Lamb JA, Laskawiec M, Leboyer M, Le Couteur A, Leventhal BL, Lionel AC, Liu XQ, Lord C, Lotspeich L, Lund SC, Maestrini E, Mahoney W, Mantoulan C, Marshall CR, McConachie H, McDougle CJ, McGrath J, McMahon WM, Melhem NM, Merikangas A, Migita O, Minshew NJ, Mirza GK, Munson J, Nelson SF, Noakes C, Noor A, Nygren G, Oliveira G, Papanikolaou K, Parr JR, Parrini B, Paton T, Pickles A, Piven J, Posey DJ, Poustka A, Poustka F, Prasad A, Ragoussis J, Renshaw K, Rickaby J, Roberts W, Roeder K, Roge B, Rutter ML, Bierut LJ, Rice JP, Salt J, Sansom K, Sato D, Segurado R, Senman L, Shah N, Sheffield VC, Soorya L, Sousa I, Stoppioni V, Strawbridge C, Tancredi R, Tansey K, Thiruvahindrapduram B, Thompson AP, Thomson S, Tryfon A, Tsiantis J, Van Engeland H, Vincent JB, Volkmar F, Wallace S, Wang K, Wang Z, Wassink TH, Wing K, Wittemeyer K, Wood S, Yaspan BL, Zurawiecki D, Zwaigenbaum L, Betancur C, Buxbaum JD, Cantor RM, Cook EH, Coon H, Cuccaro ML, Gallagher L, Geschwind DH, Gill M, Haines JL, Miller J, Monaco AP, Nurnberger JI, Jr, Paterson AD, Pericak-Vance MA, Schellenberg GD, Scherer SW, Sutcliffe JS, Szatmari P, Vicente AM, Vieland VJ, Wijsman EM, Devlin B, Ennis S, Hallmayer J. A genome-wide scan for common alleles affecting risk for autism. Hum Mol Genet. 2010;19:4072–82. doi: 10.1093/hmg/ddq307. [DOI] [PMC free article] [PubMed] [Google Scholar]
- Autism and Developmental Disabilities Monitoring Network Surveillance Year 2008 Principal Investigators. Prevalence of autism spectrum disorders - autism and developmental disabilities monitoring network, 14 sites, United States, 2008. MMWR Surveill Summ. 2012;61:1–19. [PubMed] [Google Scholar]
- Autism Genetics Resource Exchange 2008. AGRE. 2008 Jul; 2008-last update, [Homepage of Autism Speaks], [Online]. Available: http://www.agre.org/
- Autism Genome Project Consortium. Szatmari P, Paterson AD, Zwaigenbaum L, Roberts W, Brian J, Liu XQ, Vincent JB, Skaug JL, Thompson AP, Senman L, Feuk L, Qian C, Bryson SE, Jones MB, Marshall CR, Scherer SW, Vieland VJ, Bartlett C, Mangin LV, Goedken R, Segre A, Pericak-Vance MA, Cuccaro ML, Gilbert JR, Wright HH, Abramson RK, Betancur C, Bourgeron T, Gillberg C, Leboyer M, Buxbaum JD, Davis KL, Hollander E, Silverman JM, Hallmayer J, Lotspeich L, Sutcliffe JS, Haines JL, Folstein SE, Piven J, Wassink TH, Sheffield V, Geschwind DH, Bucan M, Brown WT, Cantor RM, Constantino JN, Gilliam TC, Herbert M, Lajonchere C, Ledbetter DH, Lese-Martin C, Miller J, Nelson S, Samango-Sprouse CA, Spence S, State M, Tanzi RE, Coon H, Dawson G, Devlin B, Estes A, Flodman P, Klei L, McMahon WM, Minshew N, Munson J, Korvatska E, Rodier PM, Schellenberg GD, Smith M, Spence MA, Stodgell C, Tepper PG, Wijsman EM, Yu CE, Roge B, Mantoulan C, Wittemeyer K, Poustka A, Felder B, Klauck SM, Schuster C, Poustka F, Bolte S, Feineis-Matthews S, Herbrecht E, Schmotzer G, Tsiantis J, Papanikolaou K, Maestrini E, Bacchelli E, Blasi F, Carone S, Toma C, Van Engeland H, de Jonge M, Kemner C, Koop F, Langemeijer M, Hijmans C, Staal WG, Baird G, Bolton PF, Rutter ML, Weisblatt E, Green J, Aldred C, Wilkinson JA, Pickles A, Le Couteur A, Berney T, McConachie H, Bailey AJ, Francis K, Honeyman G, Hutchinson A, Parr JR, Wallace S, Monaco AP, Barnby G, Kobayashi K, Lamb JA, Sousa I, Sykes N, Cook EH, Guter SJ, Leventhal BL, Salt J, Lord C, Corsello C, Hus V, Weeks DE, Volkmar F, Tauber M, Fombonne E, Shih A, Meyer KJ. Mapping autism risk loci using genetic linkage and chromosomal rearrangements. Nat Genet. 2007;39:319–328. doi: 10.1038/ng1985. [DOI] [PMC free article] [PubMed] [Google Scholar]
- Bailey A, Le Couteur A, Gottesman I, Bolton P, Simonoff E, Yuzda E, Rutter M. Autism as a strongly genetic disorder: evidence from a British twin study. Psychol Med. 1995;25:63–77. doi: 10.1017/s0033291700028099. [DOI] [PubMed] [Google Scholar]
- Baron-Cohen S, Jolliffe T, Mortimore C, Robertson M. Another advanced test of theory of mind: evidence from very high functioning adults with autism or asperger syndrome. J Child Psychol Psychiatry. 1997;38:813–822. doi: 10.1111/j.1469-7610.1997.tb01599.x. [DOI] [PubMed] [Google Scholar]
- Biffi A, Anderson CD, Nalls MA, Rahman R, Sonni A, Cortellini L, Rost NS, Matarin M, Hernandez DG, Plourde A, de Bakker PI, Ross OA, Greenberg SM, Furie KL, Meschia JF, Singleton AB, Saxena R, Rosand J. Principal-component analysis for assessment of population stratification in mitochondrial medical genetics. Am J Hum Genet. 2010;86:904–917. doi: 10.1016/j.ajhg.2010.05.005. [DOI] [PMC free article] [PubMed] [Google Scholar]
- Bishop DV, Maybery M, Maley A, Wong D, Hill W, Hallmayer J. Using self-report to identify the broad phenotype in parents of children with autistic spectrum disorders: a study using the Autism-Spectrum Quotient. J Child Psychol Psychiatry. 2004;45:1431–1436. doi: 10.1111/j.1469-7610.2004.00849.x. [DOI] [PubMed] [Google Scholar]
- Blasi F, Bacchelli E, Carone S, Toma C, Monaco AP, Bailey AJ, Maestrini E. SLC25A12 and CMYA3 gene variants are not associated with autism in the IMGSAC multiplex family sample. Eur J Hum Genet. 2006;14:123–126. doi: 10.1038/sj.ejhg.5201444. [DOI] [PubMed] [Google Scholar]
- Canter JA, Olson LM, Spencer K, Schnetz-Boutaud N, Anderson B, Hauser MA, Schmidt S, Postel EA, Agarwal A, Pericak-Vance MA, Sternberg P, Jr, Haines JL. Mitochondrial DNA polymorphism A4917G is independently associated with age-related macular degeneration. PLoS ONE. 2008;3:e2091. doi: 10.1371/journal.pone.0002091. [DOI] [PMC free article] [PubMed] [Google Scholar]
- Chauhan A, Chauhan V. Oxidative stress in autism. Pathophysiology. 2006;13:171–181. doi: 10.1016/j.pathophys.2006.05.007. [DOI] [PubMed] [Google Scholar]
- Chen YS, Torroni A, Excoffier L, Santachiara-Benerecetti AS, Wallace DC. Analysis of mtDNA variation in African populations reveals the most ancient of all human continent-specific haplogroups. Am J Hum Genet. 1995;57:133–149. [PMC free article] [PubMed] [Google Scholar]
- Chugani DC, Muzik O, Behen M, Rothermel R, Janisse JJ, Lee J, Chugani HT. Developmental changes in brain serotonin synthesis capacity in autistic and nonautistic children. Ann Neurol. 1999;45:287–295. doi: 10.1002/1531-8249(199903)45:3<287::aid-ana3>3.0.co;2-9. [DOI] [PubMed] [Google Scholar]
- Clark-Taylor T, Clark-Taylor BE. Is autism a disorder of fatty acid metabolism? Possible dysfunction of mitochondrial beta-oxidation by long chain acyl-CoA dehydrogenase. Med Hypotheses. 2004;62:970–975. doi: 10.1016/j.mehy.2004.01.011. [DOI] [PubMed] [Google Scholar]
- Constantino JN, Todd RD. Intergenerational transmission of subthreshold autistic traits in the general population. Biol Psychiatry. 2005;57:655–660. doi: 10.1016/j.biopsych.2004.12.014. [DOI] [PubMed] [Google Scholar]
- Coon KD, Valla J, Szelinger S, Schneider LE, Niedzielko TL, Brown KM, Pearson JV, Halperin R, Dunckley T, Papassotiropoulos A, Caselli RJ, Reiman EM, Stephan DA. Quantitation of heteroplasmy of mtDNA sequence variants identified in a population of AD patients and controls by array-based resequencing. Mitochondrion. 2006;6:194–210. doi: 10.1016/j.mito.2006.07.002. [DOI] [PubMed] [Google Scholar]
- Correia C, Coutinho AM, Diogo L, Grazina M, Marques C, Miguel T, Ataide A, Almeida J, Borges L, Oliveira C, Oliveira G, Vicente AM. Brief report: High frequency of biochemical markers for mitochondrial dysfunction in autism: no association with the mitochondrial aspartate/glutamate carrier SLC25A12 gene. J Autism Dev Disord. 2006;36:1137–1140. doi: 10.1007/s10803-006-0138-6. [DOI] [PubMed] [Google Scholar]
- Cutler DJ, Zwick ME, Carrasquillo MM, Yohn CT, Tobin KP, Kashuk C, Mathews DJ, Shah NA, Eichler EE, Warrington JA, Chakravarti A. High-throughput variation detection and genotyping using microarrays. Genome Res. 2001;11:1913–1925. doi: 10.1101/gr.197201. [DOI] [PMC free article] [PubMed] [Google Scholar]
- de Zwart LL, Meerman JH, Commandeur JN, Vermeulen NP. Biomarkers of free radical damage applications in experimental animals and in humans. Free Radic Biol Med. 1999;26:202–226. doi: 10.1016/s0891-5849(98)00196-8. [DOI] [PubMed] [Google Scholar]
- Feig DI, Reid TM, Loeb LA. Reactive oxygen species in tumorigenesis. Cancer Res. 1994;54:1890s–1894s. [PubMed] [Google Scholar]
- Filipek PA, Juranek J, Smith M, Mays LZ, Ramos ER, Bocian M, Masser-Frye D, Laulhere TM, Modahl C, Spence MA, Gargus JJ. Mitochondrial dysfunction in autistic patients with 15q inverted duplication. Ann Neurol. 2003;53:801–804. doi: 10.1002/ana.10596. [DOI] [PubMed] [Google Scholar]
- Fillano JJ, Goldenthal MJ, Rhodes CH, Marin-Garcia J. Mitochondrial dysfunction in patients with hypotonia, epilepsy, autism, and developmental delay: HEADD syndrome. J Child Neurol. 2002;17:435–439. doi: 10.1177/088307380201700607. [DOI] [PubMed] [Google Scholar]
- Folstein SE, Piven J. Etiology of autism: genetic influences. Pediatrics. 1991;87:767–773. [PubMed] [Google Scholar]
- Fombonne E. Epidemiology of pervasive developmental disorders. Pediatr Res. 2009;65:591–598. doi: 10.1203/PDR.0b013e31819e7203. [DOI] [PubMed] [Google Scholar]
- Fombonne E. Epidemiological trends in rates of autism. Mol Psychiatry. 2002;7(Suppl 2):S4–S6. doi: 10.1038/sj.mp.4001162. [DOI] [PubMed] [Google Scholar]
- Grady BJ, Torstenson E, Dudek SM, Giles J, Sexton D, Ritchie MD. Finding unique filter sets in plato: a precursor to efficient interaction analysis in gwas data. Pac Symp Biocomput. 2010:315–326. [PMC free article] [PubMed] [Google Scholar]
- Graf WD, Marin-Garcia J, Gao HG, Pizzo S, Naviaux RK, Markusic D, Barshop BA, Courchesne E, Haas RH. Autism associated with the mitochondrial DNA G8363A transfer RNA(Lys) mutation. J Child Neurol. 2000;15:357–361. doi: 10.1177/088307380001500601. [DOI] [PubMed] [Google Scholar]
- Griswold AJ, Ma D, Cukier HN, Nations LD, Schmidt MA, Chung R, Jaworski JM, Salyakina D, Konidari I, Whitehead PL, Wright HH, Abramson RK, Williams SM, Menon R, Martin ER, Haines JL, Gilbert JR, Cuccaro ML, Pericak-Vance MA. Evaluation of Copy Number Variations Reveals Novel Candidate Genes in Autism Spectrum Disorder Associated Pathways. Hum Mol Genet. 2012;21:3513–3523. doi: 10.1093/hmg/dds164. [DOI] [PMC free article] [PubMed] [Google Scholar]
- Howell N, Elson JL, Chinnery PF, Turnbull DM. mtDNA mutations and common neurodegenerative disorders. Trends Genet. 2005;21:583–586. doi: 10.1016/j.tig.2005.08.012. [DOI] [PubMed] [Google Scholar]
- Kang D, Hamasaki N. Mitochondrial oxidative stress and mitochondrial DNA. Clin Chem Lab Med. 2003;41:1281–1288. doi: 10.1515/CCLM.2003.195. [DOI] [PubMed] [Google Scholar]
- Kent L, Gallagher L, Elliott HR, Mowbray C, Chinnery PF. An investigation of mitochondrial haplogroups in autism. Am J Med Genet B Neuropsychiatr Genet. 2008;147B:987–989. doi: 10.1002/ajmg.b.30687. [DOI] [PubMed] [Google Scholar]
- Kinnamon DD. [01 Aug 2012];RVASSOC: Rare Variant ASSOCiation (version 11) 2010 [Source code] Available at http://rvassoc.sourceforge.net.
- Kinnamon DD, Hershberger RE, Martin ER. Reconsidering association testing methods using single-variant test statistics as alternatives to pooling tests for sequence data with rare variants. PLoS ONE. 2012;7(2):e30238. doi: 10.1371/journal.pone.0030238. [DOI] [PMC free article] [PubMed] [Google Scholar]
- Lerman-Sagie T, Leshinsky-Silver E, Watemberg N, Lev D. Should autistic children be evaluated for mitochondrial disorders? J Child Neurol. 2004;19:379–381. doi: 10.1177/088307380401900510. [DOI] [PubMed] [Google Scholar]
- Lombard J. Autism: a mitochondrial disorder? Med Hypotheses. 1998;50:497–500. doi: 10.1016/s0306-9877(98)90270-5. [DOI] [PubMed] [Google Scholar]
- Ma D, Salyakina D, Jaworski JM, Konidari I, Whitehead PL, Andersen AN, Hoffman JD, Slifer SH, Hedges DJ, Cukier HN, Griswold AJ, McCauley JL, Beecham GW, Wright HH, Abramson RK, Martin ER, Hussman JP, Gilbert JR, Cuccaro ML, Haines JL, Pericak-Vance MA. A genome-wide association study of autism reveals a common novel risk locus at 5p14.1. Ann Hum Genet. 2009;73:263–273. doi: 10.1111/j.1469-1809.2009.00523.x. [DOI] [PMC free article] [PubMed] [Google Scholar]
- Oliveira G, Diogo L, Grazina M, Garcia P, Ataide A, Marques C, Miguel T, Borges L, Vicente AM, Oliveira CR. Mitochondrial dysfunction in autism spectrum disorders: a population-based study. Dev Med Child Neurol. 2005;47:185–189. doi: 10.1017/s0012162205000332. [DOI] [PubMed] [Google Scholar]
- Otsuka H, Harada M, Mori K, Hisaoka S, Nishitani H. Brain metabolites in the hippocampus-amygdala region and cerebellum in autism: an 1H-MR spectroscopy study. Neuroradiology. 1999;41:517–519. doi: 10.1007/s002340050795. [DOI] [PubMed] [Google Scholar]
- Pan JW, Takahashi K. Interdependence of N-acetyl aspartate and high-energy phosphates in healthy human brain. Ann Neurol. 2005;57:92–97. doi: 10.1002/ana.20317. [DOI] [PubMed] [Google Scholar]
- Papa S. Mitochondrial oxidative phosphorylation changes in the life span. Molecular aspects and physiopathological implications. Biochim Biophys Acta. 1996;1276:87–105. doi: 10.1016/0005-2728(96)00077-1. [DOI] [PubMed] [Google Scholar]
- Penta JS, Johnson FM, Wachsman JT, Copeland WC. Mitochondrial DNA in human malignancy. Mutat Res. 2001;488:119–133. doi: 10.1016/s1383-5742(01)00053-9. [DOI] [PubMed] [Google Scholar]
- Poling JS, Frye RE, Shoffner J, Zimmerman AW. Developmental regression and mitochondrial dysfunction in a child with autism. J Child Neurol. 2006;21:170–172. doi: 10.2310/7010.2006.00032. [DOI] [PMC free article] [PubMed] [Google Scholar]
- Pons R, Andreu AL, Checcarelli N, Vila MR, Engelstad K, Sue CM, Shungu D, Haggerty R, de Vivo DC, DiMauro S. Mitochondrial DNA abnormalities and autistic spectrum disorders. J Pediatr. 2004;144:81–85. doi: 10.1016/j.jpeds.2003.10.023. [DOI] [PubMed] [Google Scholar]
- Price AL, Patterson NJ, Plenge RM, Weinblatt ME, Shadick NA, Reich D. Principal components analysis corrects for stratification in genome-wide association studies. Nat Genet. 2006;38:904–909. doi: 10.1038/ng1847. [DOI] [PubMed] [Google Scholar]
- Pritchard JK, Stephens M, Donnelly P. Inference of population structure using multilocus genotype data. Genetics. 2000;155:945–959. doi: 10.1093/genetics/155.2.945. [DOI] [PMC free article] [PubMed] [Google Scholar]
- Purcell S, Neale B, Todd-Brown K, Thomas L, Ferreira MA, Bender D, Maller J, Sklar P, de Bakker PI, Daly MJ, Sham PC. PLINK: a tool set for whole-genome association and population-based linkage analyses. Am J Hum Genet. 2007;81:559–575. doi: 10.1086/519795. [DOI] [PMC free article] [PubMed] [Google Scholar]
- Rabionet R, McCauley Ph DJ, Jaworski MPHJ, Ashley-Koch AE, Martin ER, Sutcliffe JS, Haines JL, DeLong GR, Abramson RK, Wright HH, Cuccaro ML, Gilbert JR, Pericak-Vance MA. Lack of Association Between Autism and SLC25A12. Am J Psychiatry. 2006;163:929–931. doi: 10.1176/ajp.2006.163.5.929. [DOI] [PubMed] [Google Scholar]
- Ramoz N, Reichert JG, Smith CJ, Silverman JM, Bespalova IN, Davis KL, Buxbaum JD. Linkage and association of the mitochondrial aspartate/ glutamate carrier SLC25A12 gene with autism. Am J Psychiatry. 2004;161:662–669. doi: 10.1176/appi.ajp.161.4.662. [DOI] [PubMed] [Google Scholar]
- Raule N, Sevini F, Santoro A, Altilia S, Franceschi C. Association studies on human mitochondrial DNA: methodological aspects and results in the most common age-related diseases. Mitochondrion. 2007;7:29–38. doi: 10.1016/j.mito.2006.11.013. [DOI] [PubMed] [Google Scholar]
- Ritvo ER, Freeman BJ, Mason-Brothers A, Mo A, Ritvo AM. Concordance for the syndrome of autism in 40 pairs of afflicted twins. Am J Psychiatry. 1985;142:74–77. doi: 10.1176/ajp.142.1.74. [DOI] [PubMed] [Google Scholar]
- Rollins B, Martin MV, Sequeira PA, Moon EA, Morgan LZ, Watson SJ, Schatzberg A, Akil H, Myers RM, Jones EG, Wallace DC, Bunney WE, Vawter MP. Mitochondrial variants in schizophrenia, bipolar disorder, and major depressive disorder. PLoS One. 2009;4:e4913. doi: 10.1371/journal.pone.0004913. [DOI] [PMC free article] [PubMed] [Google Scholar]
- Rossignol DA, Rossignol LW, James SJ, Melnyk S, Mumper E. The effects of hyperbaric oxygen therapy on oxidative stress, inflammation, and symptoms in children with autism: an open-label pilot study. BMC Pediatr. 2007;7:36. doi: 10.1186/1471-2431-7-36. [DOI] [PMC free article] [PubMed] [Google Scholar]
- Rutter M, Bailey A, Berument SK, LeCouteur A, Lord C, Pickles A. Social Communication Questionnaire (SCQ) Western Psychological Services; Los Angeles, CA: 2003a. [Google Scholar]
- Rutter M, LeCouteur A, Lord C. Autism Diagnostic Interview, Revised (ADI-R) Western Psychological Services; Los Angeles, CA: 2003b. [Google Scholar]
- Salyakina D, Cukier HN, Lee JM, Sacharow S, Nations LD, Ma D, Jaworski JM, Konidari I, Whitehead PL, Wright HH, Abramson RK, Williams SM, Menon R, Haines JL, Gilbert JR, Cuccaro ML, Pericak-Vance MA. Copy number variants in extended autism spectrum disorder families reveal candidates potentially involved in autism risk. PLoS One. 2011;6:e26049. doi: 10.1371/journal.pone.0026049. [DOI] [PMC free article] [PubMed] [Google Scholar]
- Samuels DC, Carothers AD, Horton R, Chinnery PF. The power to detect disease associations with mitochondrial DNA haplogroups. Am J Hum Genet. 2006;78:713–720. doi: 10.1086/502682. [DOI] [PMC free article] [PubMed] [Google Scholar]
- Satrustegui J, Contreras L, Ramos M, Marmol P, del Arco A, Saheki T, Pardo B. Role of aralar, the mitochondrial transporter of aspartate-glutamate, in brain N-acetylaspartate formation and Ca(2+) signaling in neuronal mitochondria. J Neurosci Res. 2007;85:3359–3366. doi: 10.1002/jnr.21299. [DOI] [PubMed] [Google Scholar]
- Scheffler IE. Mitochondria make a come back. Adv Drug Deliv Rev. 2001;49:3–26. doi: 10.1016/s0169-409x(01)00123-5. [DOI] [PubMed] [Google Scholar]
- Segurado R, Conroy J, Meally E, Fitzgerald M, Gill M, Gallagher L. Confirmation of association between autism and the mitochondrial aspartate/glutamate carrier SLC25A12 gene on chromosome 2q31. Am J Psychiatry. 2005;162:2182–2184. doi: 10.1176/appi.ajp.162.11.2182. [DOI] [PubMed] [Google Scholar]
- Sparrow SS, Balla D, Cicchetti D. Vineland Adaptive Behavior Scales. Interview Edition. AGS Publishing; Circle Pines, MN: 1984. [Google Scholar]
- Sparrow SS, Cicchetti DV, Balla D. Vineland Adaptive Behavior Scales--Second Edition. AGS; Circle Pines, MN: 2005. [Google Scholar]
- Swerdlow RH, Parks JK, Miller SW, Tuttle JB, Trimmer PA, Sheehan JP, Bennett JP, Jr, Davis RE, Parker WD. Origin and functional consequences of the complex I defect in Parkinson’s disease. 1996;40:663–671. doi: 10.1002/ana.410400417. [DOI] [PubMed] [Google Scholar]
- Torroni A, Lott MT, Cabell MF, Chen YS, Lavergne L, Wallace DC. mtDNA and the origin of Caucasians: identification of ancient Caucasian-specific haplogroups, one of which is prone to a recurrent somatic duplication in the D-loop region. Am J Hum Genet. 1994;55:760–776. [PMC free article] [PubMed] [Google Scholar]
- Tsai G, Coyle JT. N-acetylaspartate in neuropsychiatric disorders. Prog Neurobiol. 1995;46:531–540. doi: 10.1016/0301-0082(95)00014-m. [DOI] [PubMed] [Google Scholar]
- Tsao CY, Mendell JR. Autistic disorder in 2 children with mitochondrial disorders. J Child Neurol. 2007;22:1121–1123. doi: 10.1177/0883073807306266. [DOI] [PubMed] [Google Scholar]
- van der Walt JM, Nicodemus KK, Martin ER, Scott WK, Nance MA, Watts RL, Hubble JP, Haines JL, Koller WC, Lyons K, Pahwa R, Stern MB, Colcher A, Hiner BC, Jankovic J, Ondo WG, Allen FH, Jr, Goetz CG, Small GW, Mastaglia F, Stajich JM, McLaurin AC, Middleton LT, Scott BL, Schmechel DE, Pericak-Vance MA, Vance JM. Mitochondrial polymorphisms significantly reduce the risk of Parkinson disease. Am J Hum Genet. 2003;72:804–811. doi: 10.1086/373937. [DOI] [PMC free article] [PubMed] [Google Scholar]
- Wallace DC. A mitochondrial paradigm of metabolic and degenerative diseases, aging, and cancer: a dawn for evolutionary medicine. Annu Rev Genet. 2005;39:359–407. doi: 10.1146/annurev.genet.39.110304.095751. [DOI] [PMC free article] [PubMed] [Google Scholar]
- Wallace DC. Mitochondrial DNA in aging and disease. Sci Am. 1997;277:40–47. doi: 10.1038/scientificamerican0897-40. [DOI] [PubMed] [Google Scholar]
- Wallace DC. Mitochondrial DNA sequence variation in human evolution and disease. Proc Natl Acad Sci U S A. 1994;91:8739–8746. doi: 10.1073/pnas.91.19.8739. [DOI] [PMC free article] [PubMed] [Google Scholar]
- Wallace DC, Brown MD, Lott MT. Mitochondrial DNA variation in human evolution and disease. Gene. 1999;238:211–230. doi: 10.1016/s0378-1119(99)00295-4. [DOI] [PubMed] [Google Scholar]
- Wang K, Zhang H, Ma D, Bucan M, Glessner JT, Abrahams BS, Salyakina D, Imielinski M, Bradfield JP, Sleiman PM, Kim CE, Hou C, Frackelton E, Chiavacci R, Takahashi N, Sakurai T, Rappaport E, Lajonchere CM, Munson J, Estes A, Korvatska O, Piven J, Sonnenblick LI, Alvarez Retuerto AI, Herman EI, Dong H, Hutman T, Sigman M, Ozonoff S, Klin A, Owley T, Sweeney JA, Brune CW, Cantor RM, Bernier R, Gilbert JR, Cuccaro ML, McMahon WM, Miller J, State MW, Wassink TH, Coon H, Levy SE, Schultz RT, Nurnberger JI, Haines JL, Sutcliffe JS, Cook EH, Minshew NJ, Buxbaum JD, Dawson G, Grant SF, Geschwind DH, Pericak-Vance MA, Schellenberg GD, Hakonarson H. Common genetic variants on 5p14.1 associate with autism spectrum disorders. Nature. 2009;459:528–533. doi: 10.1038/nature07999. [DOI] [PMC free article] [PubMed] [Google Scholar]
- Weiss LA, Arking DE, Daly MJ, Chakravarti A Gene Discovery Project of Johns Hopkins & the Autism Consortium. A genome-wide linkage and association scan reveals novel loci for autism. Nature. 2009;461:802–808. doi: 10.1038/nature08490. [DOI] [PMC free article] [PubMed] [Google Scholar]
Associated Data
This section collects any data citations, data availability statements, or supplementary materials included in this article.
Supplementary Materials
Table S1. Results of the phase 1 stratified analysis based on genetically determined clusters
Table S2. Characterization of the European Haplogroups
Table S3. Logistic regression results of mtDNA variation interrogated in phase 1
Figure S1. Phase 1 PC1 × PC2 plots