

Abstract
Objective
The objective of this study is to comprehensively define the genetic basis of Early Onset Myasthenia Gravis.
Methods
We have carried out a two-stage genome-wide association study on a total of 649 North European EOMG patients. Cases were matched 1:4 with controls of European ancestry. We performed imputation and conditional analyses across the major histocompatibility complex, as well as in the top regions of association outside the HLA region.
Results
We observed the strongest association in the HLA class I region at rs7750641 (p = 1.2 × 10−92, OR = 6.25). By imputation and conditional analyses, HLA-B*08 proves to be the major associated allele (p = 2.87 × 10−113, OR = 6.41). In addition to the expected association with PTPN22 (rs2476601, OR =1.71, p = 8.2 ×10⁻¹⁰), an imputed coding variant (rs2233290) at position 151 (Pro→Ala) in the TNFAIP3-interacting protein 1, TNIP1, confers even stronger risk than PTPN22 (OR = 1.91, p = 3.2 × 10⁻¹⁰).
Interpretation
The association at TNIP1 in EOMG implies disease mechanisms involving ubiquitin-dependent dysregulation of NF-κB signaling. The localization of the major HLA signal to the HLA-B*08 allele suggests that CD8+ T-cells may play a key role in disease initiation or pathogenesis.
Introduction
Myasthenia gravis (MG) is a prototypic humoral autoimmune disorder1, 2. It is uncommon, with a prevalence of 1–2 cases per 10,000 overall 1. In ~20% of patients, it affects only the eye movements – ‘ocular MG’. In most patients with generalized weakness, it is clearly mediated by autoantibodies against the acetylcholine receptor (AChR) that lead to loss of functional receptors at the motor endplate1, 2. These antibodies can transfer the disease to neonates or experimental animals, and their depletion is an effective therapy3. These patients are grouped into the ~25% with early- and the ~40% with late-onset MG (before or after age 45; EOMG or LOMG) and the ~10% with thymomas1, 2. Although the incidence of LOMG appears to be increasing 4, few clear HLA or other genetic associations have yet emerged, partly because of further patient heterogeneity5. There are been even fewer such clues in patients with thymomas1, 2, possibly because predisposition by these tumors themselves overrides other factors6
In sharp contrast, EOMG in Caucasians is a particularly well defined subgroup, with a 4:1 female bias and characteristic lymph node-like infiltrates in the thymic medulla – i.e. thymic hyperplasia without thymoma1, 2 – which are strongly implicated in pathogenesis7. Outside of the HLA region, EOMG has been most prominently associated with the R620W PTPN22 risk allele8, as is the case for many other humoral autoimmune disorders9. In addition, polymorphisms at CHRNA1, which encodes the α-subunit of the AChR are quite strongly but rather specifically associated in EOMG patients with the youngest age of onset. One of these CHRNA1 SNPs interacts with the autoimmune regulator, AIRE, and so might affect thymic tolerance induction10. However, partly because of its rarity, genome-wide association studies (GWAS) of EOMG have been challenging to organize.
Finally, associations with the common extended HLA “8.1” haplotype (which carries the HLA-A1, -B8 and -DR3 alleles) have long been known in EOMG 11–13, as in several other highly specific autoimmune disorders and immunodeficiency states14. However, the very strong linkage disequilibrium extending over 2 million base pairs across this haplotype has made it difficult to pinpoint causative alleles for most of the associated immunological phenotypes15, including MG12, 13, 16. The application of recently developed intensive imputation and conditioning approaches to the analysis of MHC diversity17 has made this problem more tractable, and now enables us to examine the MHC associations in a large population of patients with EOMG in detail.
Materials and Methods
Study subjects
All EOMG cases included in these studies were North European and met the following criteria: 1) clinical diagnostic criteria for MG; 2) anti-AChR antibody positive; 3) no evidence of thymoma; 4) onset-age >10 years and either <40 years or <45 years with hyperplastic thymic histology. European EOMG cases were collected from multiple centers including: Stockholm, Sweden; Oslo, Norway; Manchester; England, Oxford, England; Paris, France; Leiden, Netherlands, and Tübingen, Germany and Marburg, Germany. Of a combined total of 740 cases collected, 649 cases (400 in discovery and 249 in replication sets) were included in the association testing after exclusions for quality control (<95% complete genotyping data), cryptic relationship analyses (PI^ > 0.15), ancestry analysis and a matching procedure. For several of the collaborating groups the recruitment was only for discovery (e.g. French) or replication (German). For other collaborating groups the initial selection was used for the discovery cohort and a second recruitment was used for the replication cohort. The EOMG cases were 82.9 % female (84.3%, discovery; 80.7%, replication), mean onset-age 25.0 (24.8 discovery; 25.4 replication). These cases were matched 4:1 with controls available from these same populations plus others from European-American populations as described below and as shown in (Supplementary Table 1).
Quality Control
We used stringent quality control criteria to ensure that high-quality data were included in the final analysis. Specifically, we excluded samples with >5% missing data, evidence of cryptic relatedness, or duplicate samples based on identity-by-descent status (PI^ > 0.15) using PLINK18. The SNP data were carefully reviewed and exclusion criteria applied to minimize potential batch effects as described below. The application of these criteria was particularly important given the derivation of genotypes from multiple platforms typed in different laboratories. We included only SNPs with <5% missing data, Hardy-Weinberg (H-W) equilibrium p values > 1 × 10⁻⁴ in controls and >1 × 10⁻⁵ in combined cases and controls, minor allele frequency > 0.05%. These procedures were applied in a stepwise approach separately for each dataset. Thus, for each of the separately derived control genotyping sets (Table S1), SNPs were excluded if they failed the above criteria within the individual control set (platform and laboratory) or in combination with any of the other control groups, or in the complete data set. The H-W criteria were applied after exclusion of non-European individuals (see Ancestry). Finally, after selection of the control data set (see Matching), SNPs were excluded if allele frequency differed by >10% between different control groups. For the discovery and replication study sets, 281,042 and 527,337 SNPs, respectively, passed these data filters. A total of 274,256 SNPs were common to these two sets and used in the combined analyses.
Ancestry and Case-Control Matching
European ancestry was determined using a panel of 187 ancestry-informative markers and analyzed using the STRUCTURE v2.119, 20 program and subjects of known European, Amerindian, East Asian and West African origin as previously described21. We used STRUCTURE to exclude non-European and admixed study participants, since the application of this Bayesian clustering method allows exclusion/inclusion criteria to be set using reference populations. Unlike principal components analysis (PCA), the clustering algorithm can be run under conditions that are not affected by the inclusion of the unknown samples. Briefly, analyses were performed using >100,000 re-samplings and >50,000 burn-in cycles under the admixture model. Runs were performed under the λ = 1 option where λ estimates the prior probability of the allele frequency and is based on the Dirichlet distribution of allele frequencies. Subjects with >15% non-European ancestry were excluded from further analysis. Details of the approach to case-control matching can be found in the Supplementary Materials. PCA analyses after matching show λgc values of 1.023 and 1.044 for the discovery and replication case/control sets, respectively.
Analytic Strategy and Association Testing Statistics
We first analyzed the discovery and replication population datasets separately (Table S2), and then by combining in two ways: i) results from either cases or controls in a meta-analysis applying Cochran–Mantel–Haenszel (CMH) adjustments using PLINK18, 22, which allows allele and disease frequencies to vary among study populations (treating the discovery and replication phases of the study as separate strata); and ii) the genotype data and correction for population substructure. The results of these two methods were so similar (Table 1) that we chose (ii) for the main analysis, since there was no strong rationale (e.g. population origin) for treating the two sets as separate strata. Further details on the analytic strategy can be found in the Supplementary Materials.
Table 1.
Summary of top association results from GWAS in EOMG
| rs number | Gene | Chra | bpa | Allele Minor/Major | MAF Caseb | MAF Cntlb. | Discovery | Replicate | Combined | Meta-Analysis | 95% CI | ||||
|---|---|---|---|---|---|---|---|---|---|---|---|---|---|---|---|
|
| |||||||||||||||
| p valuec | ORc | p value | OR | p value | OR | p value | OR | ||||||||
| rs2476601 | PTPN22 | 1 | 114089610 | A/G | 0.17 | 0.11 | 6.50E-09 | 1.90 | 6.24E-03 | 1.48 | 8.16E-10 | 1.71 | 3.72E-10 | 1.71 | 1.44–2.02 |
| rs2233287 | TNIP1 | 5 | 150420290 | A/G | 0.14 | 0.09 | 4.41E-06 | 1.74 | 3.85E-04 | 1.76 | 4.55E-09 | 1.76 | 3.52E-09 | 1.73 | 1.44–2.08 |
| rs4958881 | TNIP1 | 5 | 150430429 | G/A | 0.18 | 0.11 | 1.22E-05 | 1.63 | 7.68E-06 | 1.89 | 3.21E-10 | 1.73 | 2.55E-10 | 1.71 | 1.44–2.02 |
| Other Candidate Autoimmune Susceptibility Genesd | |||||||||||||||
| rs6752770 | STAT4 | 2 | 191681808 | G/A | 0.34 | 0.29 | 1.26E-02 | 1.24 | 6.36E-03 | 1.33 | 4.22E-04 | 1.27 | 5.17E-04 | 1.26 | 1.11–1.43 |
| rs1026421 | IKZF1 | 7 | 50291272 | G/A | 0.29 | 0.34 | 4.63E-03 | 0.78 | 4.70E-02 | 0.80 | 4.38E-04 | 0.79 | 3.46E-04 | 0.79 | 0.69–0.90 |
| rs729302 | IRF5 | 7 | 128356196 | C/A | 0.27 | 0.33 | 1.24E-03 | 0.75 | 5.17E-03 | 0.73 | 2.32E-05 | 0.74 | 2.45E-05 | 0.75 | 0.65–0.86 |
| rs11190140 | NKX2-3 | 10 | 101281583 | A/G | 0.52 | 0.47 | 7.87E-04 | 1.31 | 1.88E-01 | 1.14 | 4.44E-04 | 1.25 | 4.61E-04 | 1.24 | 1.10–1.40 |
| rs9303277 | ORMDL3 | 17 | 35229995 | G/A | 0.42 | 0.48 | 3.42E-02 | 0.84 | 4.14E-05 | 0.66 | 1.48E-05 | 0.76 | 1.25E-05 | 0.76 | 0.67–0.86 |
| rs1790588 | CD226 | 18 | 65686164 | G/A | 0.54 | 0.48 | 7.12E-04 | 0.76 | 1.96E-01 | 1.14 | 4.92E-04 | 1.24 | 3.97E-04 | 1.25 | 1.10–1.41 |
| rs2431697 | PTTG1 | 5 | 159812556 | G/A | 0.37 | 0.43 | 4.00E-04 | 0.75 | 1.18E-02 | 0.77 | 1.43E-05 | 0.76 | 1.38E-05 | 0.76 | 0.64–0.8 |
The chromosome (Chr) and base-pair (bp) position (HG18) are shown.
Minor allele frequency (MAF) for cases and controls (Cntl) for the combined Discovery and Replication datasets.
The p value and odds ratio (OR) were determined using an additive model including covariates for gender and principal components (see Methods). For the combined analyses the Discovery and Replication datasets were combined and adjusted for the covariates and for the Meta-Analysis, Cochran-Mantel-Haenzel adjustments were used to combine the datasets.
See Supplementary Table 5 for comparisons of these genes in different autoimmune disease.
Attributable Risk Calculations
The percent population attributable risk (PAR) was estimated for each individual locus: PAR = Σpi × (ORi − 1)/(Σpi × (ORi − 1) + 1), in which pi is the prevalence of risk allele at ith locus among control subjects, and ORi is OR of risk allele at ith locus. The joint PAR was calculated using the individual PAR for each of the associated SNPs: 1 − Π (1 − PARi) in which PARi is the individual PAR for each associated SNP.
Imputation of HLA determinants and Conditional Association Tests in the MHC
To impute HLA determinants, we utilized a separate reference dataset collected by the Type 1 Diabetes Genetics Consortium (T1DGC). The Beagle software package23 was used for imputation in our dataset and only SNPs with posterior probabilities of >0.90 were included in our final analyses. SNPTEST V2.024 (see web resources) was used for the primary association analyses for the imputed genotypes, as well as for conditional analyses across the MHC, as described in the Supplementary Materials.
Results
Figure 1 shows a Manhattan plot of the GWAS results for the combined analysis using 649 EOMG cases matched with 2596 controls (λgc = 1.046). As expected, the strongest association was within the MHC – at rs7750641 (p = 1.2 × 10−92, OR = 6.25 (95% CI 4.89 – 6.85). The full results for the MHC region are given in Supplementary Table 2. Two additional loci outside the MHC achieved genome-wide levels of significance for association (Fig. 1 and Table 1): PTPN22 (rs2476601, OR = 1.71, p = 8.2 × 10⁻¹⁰), and an equally strong association with TNFAIP3-interacting protein 1 (TNIP1; rs4958881 OR = 1.73, p = 3.2 × 10⁻¹⁰). We also examined selected validated SNPs showing associations in other major PTPN22-associated autoimmune diseases25–27; seven candidate gene regions achieved p<5 ×10⁻⁴ in the combined analysis (Table 1), consistent with the increased frequencies of other autoimmune disorders in EOMG patients and blood relatives28. Notably, TNFAIP3, a binding partner of TNIP1, did not show significant evidence of association or interaction with TNIP1 (data not shown).
Figure 1.
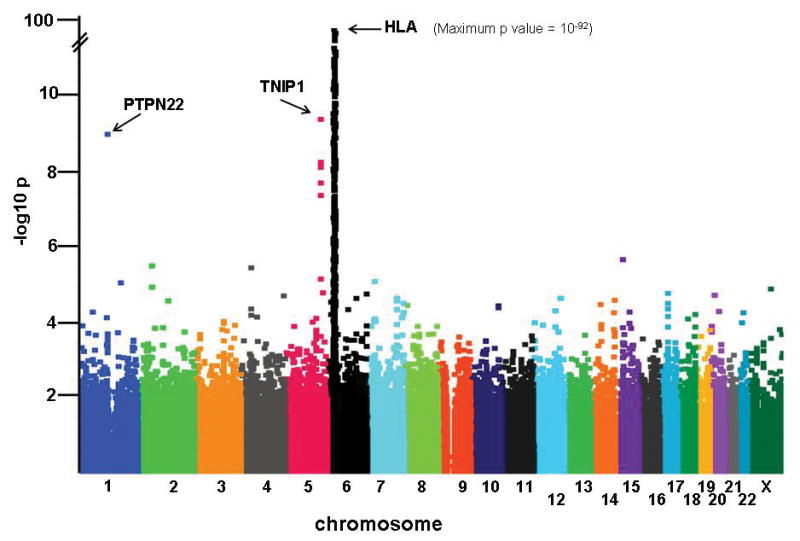
Manhattan plot of association signals in early-onset myasthenia gravis (EOMG). The strength of association (-log10 p values; ordinate) is plotted against the position on each chromosome in base pairs (abscissa). Details of markers achieving p <5 × 10⁻⁴ are provided in Supplementary Table 2.
Imputation and conditional analysis in the region around TNIP1 using ImputeV2.0 and SNPTEST v2 24 revealed an association with rs2233290, a variant encoding a non-conservative 151Pro→Ala in TNIP1 (Fig. 2, and Supplementary Table 3). The minor allele of rs223290, imputed based on 1,000 Genomes Project data (posterior probability = 0.96), also showed a strong association with EOMG (OR = 1.92, 95%CI: 1.54 – 2.38, p = 3.4 ×10⁻⁹). Controlling for rs2233290 showed only modest evidence (p>1 × 10⁻⁴) for residual signals at this locus (Fig. 2b).
Figure 2.

TNIP1 association signals in EOMG. Association signals were examined after inclusion of imputation results using 1000 Genome sequencing data and the genotyped SNPs (diamond symbols) and imputed SNPs (circles) are shown. The ordinate shows the strength of the association signals, with the position on chromosome 5 shown in Mb (HG18 map) along the abscissa. The p value for each SNP is shown before (a) and after conditioning with rs2233290 (b), a SNP that encodes a 151Pro→Ala change. The color-coded symbols correspond to the strength of linkage disequilibrium (r2), showing the most significant associated SNP (rs1559127) as a blue circle. See Supplementary Materials for imputation methods and details for imputed SNPs and results (Supplementary Table 3).
We next used a comprehensive imputation approach17 to enable association testing of HLA alleles across the MHC region. For this association testing, we used the probabilities for each genotype (including only variants with an average posterior probability >0.9), together with covariates for sex and the top five principal components, to correct for population substructure. Using this dataset, the most significant association was for HLA-B*08 (p = 2.87 × 10−113, see Fig. 3a), with OR = 6.41 (95%CI 5.46 – 7.53). After conditioning on HLA-B*08, the other signals dropped over 10-fold in significance, leaving some modest residual associations around HLA-B as well as in the class II region (Fig. 3b).
Figure 3.

Analysis of the HLA region association signals in EOMG. In each panel, the symbols show the strength of the association signal (ordinate) for this region of chromosome 6 shown in Mb (HG18) along the abscissa; the SNPs and HLA determinants are given color-coded symbols as described in Figure 2. For a, the −Log10 p value before conditioning is shown. For b–d the −Log10 p values are shown after conditioning on the indicated HLA determinant(s). See Supplementary Materials for methods and additional conditioning studies (Supplementary Table 4, Fig. S1).
Notably, the signal at HLA-DRB1*0301, prior to conditioning on HLA-B*08, was substantially weaker (DRB1*0301, p = 9.7 × 10−74 vs. HLA-B*08, 2.87 × 10−113). In addition, conditioning on this association only reduced the HLA-B*08 signal to p = 4.7 × 10−45 (Fig. 3c) whereas conditioning on B*08 completely eliminated the DRB1*0301 signal. Similarly for the HLA class III region (between HLA-B and HLA-DR), the signal was substantially lower than that of HLA-B*08 (Fig. 3a); it also lost all significance after conditioning on HLA-B*08 (Fig. 3b).
Further conditioning on all HLA-B alleles that showed associations in the unconditioned analysis (P<0.01) substantially eliminated residual evidence of other associations in the MHC class I region (p> 1 ×10⁻⁶), but left a significant residual signal (p<5 × 10⁻⁸) in the class II region (Fig. 3d). Most of these remaining signals were due to DRB1*16 (predisposing) and DRB1*0701 (protective), consistent with previous studies reporting modest positive and negative associations with these alleles in MG with thymic hyperplasia5. Further conditioning on these alleles, as well as for a minor effect observed at HLA-A*3101, eliminated all significant association in the region (Supplementary Fig. 1 and Supplementary Table 4). Notably, the HLA-DR*0301 allele of the 8.1 haplotype no longer contributed signals at DRB1 – which is consistent with previous reports that HLA-DRB1*03 is rarely a restricting element for AChR-specific T-cells7, and may in fact reduce the risk of high titers of anti-AChR antibodies13.
We saw no clear signs of interactions between the predisposing PTPN22, TNIP1 and HLA alleles. However, since a previous report suggested a possible interaction between sex and HLA genotype12, we examined evidence for this in our larger dataset. As shown in Table 2, we confirmed a stronger association of HLA-B8 with EOMG in females (OR= 6.92; 95% CI 4.28–5.91) compared with males (OR 3.55; 95% CI 2.46–4.56), which is significantly different when a direct comparison is made between the two groups (P<0.0001).
Table 2.
Effect of Gender on EOMG Associations
| gendera | locus | marker | ORb | OR 95% CI | p-value | gender pc |
|---|---|---|---|---|---|---|
| Female | PTPN22 | rs2476601 | 1.72 | 1.42 – 2.10 | 6.02E-08 | 0.93 |
| Male | 1.71 | 1.16 – 2.51 | 6.46E-03 | |||
|
| ||||||
| Female | TNIP1 | rs4958881 | 1.73 | 1.42 – 2.12 | 6.77E-08 | 0.76 |
| Male | 1.80 | 1.23 – 2.62 | 2.50E-03 | |||
|
| ||||||
| Female | MHC | HLA_B*08 | 6.92 | 4.28 – 5.91 | 8.48E-96 | <0.0001 |
| Male | 3.55 | 2.46 – 4.56 | 1.89E-13 | |||
The number of female cases was 538 and the number of male cases was 111. The female and male analyses were matched 3:1 and 8:1with controls, respectively. All analyses were controlled for population substructure as in the main analyses.
OR, odds ratio.
The p-valuefor gender difference was calculated using an unpaired T test.
Discussion
Our GWAS analysis of EOMG has yielded two observations of particular interest, spotlighting, for the first time, an association with a non-synonymous change in TNIP1 – with an effect size that rivals PTPN22 – and convincingly localizing the major MHC association to the class I HLA-B locus. As is typical of most genetic associations with autoimmune diseases9, these risk alleles are quite common in the population, with carrier rates in patients of 62.1% (vs 20.3% in controls) for HLA-B*08 and 27.0% (vs 16.9%) for TNIP1 151Ala. Both of these findings have implications for understanding the immuno-pathogenesis of EOMG.
TNIP1 (also known as A20-binding inhibitor of NF-κB1, or ABIN1) is a member of a family of related molecules with a common ubiquitin-binding domain and other shared domains involved in interactions with TNFAIP3 and NEMO as well some other members of the NFκB family29. Like TNFAIP3 (also designated A20), TNIP1 has inhibitory activities, and its over-expression reduces the NF-κB1 activation induced by TNF, IL-1 and LPS29. Knock-out animals usually die in utero or shortly after birth from uncontrolled apoptotic cell death30. Interestingly, mice with a knock-in mutation disrupting the ubiquitin-binding domain of TNIP1 showed autoimmune features including elevated immunoglobulin levels, anti-dsDNA autoantibodies, and glomerulonephritis31. These immunological abnormalities are primarily in B-cells and myeloid cells, not T-cells, with prominent hyperactivation through TLR4 and TLR2/6 pathways as well as through the B-cell receptor and CD4031. Interestingly, a recent report suggests that TNIP1 may also act through pathways that converge on the transcription factor C/EBPb, which appear to be independent of TNFAIP3 regulation32. This may be particularly relevant given the lack of association with TNFAIP3 with EOMG.
The 151Pro→Ala change in TNIP1 is not located within any of the known ubiquitin-binding or protein interaction domains. However, the 151Pro is highly conserved across species, and both PolyPhen-233 (Score = 0.98) and other algorithms based on protein structural stability predict that the Ala replacement is deleterious34. These data thus implicate the TNIP1 151Ala replacement itself in EOMG pathogenesis, although without direct functional data, this remains a hypothesis to be proven. The substantial prevalence of this variant in northern Europeans (carrier rate ~16%) should facilitate future detailed studies of its immune functions in healthy carriers, analogous to those recently reported for PTPN2235. Notably, several markers in strong linkage disequilibrium (LD) with rs2233290 show associations in systemic lupus erythematosus36 and systemic sclerosis37, while those in psoriasis are with SNPs that clearly do not involve this haplotype38, suggesting a distinct functional role for TNIP1 in the latter disease.
In addition to the involvement of TNIP1, our data argue strongly that the major MHC associations in EOMG are with the classical class I allele HLA-B*08 itself, and to a much lesser extent with selected alleles at HLA-DRB1. Of note, DRB1*07 provides a protective effect as shown previously5, further emphasizing the complex relationships between HLA and EOMG. Further, we cannot definitively exclude additional contributions from other MHC loci, such as HLA-C. Indeed, after conditioning on HLA-B*08, further conditioning on selected HLA-C alleles gives a rather similar result to the addition of full HLA-B conditioning (Supplementary Fig 1b), emphasizing the challenges of analyzing genomic regions with strong LD. However, the major effect of HLA-B*08 itself cannot be parsimoniously explained by other alleles, either alone or in combination, e.g., at the HLA-C locus or, for that matter, HLA-DRB1 and other HLA classical alleles.
Interestingly, we have observed a striking difference in risk for HLA-B8 when comparing female and male patients with MG, confirming previous observations12. This interaction between sex and HLA risk has been observed in other autoimmune disorders, most recently in SLE39, but with much less dramatic differences than seen in MG. In the case of SLE, increased risk with HLA was found in males, not females as we have reported here. Our findings in MG may reflect hormonal effects, a female bias in environmental exposure or gender related epigenetic changes as playing a role in disease risk. Interestingly, we did not find any association with the estrogen receptor alpha (ESRRA) in either the entire subject set or in females alone (p > 0.05 for all SNPS +/− 200 kb) although this gene has been suggested as a possible candidate for EOMG based on expression studies40.
The highly mutated high affinity IgG autoantibody responses in EOMG, which must be T-cell-dependent, might predict stronger associations with HLA class II than class I alleles, as noted in autoimmune thyroid disease with HLA-DR3 and other class II alleles41, and also in SLE15, 42. Although multiple immunoregulatory abnormalities have been mapped to the conserved 8.1 haplotype14 that contains both the DR3 and HLA-B*08 alleles, the causative locus (or loci) have not yet been clearly defined for any disease and almost certainly differ for different autoimmune phenotypes. In earlier reports, the HLA associations in EOMG have been stronger with the region including HLA class III and HLA-B*08 than with DR36,12, 13. With our much higher combined patient numbers and marker densities, as well as the newly available imputation methods and reference databases, B*08 now clearly emerges as the major risk allele in the MHC.
These novel findings demand a renewed focus on potential roles of the HLA-B*08 molecule itself in EOMG pathogenesis. We have previously hypothesized7, 12, 43 that HLA-B8-restricted cytotoxic T-cells could (a) be primed by AChR subunits expressed by the hyperplastic thymic epithelial cells in EOMG, and then (b) attack rare thymic myoid cells that express intact AChR, the only cells outside muscle to do so43. The resulting damage would lead to (c) the nearby germinal center responses, and thus to diversification of the ensuing autoantibodies so that they characteristically recognize the intact AChR in its native conformation. The current findings suggest that a search for HLA-B*08-restricted T-cells specific for likely autoimmunizing AChR epitopes44 would be a rational approach to extending this line of inquiry.
These data point to the continuing value of applying GWAS analysis to even modest-sized datasets of uncommon but well-defined complex autoimmune phenotypes. For many antibody-mediated autoimmune disorders, PTPN22 is the strongest non-MHC genetic risk factor45, and appears to be mediated by an amino acid change R620W encoded by rs2476601, although the precise mechanisms underlying this association remain controversial46, 47. Indeed, we confirmed that signals from all other marginally associated markers in PTPN22 were completely eliminated after conditioning on rs2476601 (data not shown). The similar effect sizes of the associations of EOMG with both TNIP1 and PTPN22 are striking. In addition, the identification of a putative functional amino acid change in the TNIP1 protein is a novel finding and illustrates the power of combining imputation with GWAS data. It will be important to investigate the genotype-phenotype correlations with this TNIP1 variant as well as other genes in the ubiquitin and NF-κB pathways that are likely to contribute to the pathogenesis of autoimmune disorders. Indeed, several additional genes involved in binding to, or enzymatic modification of, ubiquitin have recently shown associations with human autoimmunity in GWAS studies9.
Previous studies have identified promoter polymorphisms at the nicotinic cholinergic receptor alpha 1 (CHRNA1) locus were specifically associated with very early age of onset (before age 20) of EOMG, and also interacted with AIRE10. Although our EOMG GWAS showed no association signal at the CHRNA1 (p > 0.05 for all SNPS +/− 200 kb) we did note nominal significance for very early age onset EOMG (162 cases with age of onset < age 20; p=0.038) for rs2646165, the only SNP on our genotyping arrays that captures the relevant promoter haplotype.
Notably, the three loci mapped here account for a large fraction of the genetic risk for EOMG. For B*08, PTPN22 and TNIP1, the population attributable risks (PAR) were 52.3%, 12.6%, and 11.0%, respectively – or 62.9% overall. Nevertheless, the limited statistical power must have precluded detection of numerous weaker associations. For high-frequency alleles (e.g. 0.4), our study had >80% power to detect loci with modest ORs (1.2) in additive models, whereas, for lower-frequency susceptibility alleles (e.g. 0.1), that could only be achieved where ORs were substantially higher (>1.7). Since most predisposing loci detected in GWAS in autoimmune diseases have modest effect sizes, further larger studies are clearly essential for complete analyses of EOMG genetics.
Supplementary Material
Acknowledgments
This work was supported by a grant from the National Institutes of Health to PKG (NIH/NIAID RO1-AI-68759) and grants from the Palle Ferb Foundation and the Swedish Research Council (LH and QPH), and the UK Medical Research Council (NW). We are grateful to the many Norwegian neurologists who have contributed to the collection of Norwegian MG samples, which was funded through grants from Norwegian Health Authorities South East. Norwegian controls were provided by the Norwegian Bone Marrow Registry. The Dutch contribution to this work was partly supported by a grant from the Prinses Beatrix Fonds; we also thank E. Bakker in the Department of Human Genetics, Leiden University Medical Center, the Myasthenia Gravis Association in the UK, and the many patients and their physicians in the UK who generously participated in this study.
Abbreviations
- AChR
acetylcholine receptor
- EOMG
early-onset myasthenia gravis
- GWAS
genome-wide association study
- HLA
human leukocyte antigen
- LPS
lipo-polysaccharide
- MHC
major histocompatibility complex
- PCA
principal components analysis
- PTPN22
Protein tyrosine phosphatase, non-receptor type 22
- SLE
systemic lupus erythematosus
- TLR
toll-like receptor
- TNF
tumor necrosis factor
- TNIP1
TNFAIP3-interacting protein 1
- SNP
single nucleotide polymorphism
References
- 1.Meriggioli MN, Sanders DB. Autoimmune myasthenia gravis: emerging clinical and biological heterogeneity. Lancet Neurology. 2009 May;8(5):475–90. doi: 10.1016/S1474-4422(09)70063-8. [DOI] [PMC free article] [PubMed] [Google Scholar]
- 2.Vincent A, Palace J, Hilton-Jones D. Myasthenia gravis. Lancet. 2001 Jun 30;357(9274):2122–8. doi: 10.1016/S0140-6736(00)05186-2. [DOI] [PubMed] [Google Scholar]
- 3.Mantegazza R, Bonanno S, Camera G, Antozzi C. Current and emerging therapies for the treatment of myasthenia gravis. Neuropsychiatric Disease and Treatment. 2011;7:151–60. doi: 10.2147/NDT.S8915. [DOI] [PMC free article] [PubMed] [Google Scholar]
- 4.Carr AS, Cardwell CR, McCarron PO, McConville J. A systematic review of population based epidemiological studies in Myasthenia Gravis. BMC Neurol. 2010;10:46. doi: 10.1186/1471-2377-10-46. [DOI] [PMC free article] [PubMed] [Google Scholar]
- 5.Giraud M, Beaurain G, Yamamoto AM, et al. Linkage of HLA to myasthenia gravis and genetic heterogeneity depending on anti-titin antibodies. Neurology. 2001 Nov 13;57(9):1555–60. doi: 10.1212/wnl.57.9.1555. [DOI] [PubMed] [Google Scholar]
- 6.Marx A, Willcox N, Leite MI, et al. Thymoma and paraneoplastic myasthenia gravis. Autoimmunity. 2010 Aug;43(5–6):413–27. doi: 10.3109/08916930903555935. [DOI] [PubMed] [Google Scholar]
- 7.Beeson D, Bond AP, Corlett L, et al. Thymus, thymoma, and specific T cells in myasthenia gravis. Annals of the New York Academy of Sciences. 1998 May 13;841:371–87. doi: 10.1111/j.1749-6632.1998.tb10950.x. [DOI] [PubMed] [Google Scholar]
- 8.Vandiedonck C, Capdevielle C, Giraud M, et al. Association of the PTPN22*R620W polymorphism with autoimmune myasthenia gravis. Ann Neurol. 2006 Feb;59(2):404–7. doi: 10.1002/ana.20751. [DOI] [PubMed] [Google Scholar]
- 9.Cho JH, Gregersen PK. Genomics and the multifactorial nature of human autoimmune disease. The New England Journal of Medicine. 2011 Oct 27;365(17):1612–23. doi: 10.1056/NEJMra1100030. [DOI] [PubMed] [Google Scholar]
- 10.Giraud M, Taubert R, Vandiedonck C, et al. An IRF8-binding promoter variant and AIRE control CHRNA1 promiscuous expression in thymus. Nature. 2007 Aug 23;448(7156):934–7. doi: 10.1038/nature06066. [DOI] [PubMed] [Google Scholar]
- 11.Pirskanen R. Genetic associations between myasthenia gravis and the HL-A system. J Neurol Neurosurg Psychiatry. 1976 Jan;39(1):23–33. doi: 10.1136/jnnp.39.1.23. [DOI] [PMC free article] [PubMed] [Google Scholar]
- 12.Janer M, Cowland A, Picard J, et al. A susceptibility region for myasthenia gravis extending into the HLA-class I sector telomeric to HLA-C. Hum Immunol. 1999 Sep;60(9):909–17. doi: 10.1016/s0198-8859(99)00062-2. [DOI] [PubMed] [Google Scholar]
- 13.Vandiedonck C, Beaurain G, Giraud M, et al. Pleiotropic effects of the 8.1 HLA haplotype in patients with autoimmune myasthenia gravis and thymus hyperplasia. Proc Natl Acad Sci U S A. 2004 Oct 26;101(43):15464–9. doi: 10.1073/pnas.0406756101. [DOI] [PMC free article] [PubMed] [Google Scholar]
- 14.Price P, Witt C, Allcock R, et al. The genetic basis for the association of the 8.1 ancestral haplotype (A1, B8, DR3) with multiple immunopathological diseases. Immunol Rev. 1999;167:257–74. doi: 10.1111/j.1600-065x.1999.tb01398.x. [DOI] [PubMed] [Google Scholar]
- 15.Graham RR, Ortmann WA, Langefeld CD, et al. Visualizing human leukocyte antigen class II risk haplotypes in human systemic lupus erythematosus. Am J Hum Genet. 2002 Sep;71(3):543–53. doi: 10.1086/342290. [DOI] [PMC free article] [PubMed] [Google Scholar]
- 16.Rioux JD, Goyette P, Vyse TJ, et al. Mapping of multiple susceptibility variants within the MHC region for 7 immune-mediated diseases. Proc Natl Acad Sci U S A. 2009 Nov 3;106(44):18680–5. doi: 10.1073/pnas.0909307106. [DOI] [PMC free article] [PubMed] [Google Scholar]
- 17.Pereyra F, Jia X, McLaren PJ, et al. The major genetic determinants of HIV-1 control affect HLA class I peptide presentation. Science. 2010 Dec 10;330(6010):1551–7. doi: 10.1126/science.1195271. [DOI] [PMC free article] [PubMed] [Google Scholar]
- 18.Purcell S, Neale B, Todd-Brown K, et al. PLINK: a tool set for whole-genome association and population-based linkage analyses. Am J Hum Genet. 2007 Sep;81(3):559–75. doi: 10.1086/519795. [DOI] [PMC free article] [PubMed] [Google Scholar]
- 19.Pritchard JK, Stephens M, Donnelly P. Inference of population structure using multilocus genotype data. Genetics. 2000 Jun;155(2):945–59. doi: 10.1093/genetics/155.2.945. [DOI] [PMC free article] [PubMed] [Google Scholar]
- 20.Falush D, Stephens M, Pritchard JK. Inference of population structure using multilocus genotype data: linked loci and correlated allele frequencies. Genetics. 2003 Aug;164(4):1567–87. doi: 10.1093/genetics/164.4.1567. [DOI] [PMC free article] [PubMed] [Google Scholar]
- 21.Kosoy R, Nassir R, Tian C, et al. Ancestry informative marker sets for determining continental origin and admixture proportions in common populations in America. Human Mutation. 2009 Jan;30(1):69–78. doi: 10.1002/humu.20822. [DOI] [PMC free article] [PubMed] [Google Scholar]
- 22.Frazer KA, Ballinger DG, Cox DR, et al. A second generation human haplotype map of over 3.1 million SNPs. Nature. 2007 Oct 18;449(7164):851–61. doi: 10.1038/nature06258. [DOI] [PMC free article] [PubMed] [Google Scholar]
- 23.Browning BL, Browning SR. A unified approach to genotype imputation and haplotype-phase inference for large data sets of trios and unrelated individuals. Am J Hum Genet. 2009 Feb;84(2):210–23. doi: 10.1016/j.ajhg.2009.01.005. [DOI] [PMC free article] [PubMed] [Google Scholar]
- 24.Marchini J, Howie B. Genotype imputation for genome-wide association studies. Nat Rev Genet. 2010 Jun 2;11(7):499–511. doi: 10.1038/nrg2796. [DOI] [PubMed] [Google Scholar]
- 25.Barrett JC, Clayton DG, Concannon P, et al. Genome-wide association study and meta-analysis find that over 40 loci affect risk of type 1 diabetes. Nat Genet. 2009 May 10; doi: 10.1038/ng.381. [DOI] [PMC free article] [PubMed] [Google Scholar]
- 26.Flesher DL, Sun X, Behrens TW, Graham RR, Criswell LA. Recent advances in the genetics of systemic lupus erythematosus. Expert Review of Clinical Immunology. 2010 May;6(3):461–79. doi: 10.1586/eci.10.8. [DOI] [PMC free article] [PubMed] [Google Scholar]
- 27.Stahl EA, Raychaudhuri S, Remmers EF, et al. Genome-wide association study meta-analysis identifies seven new rheumatoid arthritis risk loci. Nat Genet. 2010 Jun;42(6):508–14. doi: 10.1038/ng.582. [DOI] [PMC free article] [PubMed] [Google Scholar]
- 28.Mao ZF, Yang LX, Mo XA, et al. Frequency of autoimmune diseases in myasthenia gravis: a systematic review. The International Journal of Neuroscience. Mar;121(3):121–9. doi: 10.3109/00207454.2010.539307. [DOI] [PubMed] [Google Scholar]
- 29.Verstrepen L, Carpentier I, Verhelst K, Beyaert R. ABINs: A20 binding inhibitors of NF-kappa B and apoptosis signaling. Biochemical Pharmacology. 2009 Jul 15;78(2):105–14. doi: 10.1016/j.bcp.2009.02.009. [DOI] [PubMed] [Google Scholar]
- 30.Oshima S, Turer EE, Callahan JA, et al. ABIN-1 is a ubiquitin sensor that restricts cell death and sustains embryonic development. Nature. 2009 Feb 12;457(7231):906–9. doi: 10.1038/nature07575. [DOI] [PMC free article] [PubMed] [Google Scholar]
- 31.Nanda SK, Venigalla RK, Ordureau A, et al. Polyubiquitin binding to ABIN1 is required to prevent autoimmunity. J Exp Med. 208(6):1215–28. doi: 10.1084/jem.20102177. [DOI] [PMC free article] [PubMed] [Google Scholar]
- 32.Zhou J, Wu R, High AA, et al. A20-binding inhibitor of NF-kappaB (ABIN1) controls Toll-like receptor-mediated CCAAT/enhancer-binding protein beta activation and protects from inflammatory disease. Proc Natl Acad Sci U S A. 2011 Nov 1;108(44):E998–1006. doi: 10.1073/pnas.1106232108. [DOI] [PMC free article] [PubMed] [Google Scholar]
- 33.Adzhubei IA, Schmidt S, Peshkin L, et al. A method and server for predicting damaging missense mutations. Nature Methods. Apr;7(4):248–9. doi: 10.1038/nmeth0410-248. [DOI] [PMC free article] [PubMed] [Google Scholar]
- 34.Yue P, Melamud E, Moult J. SNPs3D: candidate gene and SNP selection for association studies. BMC Bioinformatics. 2006;7:166. doi: 10.1186/1471-2105-7-166. [DOI] [PMC free article] [PubMed] [Google Scholar]
- 35.Menard L, Saadoun D, Isnardi I, et al. The PTPN22 allele encoding an R620W variant interferes with the removal of developing autoreactive B cells in humans. J Clin Invest. 2011;121:3635–3644. doi: 10.1172/JCI45790. [DOI] [PMC free article] [PubMed] [Google Scholar]
- 36.Gateva V, Sandling JK, Hom G, et al. A large-scale replication study identifies TNIP1, PRDM1, JAZF1, UHRF1BP1 and IL10 as risk loci for systemic lupus erythematosus. Nat Genet. 2009 Nov;41(11):1228–33. doi: 10.1038/ng.468. [DOI] [PMC free article] [PubMed] [Google Scholar]
- 37.Allanore Y, Saad M, Dieude P, et al. Genome-wide scan identifies TNIP1, PSORS1C1, and RHOB as novel risk loci for systemic sclerosis. PLoS Genet. 2011 Jul;7(7):e1002091. doi: 10.1371/journal.pgen.1002091. [DOI] [PMC free article] [PubMed] [Google Scholar]
- 38.Bowes J, Orozco G, Flynn E, et al. Confirmation of TNIP1 and IL23A as susceptibility loci for psoriatic arthritis. Ann Rheum Dis. 2011 Sep;70(9):1641–4. doi: 10.1136/ard.2011.150102. [DOI] [PMC free article] [PubMed] [Google Scholar]
- 39.Hughes T, Adler A, Merrill JT, et al. Analysis of autosomal genes reveals gene-sex interactions and higher total genetic risk in men with systemic lupus erythematosus. Ann Rheum Dis. 2011;71:694–9. doi: 10.1136/annrheumdis-2011-200385. [DOI] [PMC free article] [PubMed] [Google Scholar]
- 40.Nancy P, Berrih-Aknin S. Differential estrogen receptor expression in autoimmune myasthenia gravis. Endocrinology. 2005 May;146(5):2345–53. doi: 10.1210/en.2004-1003. [DOI] [PMC free article] [PubMed] [Google Scholar]
- 41.Zeitlin AA, Heward JM, Newby PR, et al. Analysis of HLA class II genes in Hashimoto’s thyroiditis reveals differences compared to Graves’ disease. Genes Immun. 2008 Jun;9(4):358–63. doi: 10.1038/gene.2008.26. [DOI] [PubMed] [Google Scholar]
- 42.Graham RR, Ortmann W, Rodine P, et al. Specific combinations of HLA-DR2 and DR3 class II haplotypes contribute graded risk for disease susceptibility and autoantibodies in human SLE. Eur J Hum Genet. 2007;15:823–30. doi: 10.1038/sj.ejhg.5201827. [DOI] [PubMed] [Google Scholar]
- 43.Willcox N, Leite MI, Kadota Y, et al. Autoimmunizing mechanisms in thymoma and thymus. Annals of the New York Academy of Sciences. 2008;1132:163–73. doi: 10.1196/annals.1405.021. [DOI] [PubMed] [Google Scholar]
- 44.Maclennan CA, Vincent A, Marx A, et al. Preferential expression of AChR epsilon-subunit in thymomas from patients with myasthenia gravis. J Neuroimmunol. 2008 Sep 15;201–202:28–32. doi: 10.1016/j.jneuroim.2008.06.016. [DOI] [PubMed] [Google Scholar]
- 45.Gregersen PK, Olsson LM. Recent advances in the genetics of autoimmune disease. Annual Review of Immunology. 2009;27:363–91. doi: 10.1146/annurev.immunol.021908.132653. [DOI] [PMC free article] [PubMed] [Google Scholar]
- 46.Zhang J, Zahir N, Jiang Q, et al. The autoimmune disease-associated PTPN22 variant promotes calpain-mediated Lyp/Pep degradation associated with lymphocyte and dendritic cell hyperresponsiveness. Nat Genet. 2011 Sep;43(9):902–7. doi: 10.1038/ng.904. [DOI] [PubMed] [Google Scholar]
- 47.Vang T, Liu WH, Delacroix L, et al. LYP inhibits T-cell activation when dissociated from CSK. Nat Chem Biol. 2012;8(5):437–46. doi: 10.1038/nchembio.916. [DOI] [PMC free article] [PubMed] [Google Scholar]
Associated Data
This section collects any data citations, data availability statements, or supplementary materials included in this article.