

Abstract
Staphylococcus aureus is a leading cause of nosocomial and community-acquired infections and increased prevalence of antibiotic resistance has necessitated the search for novel therapeutic targets. The immunodominant surface antigen B induces an antibody response during septicemia and has therefore been proposed as a vaccine target. Because it appears to be expressed during infection but not during colonization, we sought to characterize the regulation of isaB expression by internal transcription factors and external stimuli. We found that expression of isaB was stimulated by glucose, human serum, and plasma. Furthermore isaB transcript levels increased in the absence of the global staphylococcal accessory regulator SarA and decreased in the absence of the carbon catabolite regulator CcpA. Interestingly, glucose and CcpA-mediated isaB expression appeared to be related to the decrease in pH subsequent to carbon metabolism, rather than a direct response to the carbon source and could be prevented by buffering the growth medium.
Keywords: Staphylococcus aureus, transcription, vaccine, virulence
INTRODUCTION
Staphylococcus aureus is an important opportunistic pathogen, causing significant morbidity and mortality on a global scale and is a leading cause of nosocomial infections. Antibiotic resistance is a mounting clinical problem and methicillin resistant S. aureus (MRSA) infections surpass AIDS as a cause of death in the United States (Gorwitz et al., 2006). In order to find new therapeutic targets to treat or prevent infections with antibiotic-resistant S. aureus it is essential to identify virulence factors important in infection and to understand their regulation. The immunodominant antigen B (IsaB) was shown by Lorenz et al to be immunogenic during septicemia suggesting that it may be a target for vaccine therapy (Lorenz et al., 2000a). In an effort to characterize its function, we have demonstrated that IsaB is a secreted and partially surface-associated protein and that has the ability to bind extracellular nucleic acids (Mackey-Lawrence et al., 2009).
Little is known about the regulation of isaB. The finding that anti-IsaB antibodies are produced during septicemia but not during colonization suggests that expression of IsaB is controlled in such a way that it is only expressed during infection (Lorenz et al., 2000b). Reports of global transcript analysis, suggest that isaB expression is induced in response to neutrophil exposure, in biofilms, under anaerobic conditions, and following internalization in human epithelial cells, again, suggesting a role in immune evasion and virulence (Fuchs et al., 2007; Garzoni et al., 2007; Resch et al., 2005; Voyich et al., 2005). Virulence factor regulation in S. aureus is carefully orchestrated by 3 sigma factors, 16 two-component systems, a quorum sensing system, and a large repository of transcriptional regulators (George and Muir, 2007; Pragman and Schlievert, 2004; Somerville and Proctor, 2009). In this study, we sought to characterize the regulation of isaB in S. aureus by mapping the promoter region and by determining which external stimuli and transcriptional regulators contribute to expression. We found that expression of isaB was induced in response to a simple carbon source such as glucose, however this response was absent in strains lacking the carbon catabolite regulator (CcpA). Furthermore, we found evidence that the CcpA-mediated control and response to glucose were due to acidification of the medium rather than in direct response to the carbon source. Finally it was observed that the staphylococcal accessory regulator A (SarA) is a repressor of isaB expression.
MATERIALS AND METHODS
Strains and growth conditions
Strain 10833 is positive for clumping factor (ATCC 25904), is positive for capsular polysaccharide CP5, and is closely related to the sequenced strain Newman. Strain ALC1342, a derivative of strain RN6390 in which the sarA gene was replaced with an erythromycin resistance cassette by homologous recombination, was kindly provided by Ambrose Cheung, Dartmouth Medical School (Cheung and Manna, 2005). 10833ΔsarA::erm was produced by transducing the mutation from ALC1342 using phage 80α (Kasatiya and Baldwin, 1967). SA113 is closely related to NCTC 8325 and is capsular polysaccharide negative. RN4220 is a restriction deficient laboratory strain from Dr. Richard Novick (Skirball Institute of Molecular Medicine, New York University, NY). The strains were grown at 37 °C on tryptic soy agar plates and liquid cultures were either in Luria Bertani broth (LB) or LB+1% glucose (LBG) overnight with shaking at 200 rpm. For some experiments, overnight S. aureus cultures were diluted 1:100 in human serum or human plasma (MP Biomedicals, Solon, OH). In others, the cultures were diluted 1:100 in LB containing 50mM HEPES pH 7.0. To assess the effect of pH, cultures were diluted 1:100 in 100 mL LB, grown for 2 hr, collected, suspended in 10mL LB pH-adjusted using HCl to pH 4, 5, 6, 7, or 8, and incubated for 30 min prior to RNA extraction or 2 hr prior to Western analysis. E. coli strain CH3-Blue (Bioline, Taunton, MA) was used for cloning and was grown in LB supplemented with 100 μg ampicillin / ml at 37 °C overnight.
RNA Extraction
RNA was purified using the Qiagen RNeasy® mini kit (Qiagen, Valencia, CA) with modifications. Approximately 1 × 10⁹ bacteria were collected and resuspended in 500 μl RLT® lysis buffer (Qiagen) and added to Lysing Matrix B® tubes (MP Biomedicals, Solon, OH). 500 μl Acid Phenol:Choloroform (Ambion, Austin, TX) was added and the samples were processed in a FastPrep-FP120 (MP Biomedicals) two times at a speed setting of 6.0 for 45 seconds (sec), with a 5 minutes (min) incubation on ice in between. Samples were centrifuged at 14,000 rpm for 7 min at 4 °C. The aqueous phase was collected, combined with 500 μl 100% ETOH (Invitrogen, Carlsbad, CA), and the samples were loaded onto RNAeasy columns (Qiagen). RNA was then purified according to manufacturer’s instructions and eluted with 100 μl nuclease-free H20. Contaminating DNA was removed using the TurboDNA-free kit (Ambion) and RNA concentration and purity were determined spectrophotometrically.
Northern Blot Analysis
Northern analysis was performed using the NorthernMax®–Gly Kit (Ambion, Austin, Texas) according to the manufacturer’s instructions. RNA (20 μg) from cultures grown for 6 hr in LBG was added to ULTRAhyb®–Oligo Hybridization Buffer (Ambion). The ULTRAhyb®–Oligo Hybridization Buffer protocol was followed per the manufacturer’s instructions from pre-hybridization until the final washes. IsabNorthern (5′CGTTTTAGCTAATTTAATACCATTGAATTTCACATTATCATACTTAATCGCG3′) was used as the probe. BrightStar®–BioDetect Kit (Ambion) was used following the manufacturer’s instructions for detection and the blots were exposed to autoradiographic film.
Real-Time Reverse Transcriptase PCR
For RT-PCR, 1 μg of RNA was converted into cDNA using Superscript II Reverse Transcriptase kit (Invitrogen, Carlsbad, Ca) in the presence of 1 pM isaBQPCRRev (5′AACGACAAACCAGATGCCTAA3′) and 1 pM 16sQPCRRev (5′TATGCATCGTTGCCTTGGTA3′) following the manufacturer’s instructions. The cDNA and controls lacking reverse transcriptase were diluted 1:10 in ddH2O to detect isaB transcript and 1:1000 to detect 16s transcript. These samples were subjected to real-time RT-PCR using the SensiMix SYBR & Fluorescein kit (Bioline, Randolph, Ma), 1 pM isaBQPCRRev+isaBQPCRFwd (5′GCAAAAGGAAACGAAGCAAG3′) or 16sQPCRRev+16sQPCRFwd (5′GAACCGCATGGTTCAAAAGT3′), and the following cycle conditions: 1 cycle 95 °C for 3 min.; 40 cycles of 10 sec 95 °C, 30 sec 58 °C and 15 sec 72 °C (real-time data collection) followed by a melt-curve. Cycle thresholds from the isaB samples and 16S rRNA samples were used to determine normalized expression (E) of isaB, using the equation E = 1,000 * {2^(16s ct – isaB ct)}. Samples lacking the reverse transcriptase enzyme were assembled as controls to detect contamination of the RNA samples with genomic DNA, and each PCR run included a no template control.
Western analysis
Cells were collected, washed with PBS, resuspended in 100 μL 40mM Tris-Cl containing 100 mM NaCl and 50 μg lysostaphin, and incubated for 1 hr at 37°C. The lysed bacteria were sonicated to sheer DNA, and equal amounts of protein from LB pH 5-8 were analyzed by denaturing PAGE using NuPAGE® 4-12% Bis-Tris gels (Invitrogen) according to manufacturer’s instructions. The proteins were transferred onto a PVDF membrane and the membrane was blocked 1 hr in PBS containing 5% skim milk. The blot was probed with a 1:5,000 dilution of IsaB-specific rabbit antisera in PBS containing 0.05% tween (PBST) and 0.5% skim milk followed by a 1:10,000 fold dilution of horseradish peroxidase conjugated protein A (Sigma-Aldrich, St. Louis, Mo) in PBST. Proteins were detected using the ECL Plus detection system (Amersham).
Deletion of ccpA
We replaced the ccpA gene with an erythromycin resistance cassette (erm) in S. aureus strain RN4220 using the pMAD vector (kindly provided by Michel Débarbouillé and Maryvonne Arnaud Pasteur Institute, Paris, France). The ccpA gene and surrounding sequence were amplified from total DNA from strain 10833 using primers CcpADELFWD (5′GGATCCCCATATGATTTCCAAGGCCTAGG3′) and CcpADELREV (5′GGATCCGAATGGTCAATTTAAGCATATGCACCG3′) and the PCR product was cloned into the pCR4-TOPO vector and transformed into CH3 Blue E. coli. The plasmid was amplified with primers CcpAXhoFWD (5′GGGCTCGAGCCTCACAGAATTGAATACCGAGG3′) and CcpAXhoREV (5′GGGCTCGAGGAGACACGCGCTTCTCTTGC3′). The PCR product was treated with DpnI to digest the original methylated plasmid; it was then digested with XhoI and ligated to the erm cassette excised from plasmid pSC57 (Cramton et al., 1999) with XhoI. The region surrounding the ccpA gene and the intervening erm cassette were excised with BamHI and ligated to pMAD. This construct was purified from E. coli and electroporated into strain RN4220 as described by Lee (Lee, 1993). Mutants in which a double-crossover event had replaced the chromosomal copy of ccpA with the erm cassette were selected as previously described (Mackey-Lawrence et al., 2009). The mutation was transduced to strains10833 and SA113 using phage 80α (Kasatiya & Baldwin, 1967) to produce strains 10833ΔccpA::erm and SA113ΔccpA::erm.
RESULTS
The isaB transcript is monocistronic
As shown in Fig. 1A, aur, the gene encoding the metalloprotease aureolysin, is located immediately downstream from isaB. We used Northern blot analysis to determine whether or not the two genes were co-transcribed. As shown in Fig. 1B, a probe specific for isaB, detected a transcript of approximately 500 nucleotides (nt), which is consistent with the predicted 528 bp size of the monocistronic isaB transcript. If aur and isaB were cotranscribed, they would yield a transcript of approximately 2,481 nt but no transcripts over ~500 nt were detected. These results suggest that the isaB transcript is monocistronic.
Fig 1. The isaB transcript is monocistronic.
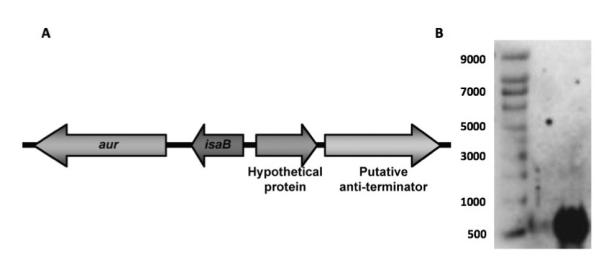
A. Illustration of isaB and surrounding genes showing the gene for aureolysin (aur) immediately downstream. B. Northern analysis revealed a single ~500nt transcript detected with an isaB-specific probe. Left lane, RNA size marker, right lane, isaB transcript.
Transcriptional start site of isaB
The transcriptional start site (TSS) of isaB was determined by 5′ RACE analysis. As Fig. 2 indicates, the TSS matched the TSS predicted by BPROM (Softberry software). The TSS was 39 bp upstream from the start codon, indicating that the isaB transcript contains a 39 nt 5′-untranlated region. Upon analysis of the promoter region, we found a putative SarA consensus binding sequence of ATTTTAT, which overlaps the predicted -35 site within the isaB promoter (Chien et al., 1999; Sterba et al., 2003). We therefore investigated the role of SarA as a regulator of isaB.
Fig 2. Identification of the isaB transcriptional start site.
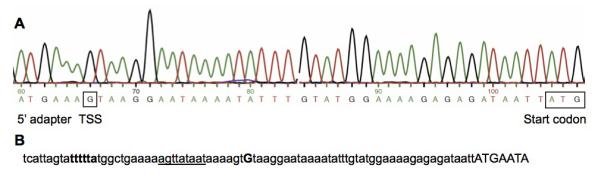
A. Sequence data from 5′-RACE analysis showing the fusion between the adapter and the 5′-end of the transcript (boxed “G”), and the start codon of the isaB gene. B. BPROM predicted promoter indicating the predicted -35 region in bold characters, the predicted -10 region underlined, the predicted transcriptional start site (uppercase “G”), and the start of the isaB gene in uppercase.
SarA represses isaB expression
SarA, is a well characterized transcription factor considered to be a global regulator of many virulence genes, and a previously published report using microarray analysis suggests that it represses isaB (Fujimoto et al., 2009). We compared levels of isaB transcript in 10833 versus its isogenic sarA deletion mutant using Northern analysis and realtime RT-PCR. As shown in Fig. 3A, isaB transcript levels were elevated in the 10833ΔsarA::erm deletion mutant as observed by northern blot analysis.
Fig 3. Deletion of sarA leads to increased levels of isaB transcript.

RNA was isolated from S. aureus strain 10833 and its isogenic sarA deletion mutant and subjected to A. Northern analysis using an isaB-specific probe and B. realtime RT-PCR. For RT-PCR, RNA was purified from cultures at different time-points to quantify the effect of SarA on isaB expression during different stages of growth and threshold values were normalized to 16S. Error bars represent standard deviation within 3 replicates.
In order to further quantify the level of SarA-mediated repression, realtime RT-PCR was used to measure isaB transcript levels over time. Overnight cultures of the wild-type and ΔsarA strains were diluted 1:100 in fresh media, and samples were collected at 2, 4, 6, and 24 hours. At all time-points, strain 10833ΔsarA::erm contained more isaB transcript than 10833 (Fig. 3B). Interestingly, isaB transcript continued to accumulate in strain 10833ΔsarA::erm over the time-course, whereas transcript levels began to decrease after 4 hr in the wild-type strain resulting in an 88-fold lower level of isaB transcript in 10833 at 24 hr. These data support the conclusion that SarA is a negative regulator of isaB expression.
isaB is induced during growth in plasma and serum
IsaB induces an immune response during septicemia suggesting that it is expressed in blood (Lorenz et al., 2000a). We assessed blood components for their ability to induce isaB expression. RNA was purified from S. aureus cultures grown in LB, human plasma, or serum. After two hours of incubation in plasma or serum isaB transcript levels were increased by more than 5-fold relative to LB (Fig. 4), suggesting that isaB expression is induced by blood components.
Fig 4. Levels of isaB transcript are elevated in human plasma and serum.

S. aureus strain 10833 was cultured in LB, human plasma, or human serum for hours, RNA was purified and analyzed by realtime RT-PCR using isaB-specific primers. The threshold values were normalized to 16S. Error bars represent standard deviation within 3 replicates.
Simple sugars induce expression of isaB
We tested the effect of carbohydrate availability on isaB expression. As shown in Fig. 5A, upon addition of 1% glucose, isaB transcript increased approximately 14-fold relative to media without glucose. Fructose and sucrose, both simples sugars that can be used in glycolysis were also tested for their ability to induce isaB, again utilizing realtime RT-PCR (Jankovic and Brückner, 2007). Both fructose and sucrose were capable of increasing detectable isaB transcript by approximately 13- and 8-fold, respectively.
Fig 5. Levels of isaB transcript are elevated in the presence of a simple carbon source.

S. aureus 10833 was cultured in LB alone or supplemented with 1% glucose (LBG), 1% fructose (LBF), or 1% sucrose (LBS) and RNA was purified for analysis of isaB expression by realtime RT-PCR. A. isaB transcript levels were elevated by the addition of glucose, fructose, and sucrose. B. The increase in isaB transcript was not apparent until 4 hours following the addition of glucose but was sustained over a 24 hour period.
A time course of glucose induction was performed to determine when the maximal induction of isaB expression occurred, and its duration. Time points were collected at 2, 4, 6, 8, 24 hrs post-dilution into fresh LBG. Interestingly, there was a significant delay between the time glucose was added and the time when elevated levels of isaB transcript were observed. By 6 hr following glucose addition, there was an 8-fold increase in transcript levels and by 24 hr there was an approximately 20-fold increase (Fig. 5B). Similar experiments were performed on the unrelated S. aureus strain Sa113 and the same trend was observed with isaB expression peaking between 8-24 hours (data not shown).
The effect of CcpA and pH on isaB expression
Since glucose induced the expression of isaB, we hypothesized that CcpA could play a role in its regulation. An isogenic ccpA deletion mutant was constructed and realtime RT-PCR was used to analyze isaB transcript levels in 10833 and 10833ΔccpA::erm. Samples were taken at time-points 2, 4, 6, 8, and 24 hrs following dilution in LB or LBG. Deletion of ccpA resulted in a dramatic decrease in the amount of isaB transcript in the presence of glucose (Fig. 6A). These findings suggested that isaB expression is activated through the carbon catabolite control system, mediated by CcpA.
Fig 6. Levels of isaB transcript decrease in the absence of CcpA.
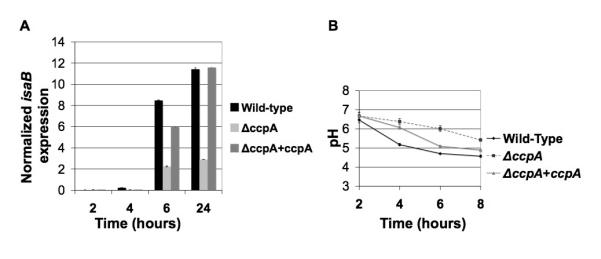
RNA was purified from S. aureus 10833 and an isogenic ccpA deletion mutant and analyzed by realtime RT-PCR using isaB-specific primers. The threshold values were normalized to 16S. A. The ccpA deletion mutant expressed lower levels of isaB transcript at every time-point. B. The pH of the media in which the 10833ΔccpA::erm was grown did not decrease as rapidly as 10833. Error bars represent standard deviation within 3 replicates.
Because we consistently noted a delay between glucose addition and isaB induction, we considered the possibility that the effect was actually due to a decrease in the pH of the growth medium (Gaupp et al., 2010; Seidl et al., 2009). To determine whether the ccpA deletion affected the pH of the growth medium, the pH of the media was monitored over time. We found that the media in which 10833ΔccpA::erm was cultured exhibited a delay in acidification compared to the wild-type strain 10833 (Fig. 6B).
Glucose-mediated isaB induction is dependent upon acidification
To address the possibility that a drop in pH was involved in the elevated isaB expression in the presence of glucose, a time-course was performed, however in addition to the normal LBG culture, 50 mM HEPES was added to LBG to buffer the media to pH 7.0 and prevent or delay the acidification of the media without affecting growth (Seidl et al., 2006). When the pH of the media was buffered to maintain a neutral pH longer we did not observe the typical levels of isaB induction by glucose (Fig. 7a). Furthermore, when 10833 and 10833ΔccpA::erm were added to LB adjusted to pH 5, 6, 7, or 8, isaB transcript levels were elevated at low pH within 30 minutes (Fig. 7b). To ensure that the increased transcript levels translated into increased surface expression of IsaB protein, we performed Western analysis and found that IsaB was expressed at pH 5 and 6 but not at pH 7 or 8 (Fig 7c). Therefore, it is likely that the decrease in pH, a consequence of carbon metabolism, is in fact turning on isaB expression. The delayed drop in pH is likely responsible for the observed effect that deletion of ccpA had on isaB levels, and therefore from these studies it appears that CcpA may not have a direct role in the regulation of isaB.
Fig 7. Glucose-induced isaB expression is mediated by decreasing pH.

RNA was purified from A. 10833 or B. 10833ΔccpA::erm, and analyzed by realtime RT-PCR using isaB-specific primers. The threshold values were normalized to 16S. A. cultures were in LB alone, LB supplemented with 1% glucose (LBG), LB buffered to pH 7.0, and LBG buffered to pH 7.0. B. cultures were in LB pH 5, 6, 7, or 8. C. Western analysis showing expression of IsaB in 10833 at different pH levels. The IsaB antibody cross-reacts with a similar sized antigen. IsaB is the upper band and is marked with an arrow.
DISCUSSION
These studies show that blood components and simple carbon sources or their acidic metabolic byproducts lead to increased transcription of isaB. As aerobic bacteria in culture grow, CO2 and acetic acid accumulate in the media, which leads to a decrease in the pH from ~7.5 to ~4.5 over only a few hours. Despite incubation of cultures in the presence of oxygen, the culture to vessel volume ratio used in our studies was likely high enough to result in the development of anaerobic conditions. This would lead to the accumulation the production of additional acidic byproducts and a further reduction in pH. From our time-course studies we observed that isaB expression does not reach peak levels until a time-point at which all of the glucose in the culture has likely been depleted, and the pH has dropped to approximately 5 (Seidl et al., 2008; Seidl et al., 2009). Therefore we speculated that acidic conditions were actually behind the induction of isaB. We buffered the medium to significantly delay acidification following carbohydrate metabolism. We found that once the media was buffered and the drop in pH delayed, induction of isaB by glucose was severely attenuated. Another interesting finding was that the pattern of isaB induction of cultures grown in the buffered media was strikingly similar to what was observed for the CcpA mutant. By repeating the CcpA time-course and monitoring the change in pH we found that the CcpA mutation was associated with a significant delay in the acidification of the media. This is likely due to impairment of glucose utilization, which would prevent the accumulation of acetic acid in the media. Therefore, we were able to conclude that pH, not glucose or CcpA was responsible for the majority of the isaB induction. This data also raises the possibility that changes in the expression of other genes in response to the deletion of ccpA could be an indirect effect of pH.
Of clinical relevance, these studies have found that isaB expression increases significantly following culture in either serum or plasma. Again supporting the hypothesis that as a virulence factor, IsaB is expressed in vivo during septicemia. However as these fluids are composed of a great number of factors, it is not clear from our study which components are responsible for stimulating increased isaB transcription. These results further increase the complexity of the regulation of isaB as the same signals or proteins that sense acidic conditions are not likely to be stimulated in serum/plasma as these biological fluids are inherently buffered to maintain a tight homeostasis at neutral pH. However, isaB is induced following phagocytosis, where S. aureus would be exposed to low pH inside the phagolysosome of neutrophils. Important future experiments would be to elucidate which mechanisms, such as one of the 16 two-component systems in S. aureus, are responsible for each stimulus (Somerville & Proctor, 2009).
Finally these studies have demonstrated that SarA is a negative regulator of isaB, although it is currently unknown if this is due to direct or indirect regulation. The predicted promoter of isaB contains a consensus 7 base pair SarA binding consensus sequence, which overlaps the -35 region, suggesting that isaB could be directly regulated by SarA (Chien et al., 1999; Sterba et al., 2003). It is interesting to note that a recent study by Fujimoto et al, has suggested that SarA is affected by pH, which may explain our findings that isaB expression was regulated by pH and SarA (Fujimoto et al., 2009).
It is interesting to speculate that isaB expression in vivo could be induced by factors such as high local concentrations of nucleic acids found in neutrophil extracellular traps (NETs), or within the phagolysosome of viable neutrophils. We have found that IsaB binds nucleic acids to the bacterial cell surface (Mackey-Lawrence et al., 2009). Therefore, in these compartments, IsaB could bind to extracellular nucleic acids and protect S. aureus from killing. Through these studies we have begun to define the regulatory network of isaB and have provided additional evidence suggesting that IsaB would be expressed during bacteremia and infection, further supporting its role as an important virulence factor, and potential therapeutic target of S. aureus.
Acknowledgements
This work was supported by NIH funds for R01AI068892-03.
Footnotes
Publisher's Disclaimer: This is a PDF file of an unedited manuscript that has been accepted for publication. As a service to our customers we are providing this early version of the manuscript. The manuscript will undergo copyediting, typesetting, and review of the resulting proof before it is published in its final citable form. Please note that during the production process errors may be discovered which could affect the content, and all legal disclaimers that apply to the journal pertain.
REFERENCES
- Cheung AL, Manna AC. Role of the distal sarA promoters in SarA expression in Staphylococcus aureus. Infect Immun. 2005;73(7):4391–4394. doi: 10.1128/IAI.73.7.4391-4394.2005. [DOI] [PMC free article] [PubMed] [Google Scholar]
- Chien Y, Manna AC, Projan SJ, Cheung AL. SarA, a global regulator of virulence determinants in Staphylococcus aureus, binds to a conserved motif essential for sar-dependent gene regulation. J Biol Chem. 1999;274(52):37169–37176. doi: 10.1074/jbc.274.52.37169. [DOI] [PubMed] [Google Scholar]
- Cramton SE, Gerke C, Schnell NF, Nichols WW, Götz F. The intercellular adhesion (ica) locus is present in Staphylococcus aureus and is required for biofilm formation. Infection & Immunity. 1999;67(10):5427–5433. doi: 10.1128/iai.67.10.5427-5433.1999. [DOI] [PMC free article] [PubMed] [Google Scholar]
- Fuchs S, Pane-Farre J, Kohler C, Hecker M, Engelmann S. Anaerobic gene expression in Staphylococcus aureus. J Bacteriol. 2007;189(11):4275–4289. doi: 10.1128/JB.00081-07. [DOI] [PMC free article] [PubMed] [Google Scholar]
- Fujimoto DF, Higginbotham RH, Sterba KM, Maleki SJ, Segall AM, Smeltzer MS, Hurlburt BK. Staphylococcus aureus SarA is a regulatory protein responsive to redox and pH that can support bacteriophage lambda integrase-mediated excision/recombination. Mol Microbiol. 2009;74(6):1445–1458. doi: 10.1111/j.1365-2958.2009.06942.x. [DOI] [PMC free article] [PubMed] [Google Scholar]
- Garzoni C, Francois P, Huyghe A, et al. A global view of Staphylococcus aureus whole genome expression upon internalization in human epithelial cells. BMC Genomics. 2007;8:171. doi: 10.1186/1471-2164-8-171. [DOI] [PMC free article] [PubMed] [Google Scholar]
- Gaupp R, Schlag S, Liebeke M, Lalk M, Götz F. Advantage of up-regulation of succinate dehydrogenase in Staphylococcus aureus biofilm. J Bacteriol. 2010;192(9):2385–2394. doi: 10.1128/JB.01472-09. [DOI] [PMC free article] [PubMed] [Google Scholar]
- George EA, Muir TW. Molecular mechanisms of agr quorum sensing in virulent staphylococci. Chembiochem. 2007;8(8):847–855. doi: 10.1002/cbic.200700023. [DOI] [PubMed] [Google Scholar]
- Gorwitz R, Jernigan D, Powers J, Jernigan J, Community, Participants in the Centers for Disease Control and Prevention-Convened Experts’ Meeting on Management of MRSA in the Community Strategies for clinical management of MRSA in the community: Summary of an experts’ meeting convened by the Centers for Disease Control and Prevention. Centers for Disease Control and Prevention. 2006 [Google Scholar]
- Jankovic I, Brückner R. Carbon catabolite repression of sucrose utilization in Staphylococcus xylosus: catabolite control protein CcpA ensures glucose preference and autoregulatory limitation of sucrose utilization. J Mol Microbiol Biotechnol. 2007;12(1-2):114–120. doi: 10.1159/000096466. [DOI] [PubMed] [Google Scholar]
- Kasatiya SS, Baldwin JN. Nature of the determinant of tetracycline resistance in Staphylococcus aureus. Canadian Journal of Microbiology. 1967;13(8):1079–1086. doi: 10.1139/m67-144. [DOI] [PubMed] [Google Scholar]
- Lee JC. Electrotransformation of Staphylococci. Humana Press Inc.; Totowa, NJ: 1993. [Google Scholar]
- Lorenz U, Ohlsen K, Karch H, Hecker M, Thiede A, Hacker J. Human antibody response during sepsis against targets expressed by methicillin resistant Staphylococcus aureus. FEMS Immunol Med Microbiol. 2000a;29(2):145–153. doi: 10.1111/j.1574-695X.2000.tb01517.x. [DOI] [PubMed] [Google Scholar]
- Lorenz U, Ohlsen K, Karch H, Thiede A, Hacker J. Immunodominant proteins in human sepsis caused by methicillin resistant Staphylococcus aureus. Adv Exp Med Biol. 2000b;485:273–278. doi: 10.1007/0-306-46840-9_36. [DOI] [PubMed] [Google Scholar]
- Mackey-Lawrence NM, Potter DE, Cerca N, Jefferson KK. Staphylococcus aureus immunodominant surface antigen B is a cell-surface associated nucleic acid binding protein. BMC Microbiol. 2009;9:61. doi: 10.1186/1471-2180-9-61. [DOI] [PMC free article] [PubMed] [Google Scholar]
- Pragman AA, Schlievert PM. Virulence regulation in Staphylococcus aureus: the need for in vivo analysis of virulence factor regulation. FEMS Immunol Med Microbiol. 2004;42(2):147–154. doi: 10.1016/j.femsim.2004.05.005. [DOI] [PubMed] [Google Scholar]
- Resch A, Rosenstein R, Nerz C, Götz F. Differential gene expression profiling of Staphylococcus aureus cultivated under biofilm and planktonic conditions. Appl Environ Microbiol. 2005;71(5):2663–2676. doi: 10.1128/AEM.71.5.2663-2676.2005. [DOI] [PMC free article] [PubMed] [Google Scholar]
- Seidl K, Stucki M, Ruegg M, Goerke C, Wolz C, Harris L, Berger-Bachi B, Bischoff M. Staphylococcus aureus CcpA affects virulence determinant production and antibiotic resistance. Antimicrob Agents Chemother. 2006;50:1183–1194. doi: 10.1128/AAC.50.4.1183-1194.2006. [DOI] [PMC free article] [PubMed] [Google Scholar]
- Seidl K, Bischoff M, Berger-Bachi B. CcpA mediates the catabolite repression of tst in Staphylococcus aureus. Infect Immun. 2008;76(11):5093–5099. doi: 10.1128/IAI.00724-08. [DOI] [PMC free article] [PubMed] [Google Scholar]
- Seidl K, Muller S, Francois P, Kriebitzsch C, Schrenzel J, Engelmann S, Bischoff M, Berger-Bachi B. Effect of a glucose impulse on the CcpA regulon in Staphylococcus aureus. BMC Microbiol. 2009;9:95. doi: 10.1186/1471-2180-9-95. [DOI] [PMC free article] [PubMed] [Google Scholar]
- Somerville GA, Proctor RA. At the crossroads of bacterial metabolism and virulence factor synthesis in Staphylococci. Microbiol Mol Biol Rev. 2009;73(2):233–248. doi: 10.1128/MMBR.00005-09. [DOI] [PMC free article] [PubMed] [Google Scholar]
- Sterba KM, Mackintosh SG, Blevins JS, Hurlburt BK, Smeltzer MS. Characterization of Staphylococcus aureus SarA binding sites. J Bacteriol. 2003;185(15):4410–4417. doi: 10.1128/JB.185.15.4410-4417.2003. [DOI] [PMC free article] [PubMed] [Google Scholar]
- Voyich JM, Braughton KR, Sturdevant DE, et al. Insights into mechanisms used by Staphylococcus aureus to avoid destruction by human neutrophils. J Immunol. 2005;175(6):3907–3919. doi: 10.4049/jimmunol.175.6.3907. [DOI] [PubMed] [Google Scholar]