

Abstract
Background Educational attainment is highly correlated with social inequalities in adult cognitive health; however, the nature of this correlation is in dispute. Recently, researchers have argued that educational inequalities are an artefact of selection by individual differences in prior cognitive ability, which both drives educational attainment and tracks across the rest of the life course. Although few would deny that educational attainment is at least partly determined by prior cognitive ability, a complementary, yet controversial, view is that education has a direct causal and lasting benefit on cognitive development.
Methods We use observational data from three birth cohorts, with cognition measured in adolescence and adulthood. Ordinary least squares regression was used to model the relationship between adolescent cognition and adult fluid cognition and to test the sensitivity of our analyses to sample selection, projection and backdoor biases using propensity score matching.
Results We find that having a university education is correlated with higher fluid cognition in adulthood, after adjustment for adolescent cognition. We do not find that adolescent cognition, gender or parental social class consistently modify this effect; however, women benefited more in the 1946 sample from Great Britain.
Conclusions In all three birth cohorts, substantial educational benefit remained after adjustment for adolescent cognition and parental social class, offsetting an effect equivalent of 0.5 to 1.5 standard deviations lower adolescent cognition. We also find that the likelihood of earning a university degree depends in part on adolescent cognition, gender and parental social class. We conclude that inequalities in adult cognition derive in part from educational experiences after adolescence.
Keywords: Educational benefits, cognitive selection, class reproduction, life course, cognitive health, adolescent cognition
Introduction
Educational attainment is highly correlated with adult fluid cognition, but the nature of this relationship remains controversial. Some argue that the ostensible influence of education on cognition is primarily an artefact of selection by prior cognitive ability, differences in which emerge in early life, drive educational attainment and track across the life course.1–5 Overlying this may be genetic and early social common-cause processes that link cognitive development and educational attainment.6 However, although few would deny that educational attainment is at least partly determined by prior cognitive ability, an alternative view is that education promotes cognitive development,6 based on the teaching process and enriched environments. From this perspective, education has a lasting beneficial impact on cognitive functioning in later life,7 including increased cognitive reserve and resilience to age-related neuropathology.8
Hypotheses
Figure 1 shows how we might differentiate selection from causation using graphical representations of educational attainment and adolescent cognition. Under ‘cognitive selection’ (Figure 1A), we expect that adolescent cognition predicts both adult cognition and educational attainment, but that education does not provide additional cognitive benefits. Under ‘educational benefits’ (Figure 1B), adolescent cognition plays no role in determining educational attainment, but those who achieve higher education earn higher adult cognition. However, if both selection and causation processes are active (Figure 1C), we expect to observe both cognitive processes and educational benefits in adult cognition.
Figure 1.
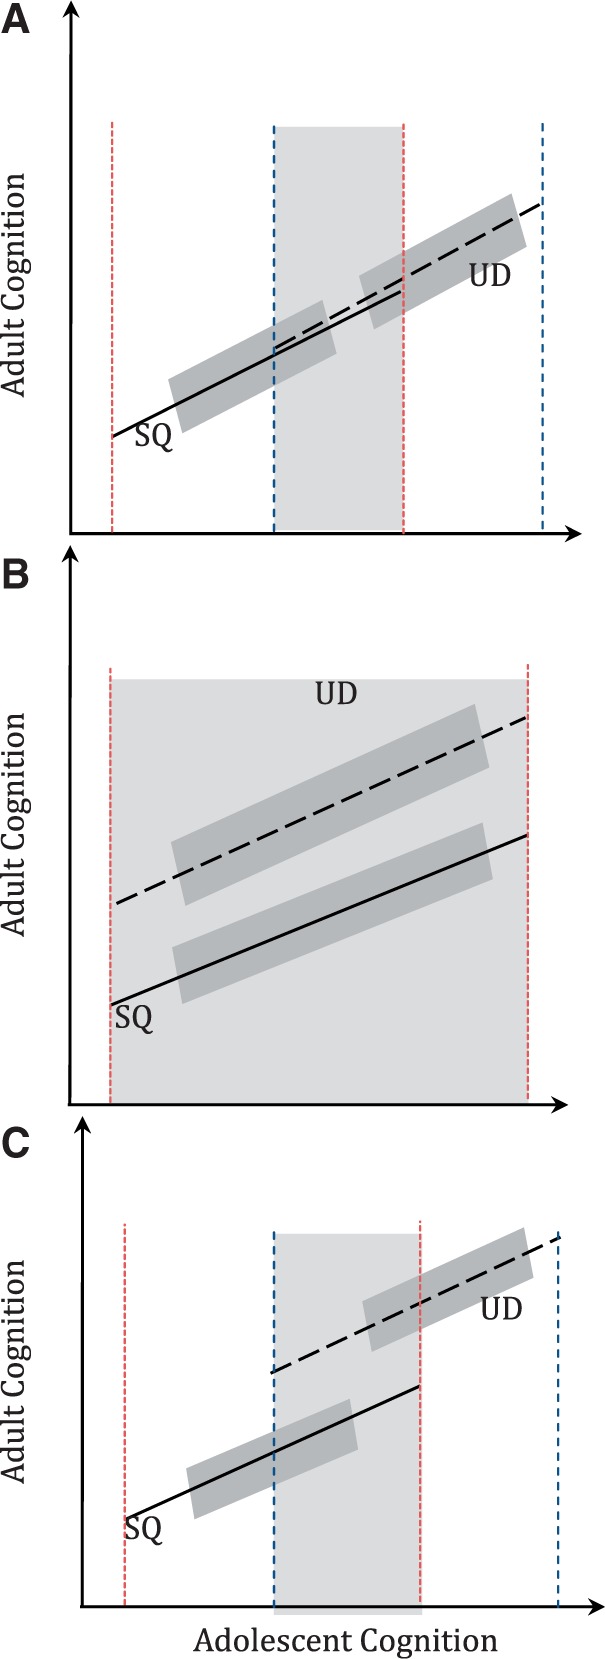
Graphical representation showing cognitive selection into educational attainment and educational benefits on adult cognition. Secondary Qualifications (SQ) lines are solid; University Degree (UD) lines are dashed. Dark grey bands represent confidence intervals. Light grey bands show regions where different qualifications have graduates with similar adolescent intelligence. (A) Cognitive processes: adolescent and adult cognition are correlated; adolescent intelligence defines propensity for educational attainment with no educational benefits. (B) Educational benefits: no cognitive selection for educational attainment; adult cognition determined by both adolescent intelligence and educational benefits. (C) Multiple processes: evidence for both cognitive selection into education and benefit of education on adult cognition
Data
To assess these competing, but potentially complementary, theories, we evaluate differences in adult cognitive outcomes in relation to educational attainment. Cognitive development takes time to reach maturity1; therefore, we used adolescent cognition to adjust for individual differences in adult cognition. Educational attainment is often mandated; therefore, we focused our attention on university educational attainment, which is subject to variance in outcomes owing to non-cognitive factors including cost, culture, gender and educational or occupational aspiration. Because education may not provide a universal effect, with any benefits possibly modified by, for instance, competition, selectivity and educational difficulty, we provide estimates in three prospective cohorts, providing a basis for comparison across country and birth cohort. In Great Britain (hereafter G.B., which includes England, Scotland and Wales), we observe cognition at age 15 years using the Alice Heim 4 group ability test, and adult fluid cognition at age 53 years using verbal recall and letter cancellation for a class-stratified sample of 5362 people born in 1 week in March 1946 (i.e. G.B. 1946 cohort).9 In the G.B. 1958 cohort, we also observe cognition at age 16 years using a scale (Cronbach’s α = 0.8) combining scores on mathematics and reading comprehension tests, and at age 50 years using letter cancellation, animal naming, verbal memory and verbal recall among 18 558 individuals in G.B. born in 1958.10,11 We have access to general ability, mathematics and vocabulary scores in the G.B. 1946 cohort that are comparable with those used in the G.B. 1958 cohort. In the 1946 cohort, general ability is strongly correlated with a factor score created using mathematics and vocabulary scores (r = 0.8 at age 15 years). Finally, we observe adolescent cognition at age 16 years using the Henmon-Nelson test, and adult fluid cognition at age 53 years using the Weschler Adult Intelligence Scale-Similarities Index among 10 317 adolescents born on average in 1939 and graduating from high school in 1957 in Wisconsin, USA (hereafter U.S. 1939).12 We provide a detailed description of the measurements for adult fluid cognition (Supplementary Table S1, available as Supplementary data at IJE online).
Educational attainment differs substantially between these three cohorts over time and cross-nationally. Moreover, the social circumstances necessary to access further educational attainment differ substantially between cohorts. Parental household social class and gender were used to assess confounding from potential common causes. Respondents’ highest level of educational qualification was recorded between ages 26 and 42 years. The U.S. cohort did not follow individuals who did not graduate from high school; we therefore limit our analysis in the British analyses to those who achieved secondary qualifications (those with O-level certificates). Replications of this study amongst those with lower qualifications yield similar results.
These data represent non-immigrant Whites from different countries, eras and educational systems. To contextualize the educational system, Table 1 provides the percentages of students leaving school without secondary qualifications, with secondary qualifications, with mixed qualifications and with a university degree. Furthermore, we have provided the likelihood of each educational degree by sex, parental social class and cognitive tertiles (33 percentile groupings). Those in the U.S. 1939 cohort were more likely (75%) to graduate with at least secondary (high school) qualifications than those in either of the British cohorts (1946: 1.00–0.48 = 52%; 1958: 1.00–0.36 = 64%). The likelihood of a student from the non-manual classes graduating from university was around 2-fold greater than the likelihood of those from manual classes. Gains in higher education occurred in both non-manual and manual classes over time: in each successive cohort, the number of students who graduated with secondary qualifications and who went on to graduate with a university degree increased. In conjunction with this, the number of women who graduated with university degrees was substantially larger in the G.B. 1958 cohort than in either of the earlier cohorts. Finally, those who were in the top 33% in adolescent cognition were much more likely to get a university degree [40% (G.B. 1958), 21% (U.S. 1939, G.B. 1946)] than those who scored in the lowest third (0–2%).
Table 1.
Percentage of sample in each level of educational attainment and the probability of earning a university degree contingent on earning secondary qualifications separated by sex, parental social class and high vs low adolescent cognition using data from U.S. 1939, G.B. 1946 and G.B. 1958 samples
| Overall educational attainment for all three samples | ||||||||
|---|---|---|---|---|---|---|---|---|
| Cohort | No qualifications | Secondary qualifications | Mixed qualifications | University degree | ||||
| U.S. 1939 | 25%a | 53% | 15% | 7% | ||||
| G.B. 1946 | 48% | 19% | 23% | 9% | ||||
| G.B. 1958 | 36% | 35% | 13% | 17% | ||||
| Sex | Male | Female | Male | Female | Male | Female | Male | Female |
| U.S. 1939 | – | – | 0.65 | 0.76 | 0.21 | 0.18 | 0.15 | 0.05 |
| G.B. 1946 | 0.46 | 0.49 | 0.15 | 0.24 | 0.26 | 0.21 | 0.13 | 0.05 |
| G.B. 1958 | 0.38 | 0.33 | 0.32 | 0.38 | 0.12 | 0.14 | 0.18 | 0.15 |
| Parental class | Manual | Non-manual | Manual | Non-manual | Manual | Non-manual | Manual | Non-manual |
| U.S. 1939 | – | – | 0.80 | 0.52 | 0.14 | 0.32 | 0.06 | 0.17 |
| G.B. 1946 | 0.62 | 0.24 | 0.17 | 0.23 | 0.17 | 0.34 | 0.04 | 0.19 |
| G.B. 1958 | 0.42 | 0.19 | 0.36 | 0.32 | 0.10 | 0.19 | 0.12 | 0.30 |
| Adolescent cognition | Top third | Bottom third | Top third | Bottom third | Top third | Bottom third | Top third | Bottom third |
| U.S. 1939 | – | – | 0.47 | 0.89 | 0.32 | 0.08 | 0.21 | 0.02 |
| G.B. 1946 | 0.17 | 0.82 | 0.26 | 0.10 | 0.36 | 0.08 | 0.21 | 0.00 |
| G.B. 1958 | 0.05 | 0.69 | 0.31 | 0.25 | 0.24 | 0.04 | 0.40 | 0.02 |
aBecause the U.S. cohort excludes those who did not graduate from high school, we infer from analyses at the state level rather than from the data.46
Dashes have been used to indicate unknown data. Those with A-level qualifications or mixed qualifications (university dropouts or community college degrees) are excluded from these analyses.
Methods
Counterfactual methods attempt to account for sample selection by carefully analysing the evidence for a treatment effect based on a balanced, robust, comparison group.13 Adolescent cognition, gender and parental social class are strong predictors of educational propensity; therefore, a standard ordinary least squares (OLS) model is appropriate for modelling mid-life fluid cognition. Adolescent cognition was thus regressed on adult cognition, with education modifying both the intercepts and the slopes of the effect of adolescent cognition. These results use robust standard errors calculated using the Huber–White correction. The model specified in Equation 1 was used to provide the estimates in Figure 2. The interaction between education and adolescent cognition was included in all analyses for comparison purposes; however, it is only important in the U.S. 1939 cohort [−0.17 (−0.24 to −0.10), P < 0.001].
| (1) |
where ca represents cognition in adulthood, α is the constant, β represents slopes, ct is cognition in adolescence, e is educational attainment, ct*e is the interaction between adolescent cognition and educational attainment, p is parental social class, s is the respondent’s gender and ε represents the error.
Figure 2.
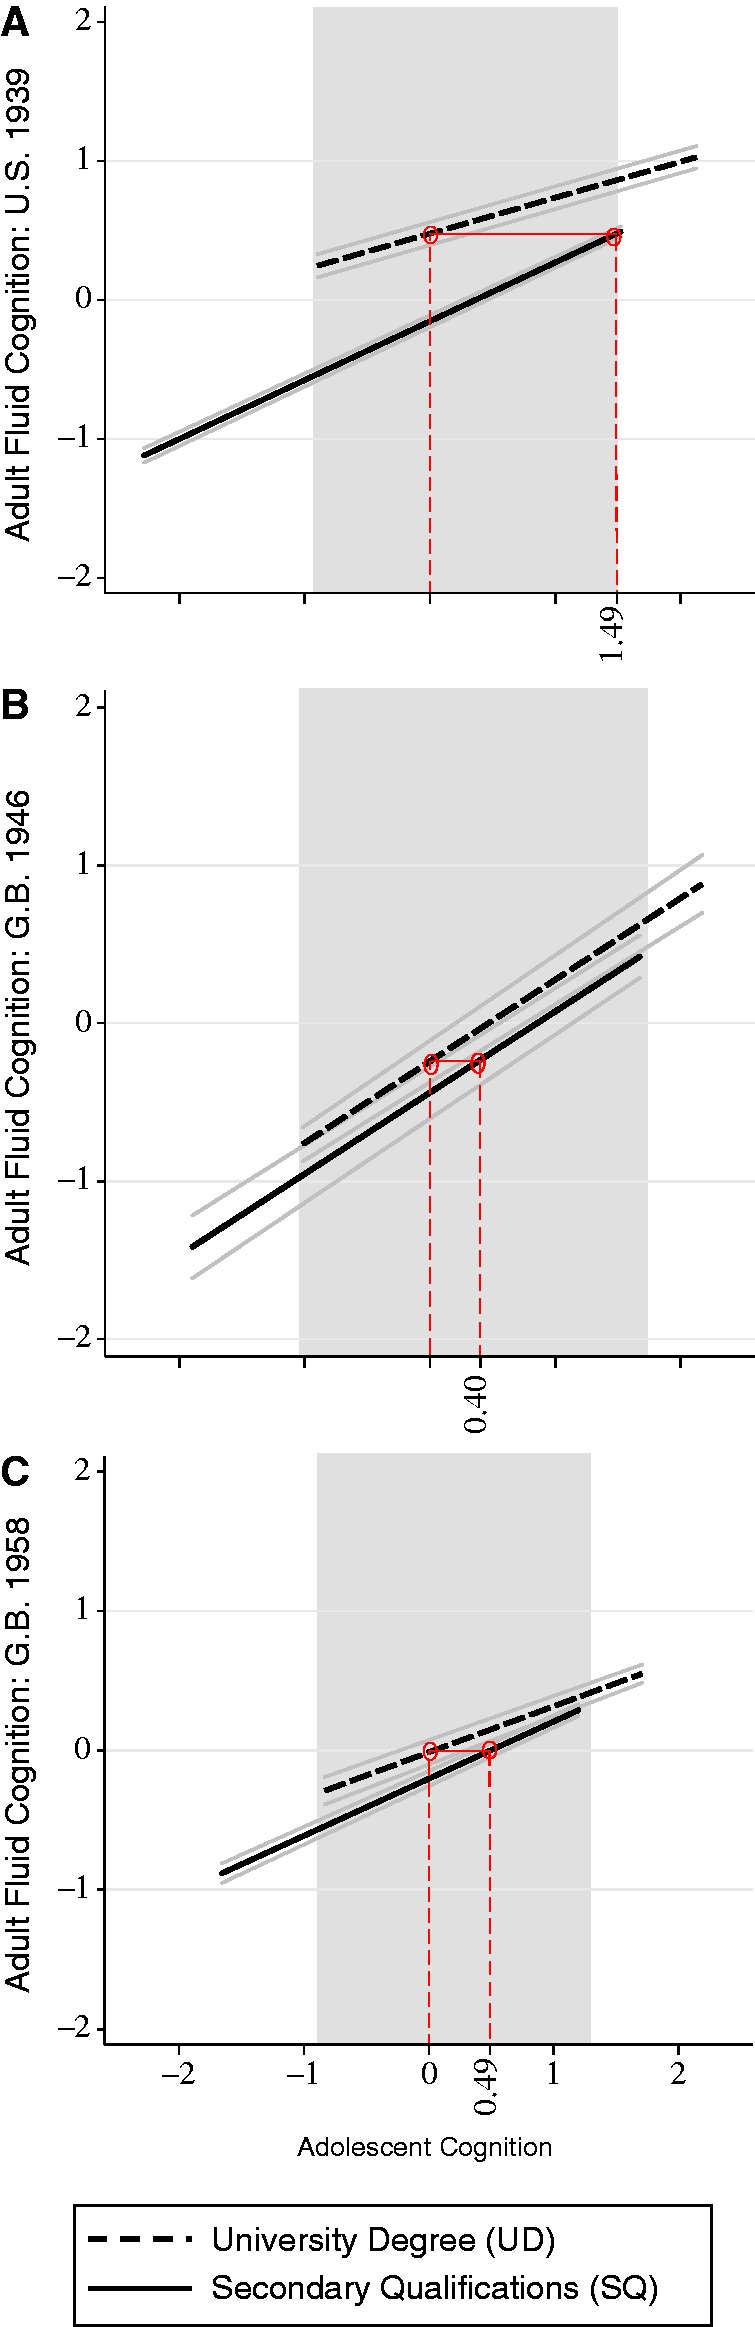
Adult fluid cognition by adolescent intelligence for those who were educated to a university degree (UD) as compared with those with secondary qualifications (SQ). We provide OLS estimates using thick black lines, and 95% confidence intervals using mirrored solid thin grey lines. For explanatory purposes, we use horizontal solid lines capped by circles and dashed vertical lines to estimate a point estimate for the cognitive offset evaluated at the sample average (ΔC0). (A) In the U.S. 1939 cohort, ΔC0 is large at 1.49 (1.44–1.54; P < 0.001). (B) In the 1946 G.B. cohort, ΔC0 was 0.40 (−0.01 to 0.81; P > 0.05). (C) In the 1958 G.B. cohort, ΔC0 was 0.49 (0.45–0.53; P < 0.001)
To provide model estimates for Figure 3, we use the following model that includes all two-way interactions to estimate the effects of gender and parental social class in addition to their roles in educational selection. Although this model is not parsimonious, estimating reduced models with main effects only does not lead to different results. We specify these models by including gender- and social class-specific interaction terms.
Figure 3.
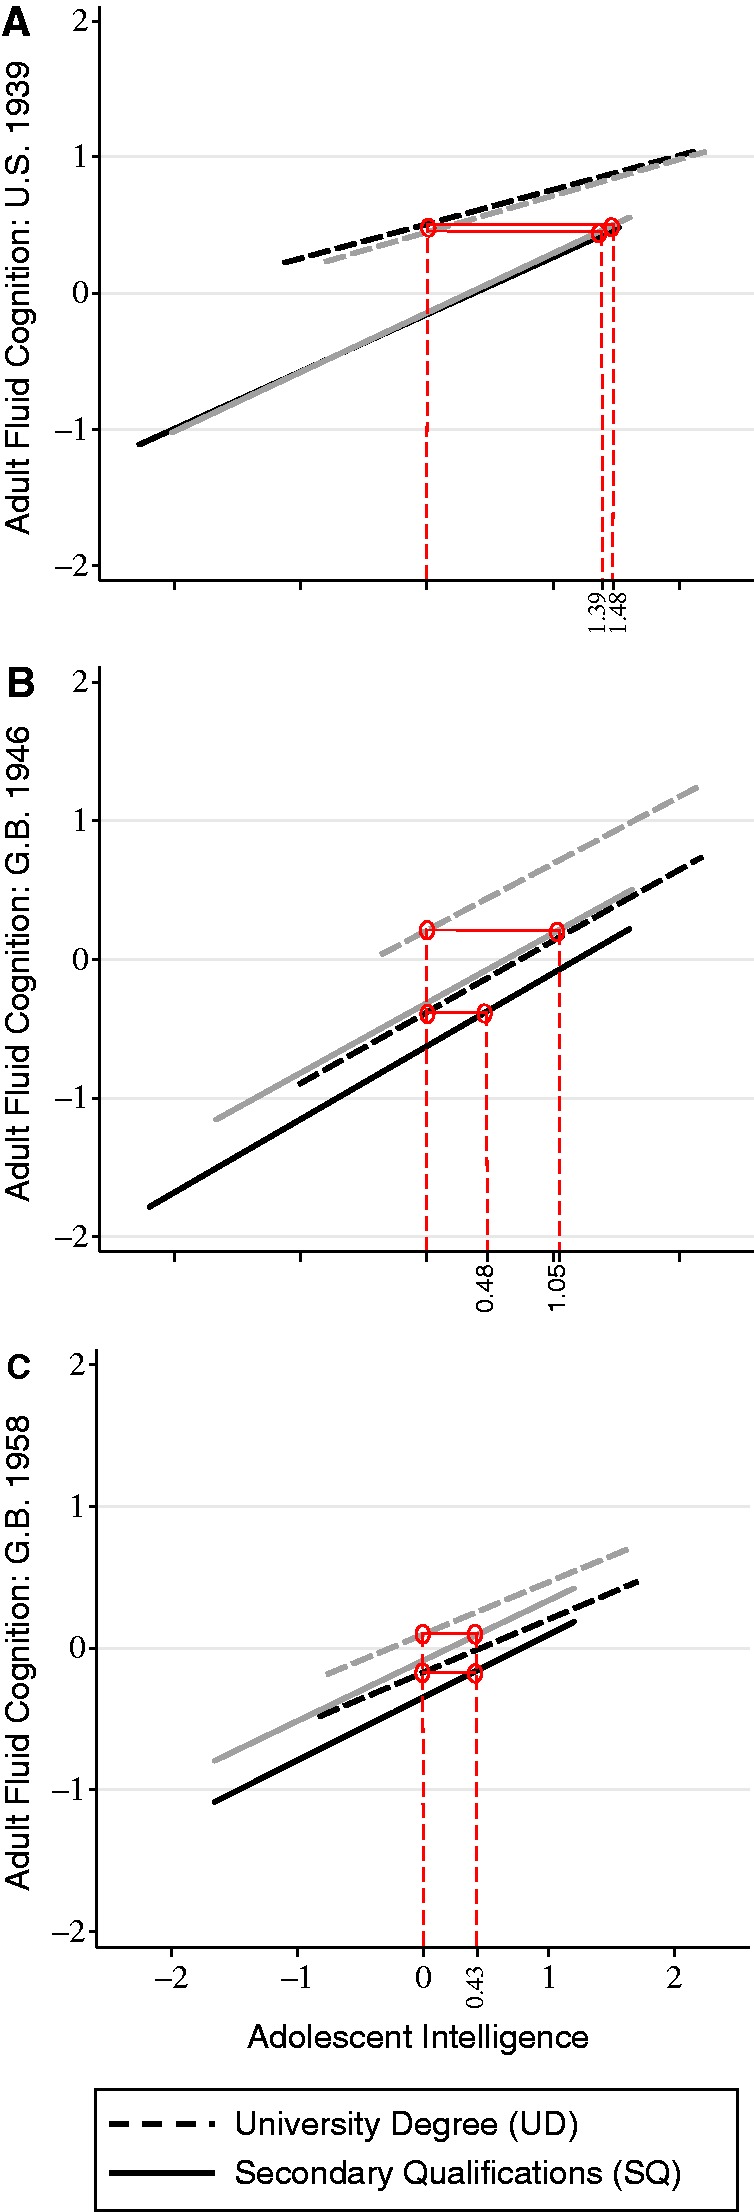
Adolescent cognition related to adult fluid cognition for women and men. Results for women are grey, whereas those for men are black. In both G.B. cohorts, women had higher adult fluid cognition than did men. (A) In the U.S. 1939 cohort, no gender differences were evident. (B) In the G.B. 1946 cohort, women benefited twice as much (P < 0.05) from higher education [ΔC0 = 1.05 (0.86–1.24)] as men [ΔC0 = 0.46 (0.28–0.64)]. (C) In the 1958 G.B. cohort, women and men benefited equally
The role of educational attainment in determining individual differences in adult fluid cognition is confounded with adolescent cognition. To test the sensitivity of our analyses to selection bias, backdoor bias and Lord’s paradox,13 we replicated our analyses using a statistically balanced estimate of the propensity for higher education in kernel-based propensity score matching14–16 and marginal structural models.17–19 We used parental social class, adolescent cognition, gender and, when important, we also considered their interactions to model educational propensity. Ensuring sample balance necessitated limiting our region of analysis to the region of cognitive overlap, highlighted as a grey square in Figure 1. Model specification (results shown in Table 1) impacts on the educational effect size but does not change the interpretation of our results.
Providing useful comparative measures is important in cognitive research. We have provided what we call the ‘cognitive offset’ (ΔC) for each cohort. ΔC estimates the adolescent cognition necessary for an individual whose treatment status (e) was zero (secondary qualifications) to expect an adult fluid cognition that was equivalent to someone of average adolescent cognition who earned a university degree.
Graphs were generated using predicted average treatment effects [β2 in Equation 1] and standard errors from the models (provided in Supplementary Table S2, available as Supplementary data at IJE online). Cognitive offset at average adolescent cognition was estimated visually in Figures 2 and 3 using red lines. For the purposes of graphical representation, we provide a range in adolescent cognition that has been symmetrically trimmed by 2.5%. These were not removed from statistical analyses (though doing so does not change the relationships) but are not represented graphically because they represent highly unlikely outcomes. Trimming does not bias results but instead highlights the effective likelihood of higher education. Measures of adolescent cognition and adult fluid cognition have been standardized for ease of interpretation and to facilitate comparability.
Results
Figure 2 relates adolescent cognition to fluid cognition in adulthood for those who attained secondary qualifications in comparison with those who earned a university degree. Replicating the hypothetical curves shown in Figure 1, using observed outcomes, in Figure 2 we highlight the beneficial effect of education by computing the ‘cognitive offset’ (ΔC). This represents the expected benefit of educational attainment by contrasting the adolescent cognition of those with similar adult cognition for those with university qualifications as compared with those with secondary qualifications.
With regard to educational propensity, we see that in all three cohorts, those with cognitive scores 1σ below sample mean rarely attained university qualifications, whereas those with adolescent cognition >1.5σ above sample mean usually did.
Considering educational benefits, we provide a point estimate for ΔC shown in red in Figure 2 (Supplementary Table S2, available as Supplementary data at IJE online, provides averages). Those in the U.S. 1939 cohort show the largest gains at 1.49σ, with those in the G.B. 1958 showing a smaller gain at 0.65σ and those in the G.B. 1946 showing the smallest gain at 0.39σ.
Figure 3 relates adolescent cognition to adult cognition by educational attainment for men and women. In both the G.B. cohorts, though not in the U.S. cohort, women have substantially higher adult cognition as compared with men. It is also clear that the educational benefit is similar in the two G.B. cohorts between years for men. In contrast, women benefited more from higher education in the 1946 cohort but benefited equally in the 1958 cohort. Further analyses considering the role of parental social class in modifying these estimates showed no additional results (not shown, regression estimates including modifiers are provided in Supplementary Table S2, available as Supplementary data at IJE online).
Discussion
We tested the impact of educational attainment on increasing adult fluid cognition using methods to account for the propensity for higher educational attainment among adolescents with higher adolescent cognition. We replicated our results across one U.S. and two British cohorts to provide a robust estimate of the impact of education. We found support for a ‘multiple processes’ hypothesis (Figure 1C), whereby both cognitive selection and educational benefits were evident. Our results suggest that a university education had a robust impact on adult fluid cognition even after adjusting for adolescent cognition in multiple domains.
Our study has some limitations that may temper our results. First, because we harmonized both the sample and the data across three cohorts for purposes of direct comparison, we were limited to using only those who had secondary qualifications. If early education is more influential than later educational opportunities,20 these results will be conservative. To ensure comparability across these three studies, we limited our sample to non-immigrants in the G.B. 1958 cohort, limiting the generalizability of our findings. Although all the indicators of adult cognition are considered to be components of fluid cognition, these are somewhat different across cohorts: the British cohorts included a component of memory, which tends to show sizeable gender differences favouring women.21 However, using fluid cognition as a measure of adult cognitive health means that our measure is susceptible to age-related cognitive decline, even in mid-life.22 We reduced the effect of age-related declines by evaluating individual differences in adult fluid cognition measured at mid-life, well before substantial age- and health-related declines (which occur as early as 15 years before death23,24). Doing this provides confidence that our results are robust to all but the earliest forms of cognitive decline.22 Finally, unobserved factors may reduce treatment effects if they are correlated to educational selection and to adult fluid cognition. Non-cognitive skills are often raised as potential confounders: they predict educational attainment,25 and are predicted by parental social class, gender and, to some degree, childhood cognition.20 We assessed the impact of unobserved factors including personality, class ranking, teacher’s evaluation of students and birthweight; these did not change the results shown here (see Supplementary Table S3, available as Supplementary data at IJE online).
These results support observations that adolescent cognition is a strong predictor of propensity for educational attainment.3,4,26–28 Despite this, respondents with a given level of adolescent cognition and a university degree had adult fluid cognition that was similar to those with substantively higher adolescent cognition but without a university degree.6,7 This supports results suggesting that education provides a benefit to adult cognition across a range of cognitive scores obtained in childhood or adolescence.29,30 The educational benefit was robust to adjustment for covariates affecting both educational attainment and adult fluid cognition and was replicated across different contexts and using different statistical approaches for assessing causal effect.
The findings presented here also suggest that contextual factors may modify the educational effect.31 For instance, in the U.S. 1939 cohort, those with lower adolescent cognition benefited more from educational attainment. This may suggest that once engaged in the rigorous training available in U.S. universities, individuals work hard to maintain their places in a way that is not true in either G.B. cohort where the benefits were found to be equal across levels of adolescent cognition. Second, gender affected both the propensity for educational attainment and educational benefits in the G.B. 1946 cohort (though not in the G.B. 1958 or U.S. 1939 cohorts). In particular, in the 1946 cohort, in comparison with men, women were substantially less likely to earn a university degree but benefited more from it in these data. If education increases cognitive reserve, it is possible that it does so in part by increasing access to occupations that increase cognitive reserve, thereby supporting economic research focusing on the return to education.32 However, although parental social class was a common cause of both educational propensity and adolescent cognition, it had no consistent direct effect on adult fluid cognition.30 Sex differences in adult fluid cognition were evident in both British cohorts but not in the U.S. cohort. Such differences are not unusual when studying verbal recall and verbal memory, which were measured in both G.B. cohorts but not in the U.S. cohort. These contextual results suggest that cognitive returns to education may be susceptible to similar forces as socio-economic returns to education.32,33
This study has wider scientific implications. Education acts as one of the primary ‘social determinants’ and ‘fundamental causes’ of social inequalities in health.34–37 Higher education is related to individual skill formation,38 and may shape a person’s life chances.39,40 Inequalities in successful learning are related to behavioural differences,41 extra-curricular training42,43 and more challenging educations.44,45 In view of this, persisting inequalities in school-readiness and access to educational opportunities are of particular concern. Our results support efforts to increase cognition by investing in educational opportunities both in early and later life.
Supplementary Data
Supplementary Data are available at IJE online.
Funding
D.K. and M.R. are supported by the United Kingdom’s Medical Research Council. S.C. and S.H. are supported by the Canadian Institutes of Health Research Institute of Aging (CUK103284). S.C. and P.H. are funded by the National Institute on Aging (AG021079). J.E. is supported by the Economic and Social Research Council, and by the Institute of Education. S.H. is supported by grants for the Integrative Analysis of Longitudinal Studies on Aging (IALSA), National Institute on Aging (AG026453).
Conflict of interest: None declared.
KEY MESSAGES.
Estimates of educational benefits are biased by unobserved individual differences in prior cognition and parental social class; however, the data to analyse such claims are limited.
We use data from three comparable cohorts from Great Britain and the USA to provide a generalized estimate of the impact of educational benefits on adult fluid cognition after adjusting for adolescent cognition.
The educational benefit remains qualitatively large after adjustment for adolescent cognition: a person with average adolescent cognition who earns a university degree can expect similar adult fluid cognition as someone with adolescent cognition measuring 0.5 to 1.5 standard deviations (SDs) higher who did not go to university.
We also find that the educational benefit can be modified by contextual circumstances: women benefit more in the 1946 G.B. cohort when very few women attended university, and respondents with lower adolescent cognition benefit more in the U.S. 1939 cohort.
Supplementary Material
References
- 1.Deary I, Johnson W. Intelligence and education: causal perceptions drive analytic processes and therefore conclusions. Int J Epidemiol. 2010;39:1362–69. doi: 10.1093/ije/dyq072. [DOI] [PubMed] [Google Scholar]
- 2.De Graaf N, De Graaf P, Kraaykamp G. Parental cultural capital and educational attainment in the Netherlands: a refinement of the cultural capital perspective. Sociol Educ. 2000;73:92–111. [Google Scholar]
- 3.Deary I, Strand S, Smith P, Fernandes C. Intelligence and educational achievement. Intelligence. 2007;35:13–21. [Google Scholar]
- 4.Feinstein L. Inequality in the early cognitive development of British children in the 1970 cohort. Economica. 2003;70:73–97. [Google Scholar]
- 5.Tucker-Drob EM, Rhemtulla M, Harden KP, Turkheimer E, Fask D. Emergence of a gene x socioeconomic status interaction on infant mental ability between 10 months and 2 years. Psychol Sci. 2011;22:125–33. doi: 10.1177/0956797610392926. [DOI] [PMC free article] [PubMed] [Google Scholar]
- 6.Richards M, Sacker A. Is education causal? Yes. Int J Epidemiol. 2011;40:516–18. doi: 10.1093/ije/dyq166. [DOI] [PubMed] [Google Scholar]
- 7.Hatch SL, Feinstein L, Link BG, Wadsworth MEJ, Richards M. The continuing benefits of education: adult education and midlife cognitive ability in the British 1946 birth cohort. J Gerontol B Psychol Sci Soc Sci. 2007;62: S404–14. doi: 10.1093/geronb/62.6.s404. [DOI] [PMC free article] [PubMed] [Google Scholar]
- 8.Stern Y. Cognitive reserve. Neuropsychologia. 2009;47:2015–28. doi: 10.1016/j.neuropsychologia.2009.03.004. [DOI] [PMC free article] [PubMed] [Google Scholar]
- 9.Kuh D, Pierce M, Adams J, et al. Cohort Profile: updating the cohort profile for the MRC National Survey of Health and Development: a new clinic-based data collection for ageing research. Int J Epidemiol. 2011;40:e1–9. doi: 10.1093/ije/dyq231. [DOI] [PMC free article] [PubMed] [Google Scholar]
- 10.Welshman J. Time, Money and Social Science: the British Birth Cohort Surveys of 1946 and 1958. Soc Hist Med. 2011;25:175–92. [Google Scholar]
- 11.Power C, Elliott J. Cohort Profile: 1958 British birth cohort (National Child Development Study) Int J Epidemiol. 2006;35:34. doi: 10.1093/ije/dyi183. [DOI] [PubMed] [Google Scholar]
- 12.Sewell WH, Hauser RM, Springer KW, Hauser TS. As we age: a review of the Wisconsin Longitudinal Study, 1957-2001. Res Soc Stratif Mobil. 2003;20:3–111. [Google Scholar]
- 13.Morgan SL, Winship C. Counterfactuals and Causal Inference: Methods and Principles for Social Research. Cambridge: Cambridge University Press; 2007. [Google Scholar]
- 14.Rubin DB. Bayesian inference for causal effects: the role of randomization. Ann Stat. 1978;6:34–58. [Google Scholar]
- 15.Rosenbaum PR, Rubin DB. The central role of the propensity score in observational studies for causal effects. Biometrika. 1983;70:41. [Google Scholar]
- 16.Rubin DB. The design versus the analysis of observational studies for causal effects: parallels with the design of randomized trials. Stat Med. 2007;26:20–36. doi: 10.1002/sim.2739. [DOI] [PubMed] [Google Scholar]
- 17.Robins JM. Association, causation, and marginal structural models. Synthese. 1999;121:151–79. [Google Scholar]
- 18.Vanderweele TJ, Robins JM. Empirical and counterfactual conditions for sufficient cause interactions. Biometrika. 2008;95:49. [Google Scholar]
- 19.Robins J, Richardson T, Spirtes P. On Identification and Inference for Direct Effects. Washington: University of Washington; 2009. [Google Scholar]
- 20.Heckman JJ. Skill formation and the economics of investing in disadvantaged children. Science. 2006;312:1900–02. doi: 10.1126/science.1128898. [DOI] [PubMed] [Google Scholar]
- 21.Brown M, Dodgeon B. NCDS Cognitive Assessments at Age 50: Initial Results. CLS Working Paper 2010/1. London: Centre for Longitudinal Studies; 2010. [Google Scholar]
- 22.Singh-Manoux A, Kivimaki M, Glymour MM, et al. Timing of onset of cognitive decline: results from Whitehall II prospective cohort study. BMJ. 2012;344:d7622. doi: 10.1136/bmj.d7622. [DOI] [PMC free article] [PubMed] [Google Scholar]
- 23.Thorvaldsson V, Hofer S, Berg S, Skoog I, Sacuiu S, Johansson B. Onset of terminal decline in cognitive abilities in individuals without dementia. Neurology. 2008;71:882–87. doi: 10.1212/01.wnl.0000312379.02302.ba. [DOI] [PubMed] [Google Scholar]
- 24.WHO. Life Expectancy. Global Health Observatory Data Repository. Geneva, Switzerland: World Health Organization; 2011. [Google Scholar]
- 25.Heckman J, Stixrud J, Urzua S. The effects of cognitive and noncognitive abilities on labor market outcomes and social behavior. J Labor Econ. 2006;24:411–82. [Google Scholar]
- 26.Cunha F, Heckman JJ, Schennach SM. Estimating the technology of cognitive and noncognitive skill formation. Econometrica. 2010;78:883–931. doi: 10.3982/ECTA6551. [DOI] [PMC free article] [PubMed] [Google Scholar]
- 27.Jerrim J, Vignoles A. The use and misuse of statistics in understanding social mobility: regression to the mean and the cognitive development of high ability children from disadvantaged homes. London: DoQS Sciences, Institute of Education; 2011. [Google Scholar]
- 28.Tucker-Drob EM, Rhemtulla M, Harden KP, Turkheimer E, Fask D. Emergence of a gene x socioeconomic status interaction on infant mental ability between 10 months and 2 years. Psychol Sci. 2011;22:125–33. doi: 10.1177/0956797610392926. [DOI] [PMC free article] [PubMed] [Google Scholar]
- 29.Glymour MM, Kawachi I, Jencks CS, Berkman LF. Does childhood schooling affect old age memory or mental status? Using state schooling laws as natural experiments. J Epidemiol Community Health. 2008;62:532–37. doi: 10.1136/jech.2006.059469. [DOI] [PMC free article] [PubMed] [Google Scholar]
- 30.Richards M, Sacker A. Lifetime antecedents of cognitive reserve. J Clin Exp Neuropsychol. 2003;25:614–24. doi: 10.1076/jcen.25.5.614.14581. [DOI] [PubMed] [Google Scholar]
- 31.Richards M, Power C, Sacker A. Paths to literacy and numeracy problems: evidence from two British birth cohorts. J Epidemiol Community Health. 2009;63:239–44. doi: 10.1136/jech.2007.064923. [DOI] [PMC free article] [PubMed] [Google Scholar]
- 32.Psacharopoulos G, Patrinos H. Returns to investment in education: a further update. Educ Econ. 2004;12:111–34. [Google Scholar]
- 33.Psacharopoulos G. Returns to investment in education: a global update. World Dev. 1994;22:1325–43. [Google Scholar]
- 34.Link B, Phelan J. Social conditions as fundamental causes of disease. J Health Soc Behav. 1995:80–94. [PubMed] [Google Scholar]
- 35.Phelan J, Link BG, Tehranifar P. Social conditions as fundamental causes of health inequalities: theory, evidence, and policy implications. J Health Soc Behav. 2010;51(Suppl 1):S28–40. doi: 10.1177/0022146510383498. [DOI] [PubMed] [Google Scholar]
- 36.Marmot M, Wilkinson R. Social Determinants of Health. New York, NY, USA: Oxford University Press; 2006. [Google Scholar]
- 37.Mirowsky J, Ross CE. Education, Social Status, and Health. Hawthorne, NY, USA: Aldine; 2003. [Google Scholar]
- 38.Becker G. Human Capital. Chicago: University of Chicago Press; 1980. [Google Scholar]
- 39.Keeley B. Human Capital: How What You Know Shapes Your Life. Danvers, MA, USA: OECD Publishing; 2007. [Google Scholar]
- 40.Heckman JJ, Moon SH, Pinto R, Savelyev PA, Yavitz A. The rate of return to the HighScope Perry Preschool Program. J Public Econ. 2010;94:114–28. doi: 10.1016/j.jpubeco.2009.11.001. [DOI] [PMC free article] [PubMed] [Google Scholar]
- 41.Lynch J, Kaplan G, Salonen J. Why do poor people behave poorly? Variation in adult health behaviours and psychosocial characteristics by stages of the socioeconomic lifecourse. Soc Sci Med. 1997;44:809–19. doi: 10.1016/s0277-9536(96)00191-8. [DOI] [PubMed] [Google Scholar]
- 42.Entwisle D, Alexander K. Summer setback: race, poverty, school composition, and mathematics achievement in the first two years of school. Am Sociol Rev. 1992;57:72–84. [Google Scholar]
- 43.Cooper H, Nye B, Charlton K, Lindsay J, Greathouse S. The effects of summer vacation on achievement test scores: a narrative and meta-analytic review. Rev Educ Res. 1996;66:227–68. [Google Scholar]
- 44.Downey DB, von Hippel PT, Broh BA. Are schools the great equalizer? Cognitive inequality during the summer months and the school year. Am Sociol Rev. 2004;69:613–35. [Google Scholar]
- 45.Jaeggi SM, Buschkuehl M, Jonides J, Perrig WJ. Improving fluid intelligence with training on working memory. Proc Natl Acad Sci U S A. 2008;105:6829–33. doi: 10.1073/pnas.0801268105. [DOI] [PMC free article] [PubMed] [Google Scholar]
- 46.Sewell WH, Hauser RM. Education, Occupation, and Earnings: Achievement in the Early Career. New York: Academic Press; 1975. [Google Scholar]
Associated Data
This section collects any data citations, data availability statements, or supplementary materials included in this article.