Abstract
Inflammation plays a major role in immune-mediated liver injury, and exposure to environmental pollutants such as 2, 3, 7, 8-tetrachlorodibenzo-p-dioxin (TCDD) has been reported to alter the inflammatory response as well as affect immune cell activity. In this study, we tested the hypothesis that TCDD pretreatment exacerbates hepatotoxicity in a murine model of immune-mediated liver injury induced by concanavalin A (Con A) administration. Mice were pretreated with 30µg/kg TCDD or vehicle control on day zero and then given either Con A or saline intravenously on day four. Mice treated with TCDD did not develop liver injury; however, TCDD-pretreatment increased liver injury resulting from moderate doses of Con A (4–10 mg/kg). TCDD-pretreated mice had altered plasma concentrations of inflammatory cytokines, including interferon gamma (IFNγ), and TCDD/Con A-induced hepatotoxicity was attenuated in IFNγ knockout mice. At various times after treatment, intrahepatic immune cells were isolated, and expression of cell activation markers as well as cytolytic proteins was determined. TCDD pretreatment increased the proportion of activated natural killer T (NKT) cells and the percent of cells expressing Fas ligand (FasL) after Con A administration. In addition FasL knockout mice and mice treated with CD18 antiserum were both protected from TCDD/Con A-induced hepatotoxicity, suggesting a requirement for direct cell-cell interaction between effector immune cells and parenchymal cell targets in the development of liver injury from TCDD/Con A treatment. In summary, exposure to TCDD increased NKT cell activation and exacerbated immune-mediated liver injury induced by Con A through a mechanism involving IFNγ and FasL expression.
Keywords: 2, 3, 7, 8-TCDD; concanavalin A; hepatotoxicity; innate immunity; inflammatory cytokines
Introduction
The liver is a major site of immune cell activity and surveillance. In many inflammatory liver diseases such as viral and autoimmune hepatitis, cells of both the innate and adaptive immune system contribute significantly to the development of liver injury (Rehermann and Nascimbeni, 2005; Dong et al., 2007). The inability of the hepatic immune cells to manage inflammatory stress is a key component in the progression of these diseases (Santodomingo-Garzon and Swain, 2011). Exogenous factors that affect the ability of immune cells to regulate the inflammatory response can be important contributors to sensitivity to inflammatory liver injury and disease. One factor that can affect immune cells is exposure to persistent environmental pollutants such as 2, 3, 7, 8-tetrachlorodibenzo-p-dioxin (TCDD) or other aryl hydrocarbon receptor (AhR) ligands (Esser et al., 2009; Veldhoen and Duarte, 2010). TCDD exposure and AhR activation have been linked to a number of adverse effects in both animals (Poland and Glover, 1980) and humans (Sweeney and Mocarelli, 2000).
In addition to developmental and reproductive toxicity, TCDD has been widely studied in animal models for its ability to alter the function of numerous immune cell types (Birnbaum and Tuomisto, 2000). Pretreatment of mice with AhR ligands enhanced the accumulation of neutrophils and increased the severity of lung injury from influenza virus infection (Teske et al., 2005). AhR activation also exacerbated pathology in experimental autoimmune encephalomyelitis (Veldhoen et al., 2008). Furthermore, TCDD increased inflammatory stress in mice after administration of bacterial lipopolysaccharide or sheep red blood cells (Clark et al., 1991; Moos et al., 1994; Olivero-Verbel et al., 2011). However, whereas the liver is known to be both a major site of TCDD accumulation and an important target organ for the toxicity of AhR ligands (Gasiewicz et al., 1983), the effects of TCDD exposure on the activation and function of hepatic lymphocytes during inflammatory liver injury has not been extensively evaluated.
In this study, we tested the hypothesis that TCDD pretreatment exacerbates hepatotoxicity in a murine model of immune-mediated liver injury induced by concanavalin A (Con A) administration. Con A administration is a widely used animal model of liver injury with mechanisms and pathology resembling immune-mediated hepatitis (Tiegs et al., 1992). Con A-induced hepatitis largely depends on the activation of innate immune cells, which have received far less attention in studies of TCDD exposure than cells of the adaptive immune system. This model of inflammatory injury is characterized by strong immune-mediated killing of hepatocytes through direct cell cytolytic processes, as well as the production of inflammatory cytokines (Tiegs et al., 1992; Mizuhara et al., 1994; Kusters et al., 1996; Seino et al., 1997). The various mechanisms involved in the development of Con A-induced hepatitis allow for an in-depth analysis of the modes of action through which TCDD alters the immune response to influence the development of liver injury. The ability of TCDD to perturb any of the key mechanisms involved in the inflammatory response to Con A, such as the production of inflammatory and protective cytokines, activation of immune effector cells, and regulation of cell cytolytic activity towards hepatic parenchymal cells, was also evaluated.
Materials and methods
Materials
All chemicals were purchased from Sigma-Aldrich (St. Louis, MO) unless otherwise stated. TCDD (Accustandard, New Haven, CT) was dissolved in DMSO and diluted in olive oil to a 0.2 µg/mL working solution. Rabbit anti-murine CD18 antiserum was purchased from New England Peptide (Gardner, MA).
Mice
Unless otherwise stated, all experiments were performed using male C57BL/6J mice. All mice were purchased from The Jackson Laboratory (Bar Harbor, ME) and used at 10–12 weeks of age. Upon arrival, wild-type, Ifngtm1Ts, C57BL/6-PRF1tm1Sdz/J, B6Smn.C3-Faslgld/J mice were acclimated for at least one week in a 12 h light/dark cycle with access to Global Rodent diet 2018 (Harlan Teklad, Madison, WI) and spring water ad libitum. All procedures were carried out with the approval of the Michigan State University Institutional Animal Care and Use Committee.
Experimental Protocols
A single administration of 3 or 30 µg/kg TCDD or olive oil (vehicle) was given via oral gavage 4 days before Con A or saline administration. During that 4-day period, TCDD- treated mice were housed separately from vehicle-treated mice. Con A (Lot 096K7011) was dissolved in saline at a concentration of 1.0 mg/mL and administered intravenously at a dose of 6.0 mg/kg body weight (unless otherwise stated). Activity of alanine aminotransferase (ALT) in plasma was measured spectrophotometrically using Infinity-ALT reagent (Thermo Fisher Scientific, Waltham, MA). In CD18 neutralization experiments, 15 h before and 2 h after Con A administration, mice were treated intraperitoneally with 200 µL of a rabbit antiserum designed against amino acids 89-100 of murine CD18. Control mice were treated with equivalent volume of normal rabbit serum. The dosing protocol for CD18 neutralization was adopted from previous studies in our laboratory in which the antiserum effectively prevented leukocyte accumulation in the liver as determined by histopathological examination and immunohistochemistry (Shaw et al., 2009).
Histopathology
Left lateral liver lobes were fixed in neutral buffered formalin for 24 h and paraffin-embedded. Lobes were sectioned and stained with hematoxylin and eosin. The sections were examined by light microscopy. Histopathology sections presented are from mice with plasma ALT activity corresponding closely with the average of each respective treatment group.
Cytokine Analysis
OptEIA ELISA kits purchased from BD (Franklin Lakes, NJ) were used to measure plasma concentrations of interferon gamma (IFNγ). Plasma concentrations of tumor necrosis factor alpha (TNFα), interleukin-2 (IL-2), interleukin-4 (IL-4), interleukin-10 (IL-10) and interleukin-6 (IL-6) were measured using a bead-based Milliplex MAP immunodetection array purchased from Millipore (Billerica, MA) and run on a Bio-Plex instrument (Bio-Rad, Hercules, CA).
RNA Isolation and RT-PCR Analysis
Liver samples were placed in TRI reagent (Molecular Research Center, Cincinnati, OH) and homogenized. Total RNA was isolated according to manufacturer’s instructions. Isolated RNA was analyzed using a nanodrop spectrophotometer (Thermo Scientific, Waltham, MA) to determine quantity and quality. iScript reverse transcription supermix for RT-qPCR (Bio-Rad Laboratories, Hercules, CA) was used to prepare cDNA from 1 µg of RNA. The expression levels of target genes were determined using specific DNA oligos and SYBR green PCR master mix (Applied Biosystems, Foster City CA) on a Step-One real-time PCR system (Applied Biosystems). Copy number was determined by comparison to standard curves of the respective genes generated from pooled cDNA. Target gene expression levels were standardized to the geometric mean of glyceraldehyde-3-phosphate dehydrogenase (Gapdh), beta-actin (Actb) and hypoxanthine guanine phosphoribosyl transferase (Hprt) gene expression. To evaluate the expression of target genes the following PCR primers were used: Gapdh (115 bp), 5’-TCAACAGCAACTCCCACTCTTCCA-3’ (forward), 5’-ACCCTGTTGCTGTAGCCGTATTCA-3’ (reverse); Actb (140 bp), 5’-TGTGATGGTGGGAATGGGTCAGAA-3’ (forward), 5’-TGTGGTGCCAGATCTTCTCCATGT-3’ (reverse); Hprt (133 bp), 5’-GGAGTCCTGTTGATGTTGCCAGTA-3’ (forward), 5’-GGGACGCAGCAACTGACATTTCTA-3’ (reverse); IL-17A, Il17a (101 bp), 5’-TCCAGAAGGCCCTCAGACTA-3’ (forward), 5’-TGAGCTTCCCAGATCACAGA-3’ (reverse); IL-22, Il22 (107 bp) 5’-GCTCAGCTCCTGTCACATCA-3’ (forward), 5’-TCGCCTTGATCTCTCCACTC-3’ (reverse); intercellular adhesion molecule 1, Icam1 (160 bp) 5’-AGATCACATTCACGGTGCTGGCTA-3’ (forward), 5’-AGCTTTGGGATGGTAGCTGGAAGA-3’ (reverse); perforin, Prf1 (155 bp), 5’-AGCCAGCGTCTCCAGTGAATACAA-3’ (forward), 5’-TAGCTTGGTTCCCGAAGAGCAGAT-3’ (reverse); granzyme B, Gzmb (127 bp), 5’-AGAATGTTTGCATTGGAGCTGGGC-3’ (forward), 5’-ACATCAGCAACTTGGGTGCAACTG-3’ (reverse); Fas receptor, Fas (100 bp), 5’-AGTTTAAAGCTGAGGAGGCGGGTT-3’ (forward), 5’-TTTCAGGTTGGCATGGTTGACAGC-3’ (reverse). Data are reported as fold-change ofstandardized treatment over standardized Vehicle/Saline or Vehicle/Con A at 0 h for time course studies.
Flow Cytometry
Flow cytometry was performed on hepatic leukocytes isolated and prepared as follows. Mouse livers were collected into RPMI medium supplemented with 5% fetal bovine serum (FBS) and 1% penicillin/streptomycin. The livers were passed through a nylon mesh, and the cell suspension was centrifuged at 50xg for 5 minutes to remove hepatocytes. The remaining leukocytes were centrifuged at 450xg and incubated with red cell lysis buffer (BioLegend, San Diego, CA) for 3 minutes followed by 2 washes with phosphate buffered saline supplemented with 5% FBS. The leukocyte cell suspension was separated using lympholyte-M (Cedar Lane, Burlington, Ontario, Canada) according to the manufacturer’s instructions. The prepared hepatic leukocytes were first stained with TruStain FcX (anti-mouse CD16/CD32) to avoid nonspecific staining of Fcγ receptors. Leukocytes were then stained with fluorescein isothiocyanate-conjugated anti-NK1.1 (PK136) and allophycocyanin-cyanine dye 7-conjugated anti-CD3epsilon (145-2c11). In some experiments cells were also stained with phycoerythrin-conjugated anti-Fas Ligand (MFL3), pacific blue-conjugated anti-CD69 (H1.2F3) or pacific blueconjugated anti-CD25 (PC61). Intracellular perforin staining was performed using phycoerythrin-conjugated anti-perforin (eBioOMAK-D) (ebiosciences, San Diego, CA) and BD Cytofix/Cytoperm kit (Becton Dickinson, Franklin Lakes, NJ). Intracellular staining requires incubation of the leukocytes in culture with protein transport inhibitor cocktail (ebiosciences, San Diego, CA) after isolation; accordingly leukocytes were isolated at an earlier time point than cells collected for other flow cytometry measurements. Appropriate fluorescent-conjugated isotype controls were used to establish positive and negative gating parameters. All reagents and antibodies for flow cytometry staining were obtained from BioLegend (San Diego, CA) unless otherwise indicated. Staining was performed according to manufacturer’s directions, and samples were analyzed on a BD FACSCanto II with data analysis performed using Kaluza software (Beckman Coulter, Brea, CA).
Statistical Analyses
Results are expressed as mean ± S.E.M. Percentile data were subjected to arcsine transformation. When necessary, data were normalized by Box-Cox transformation using R-stats server (R Foundation for Statistical Computing, Vienna, Austria). Analysis of data was performed using either student’s t-test or two-way analysis of variance (ANOVA) followed by pairwise multiple comparisons using the Student-Newman-Keuls or Tukey’s method where appropriate. Non-parametric data were analyzed using Kruskal-Wallis test followed by pairwise multiple comparisons using Tukey’s or Dunn’s method where appropriate. The criterion for statistical significance was p<0.05.
Results
The effect of TCDD pretreatment on sensitivity of mice to Con A-induced hepatotoxicity
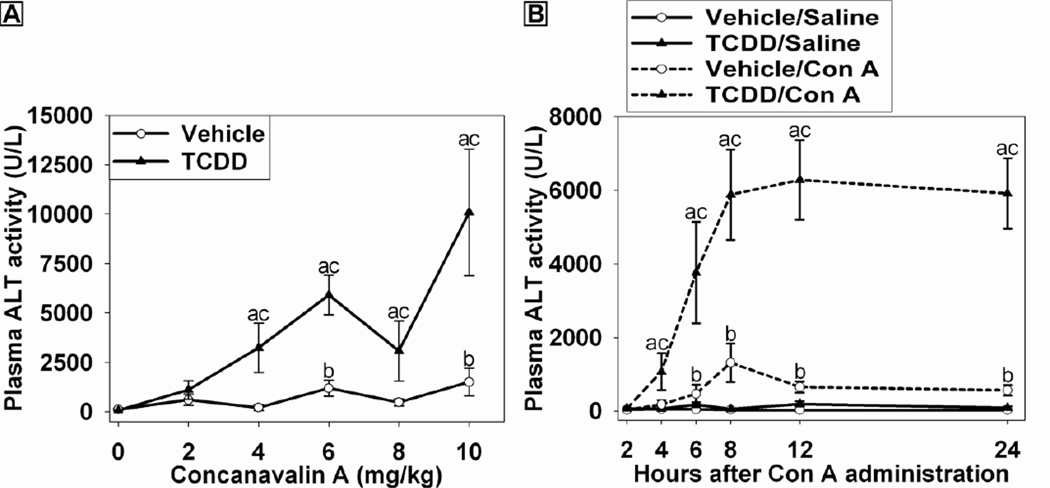
To determine the effect of TCDD pretreatment on Con A-induced liver injury, mice were treated with vehicle (olive oil) or 30 µg/kg TCDD 96 h (4 days) before the administration of increasing doses of Con A (0–10 mg/kg) and euthanized 24 h later. This dosing protocol was chosen based on the observation that, after administration of 30 µg/kg of TCDD, the concentration of TCDD in the liver increases through 72 h (Boverhof et al., 2005). Accordingly, 96 h represents a time close to the maximum accumulation of TCDD in the liver. As shown in Figure 1A, TCDD treatment alone was not hepatotoxic at the dose employed. Con A at doses of 6 or 10 mg/kg in vehicle-pretreated mice resulted in a moderate elevation of ALT activity in plasma. In mice pretreated with TCDD, sensitivity to Con A was increased such that 4 mg/kg Con A caused a significant increase in ALT activity in plasma. Furthermore, TCDD-pretreated mice had greater ALT activity compared to vehicle-pretreated mice at all Con A doses from 4 to 10 mg/kg. A dose of 6 mg/kg Con A was chosen for all subsequent studies because larger doses sometimes led to death before 24 h in the TCDD-pretreated mice. In preliminary studies, we demonstrated that TCDD pretreatment at 3 µg/kg also sensitized mice to Con A-induced hepatitis: ALT activity in plasma of mice treated with Vehicle/Con A was 171 ± 100 U/L, and in mice treated with 3 µg/kg TCDD/Con A it was 2479 ± 1617 U/L). However, at the smaller dose of TCDD the response was more variable than at the 30 µg/kg dose used in the rest of this study.
Figure 1. Dose-response and time course of Con A-induced liver injury in the presence and absence of TCDD.
(A) Mice were treated on Day 0 with either 30 µg/kg TCDD or vehicle. Four days later mice received Con A at doses from 0-10 mg/kg. ALT activity in plasma was measured 24 h after Con A administration. a p < 0.05 TCDD/Con A versus TCDD/Saline. b p < 0.05 Vehicle/Con A versus Vehicle/Saline. c p < 0.05 TCDD/Con A versus Vehicle/Con A at the same dose. Data represent the mean ± SE of independent replicates from 2 separate experiments. At each dose: Vehicle/Con A n=3–5 and TCDD/Con A n=3–5.
(B) Mice were treated with vehicle (open circle) or 30 µg/kg TCDD (black triangle) on day 0. On day 4, pretreated mice were administered saline (solid line) or 6 mg/kg Con A (dashed line). Plasma was collected at the times indicated, and ALT activity was determined. a p < 0.05 TCDD/Con A versus TCDD/Saline at the same time point. b p < 0.05 Vehicle/Con A versus Vehicle/Saline at the same time point. c p < 0.05 TCDD/Con A versus Vehicle/Con A at the same time point. Data represent the mean ± SE of independent replicates from 2 separate experiments. At each time point: Vehicle/Saline n=4–5, TCDD/Saline n=4–5, Vehicle/Con A n=5–9, and TCDD/Con A n=5–9.
The development of injury in TCDD/Con A-treated mice
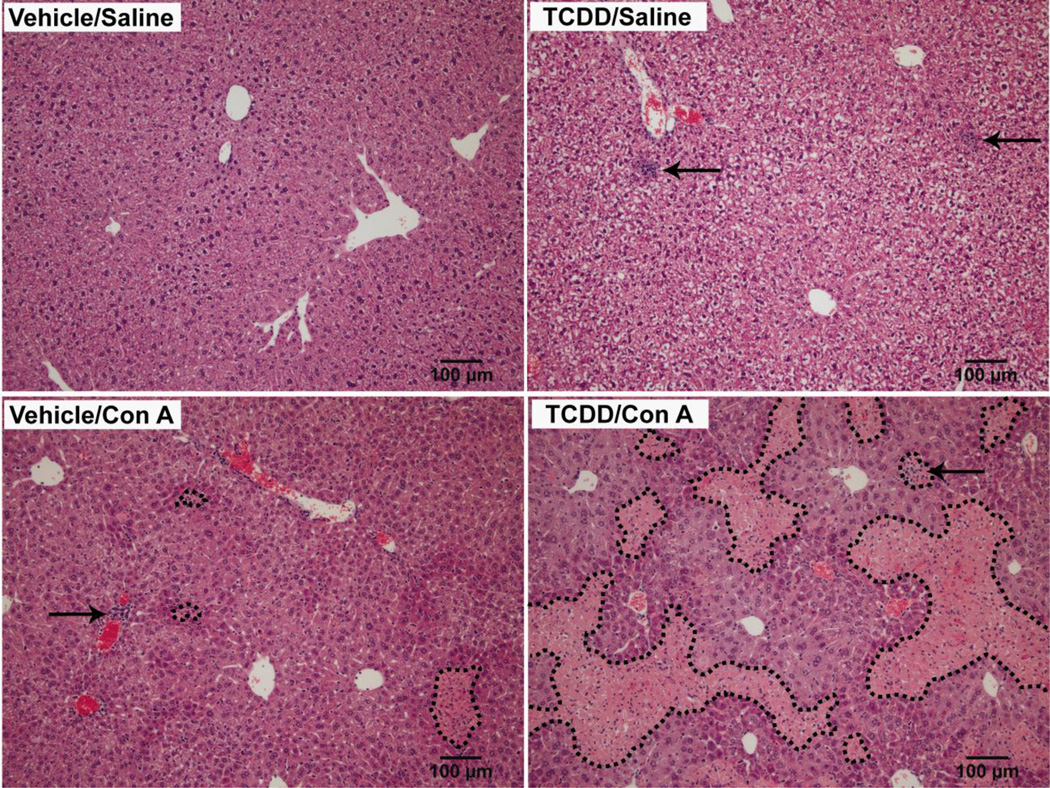
TCDD pretreatment alone caused no change in plasma ALT activity compared to vehicle pretreatment throughout the time course (Figure 1B). Con A caused a moderate increase in ALT activity in plasma by 6 h after administration, and this was sustained through 24 h. In TCDD/Con A-treated mice, plasma ALT activity was increased earlier, at 4 h after Con A administration, and continued to increase through 8h then maintained at a plateau through 24 h. ALT activity in TCDD/Con A-treated mice was increased compared to all other groups at all times from 4–24 h. Histopathological examination of liver sections (Figure 2) revealed that TCDD pretreatment caused no hepatocellular necrosis but increased the appearance of intermittent foci of leukocytes compared to the livers of vehicle-pretreated mice. In Vehicle/Con A-treated and TCDD/Con A-treated mice, histopathology results reflected with the plasma ALT activity. Vehicle/Con A treatment resulted in focal areas of necrosis and leukocyte accumulation that were more common near the periphery of the liver lobules. In TCDD/Con A-cotreated mice, there were extensive areas of midzonal hepatocellular necrosis with infiltration of leukocytes in the necrotic regions. In addition, although not easily seen in the images shown in Figure 2, foci of infiltrating leukocytes were observed in both Vehicle/Con A and TCDD/Con A that were not localized to areas of hepatocellular necrosis.
Figure 2. Histopathology of TCDD/Con A-induced liver injury.
Mice were treated on day 0 with vehicle or 30 µg/kg TCDD and on day 4 with Saline or 6 mg/kg Con A. Liver sections were collected 24 h after Saline or Con A administration. H&E stained sections were photographed at 10x magnification. Dotted lines mark necrotic areas. Arrows indicate foci of leukocyte infiltration.
The effect of TCDD pretreatment on the inflammatory cytokine response to Con A administration
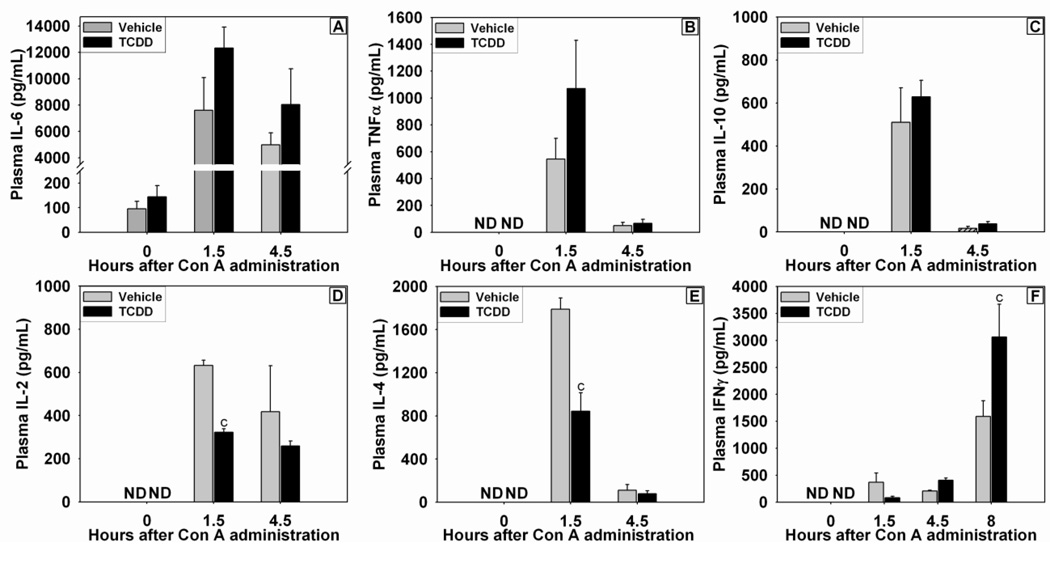
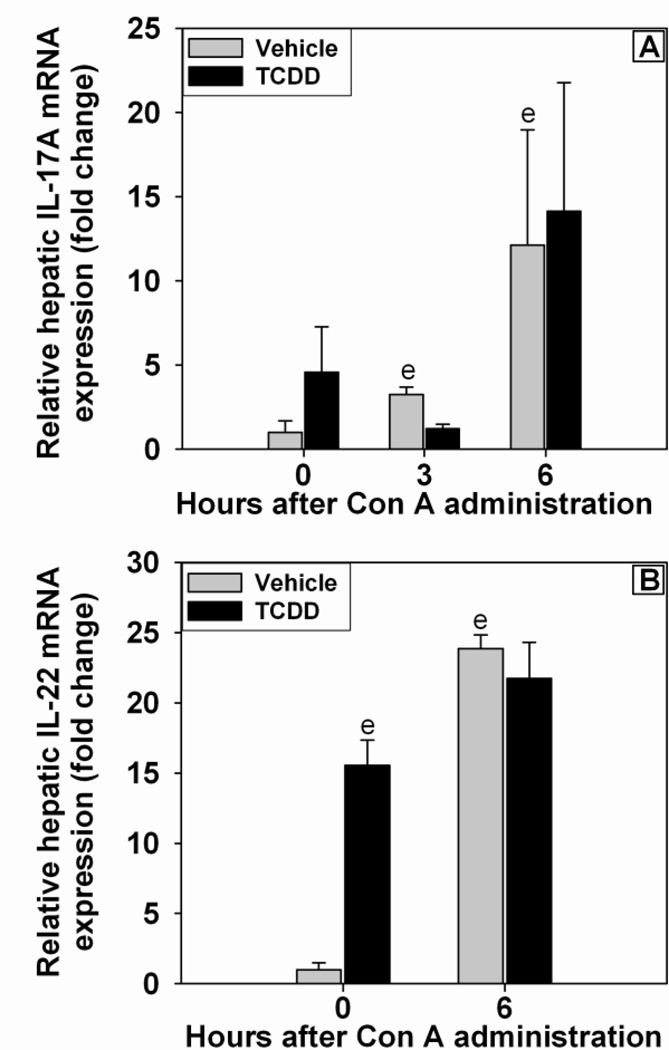
Inflammatory cytokines were assessed at times previously reported to be the peak plasma concentrations following Con A administration (Sass et al., 2002). TCDD pretreatment alone did not cause an increase in plasma IL-6 concentration (Figure 3A). The concentration of IL-6 in plasma was increased at 1.5 h after Con A administration and remained elevated at 4.5 h. The plasma concentrations of TNFα and IL-10 were not detectable in either Vehicle/Saline or TCDD/Saline control groups (Figure 3B and C). Concentrations of TNFα and IL-10 were increased at 1.5 h after Con A administration and had returned toward baseline by 4.5 h. The increase in these three cytokines by Con A was not altered by TCDD pretreatment. The plasma concentrations of Th1- and Th2-related cytokines, IL-2 and IL-4, respectively, were increased by Con A at 1.5 h; this effect was reduced by TCDD pretreatment (Figures 3D and E). Con A administration resulted in increased concentration of IFNγ in plasma at 1.5, 4.5, and 8 h after treatment, and at 8 h pretreatment with TCDD enhanced this effect (Figure 3F). Because of the well-characterized role of Th17 cells in immune modulation following AhR activation (Veldhoen et al., 2008), the hepatic expression of IL-17A and IL-22 mRNA (Figure 4A and B) was assessed. Hepatic IL-17A expression was increased after Con A administration, and TCDD pretreatment did not alter that induction. TCDD pretreatment alone increased the hepatic expression of IL-22 mRNA in the absence of Con A. Con A treatment led to a significant increase in IL-22 mRNA by 6 h, and this was not affected by TCDD pretreatment.
Figure 3. Concentrations of IL-6 (A), TNFα (B), IL-10 (C), IL-2 (D), IL-4 (E), and IFNγ (F) in plasma after Con A administration.
Mice were treated as described in the legend to Figure 2 with Vehicle/Con A (grey bars) or TCDD/Con A (black bars). c p < 0.05 Vehicle/Con A versus TCDD/Con A at the same time point. ND= Not Detected (value below the limit of detection). Data represent the mean ± SE of independent replicates from 2 separate experiments. At each time point: Vehicle/Con A n=3–5 and TCDD/Con A n=3–5.
Figure 4. Expression of IL-17A (A) and IL-22 (B) mRNA in liver after Con A administration.
Mice were treated as described in the legend to Figure 2 with Vehicle/Con A (grey bars) or TCDD/Con A (black bars). e p < 0.05 versus Vehicle treatment at 0 h. Data represent the mean ± SE of independent replicates from 2 separate experiments. At each time point: Vehicle/Con A n=4–6 and TCDD/Con A n=4–6.
The role of IFNγ in the development of TCDD/Con A-induced liver injury
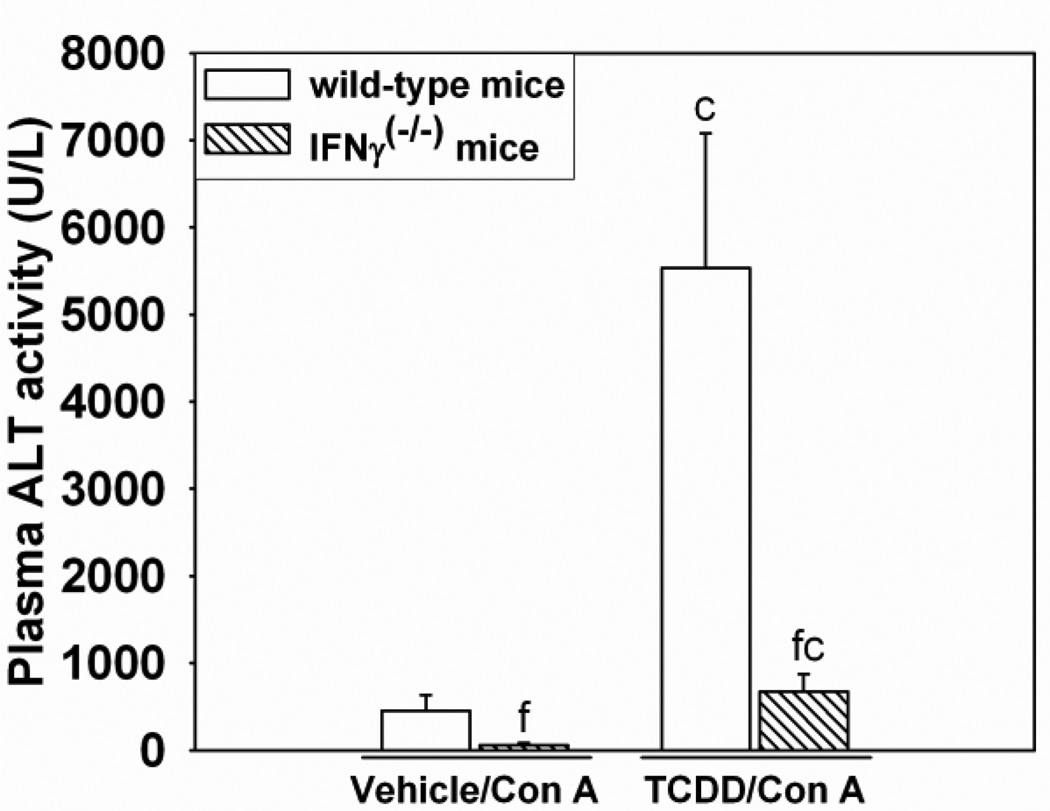
Since TCDD enhanced the Con A-mediated increase in IFNγ in plasma and because previous studies demonstrated the importance of IFNγ in inflammatory liver injury after Con A administration (Kusters et al., 1996), the role of IFNγ in the development of TCDD/Con Ainduced injury was investigated using Ifngtm1Ts (IFNγ knockout) mice. As shown in Figure 5, 24 h after TCDD/Con A-treatment, IFNγ knockout mice had decreased plasma ALT activity compared to wild-type mice. These findings were consistent with observations from histological examination of liver sections in which TCDD/Con A-treated IFNγ knockout mice had less necrosis compared to TCDD/Con A-treated wild-type mice (Supplemental Data Figure 1).
Figure 5. Liver injury after TCDD/Con A treatment in IFNγ (−/−) mice.
Wild-type (open bars) or IFNγ knockout ( IFNγ (−/−); hatched bars) mice were treated as described in the legend to Figure 2 with Vehicle/Con A or TCDD/Con A, and plasma ALT activity was measured 24 h after Con A administration. c p < 0.05 TCDD/Con A versus Vehicle/Con A in the same mouse genotype. f p < 0.05 versus the same treatment in the wild-type control. Data represent the mean ± SE of independent replicates. For each genotype: Vehicle/Con A n=7–9, TCDD/Con A n=5–7.
The role of hepatic lymphocytes in TCDD/Con A-induced hepatotoxicity
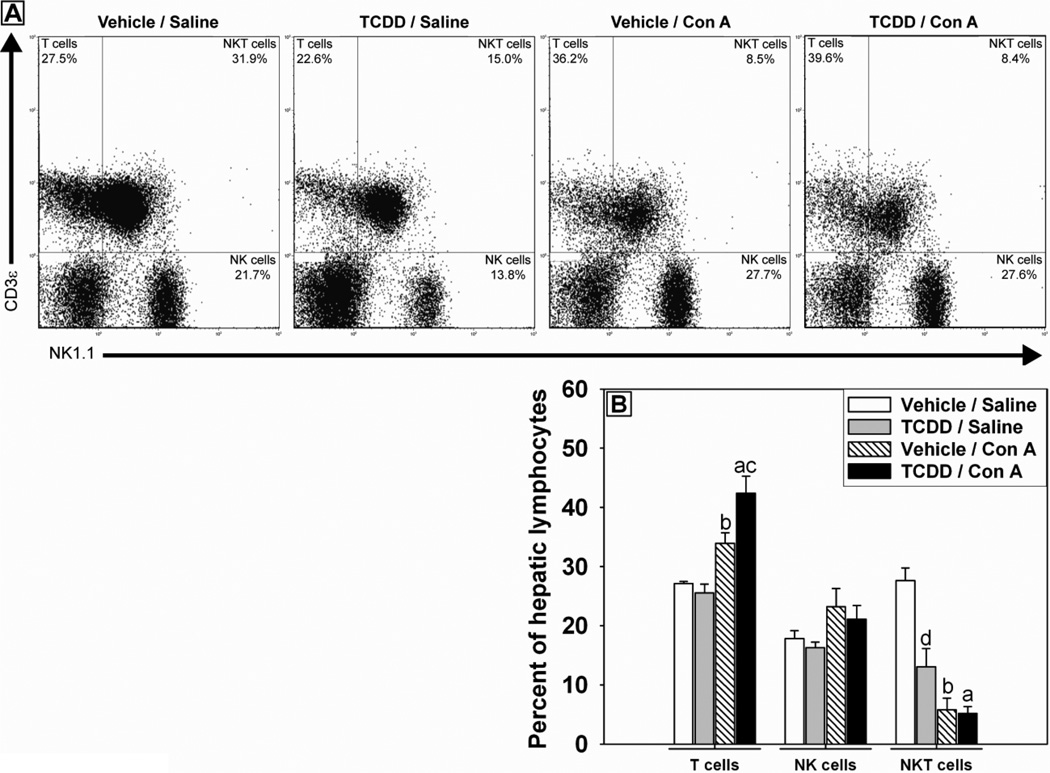
To determine if the response of hepatic lymphocytes to Con A administration was altered by TCDD pretreatment, lymphocytes were isolated from liver after Con A or saline administration in vehicle or TCDD-pretreated mice. Flow cytometry was used to investigate the composition of hepatic immune cells by staining for expression of NK1.1 and CD3ε to identify natural killer (NK) cells (NK1.1+, CD3ε-), NKT cells (NK1.1+, CD3ε+) and T cells (NK1.1-, CD3ε+). Con A administration caused a decrease in the percentage of NKT cells and increased the percentage of T cells (Figure 6A and B). TCDD/Saline-treated mice had a smaller percentage of NKT cells in their livers compared to Vehicle/Saline-treated mice. TCDD-pretreatment significantly increased the percentage of T cells observed in the livers of mice 4 h after Con A administration (Figure 6A and B).
Figure 6. Hepatic lymphocyte populations after treatment with Con A in the presence and absence of TCDD.
Mice were treated as described in the legend to Figure 2 with Vehicle/Saline, TCDD/Saline, Vehicle/Con A or TCDD/Con A. Hepatic lymphocytes were isolated from mice 4 h following Con A or saline administration. Lymphocytes were stained with fluorescently labeled anti-NK1.1 and anti-CD3ε antibodies to determine the relative numbers of NKT cells (NK1.1 +, CD3ε +), T cells (NK1.1 −, CD3ε +) and NK cells (NK1.1 +, CD3ε −). (A) Representative quadrant plots show gated lymphocyte populations for each treatment group. (B) Percent of T cell, NK cell, and NKT cell populations comprising total isolated hepatic lymphocytes. a p < 0.05 TCDD/Con A versus TCDD/Saline. b p < 0.05 Vehicle/Con A versus Vehicle/Saline. c p < 0.05 TCDD/Con A versus Vehicle/Con A. d p < 0.05 TCDD/Saline versus Vehicle/Saline. Data represent the mean ± SE of independent replicates from 3 separate experiments. For each cell type: Vehicle/Saline n=4, TCDD/Saline n=6, Vehicle/Con A n=4, TCDD/Con A n=6.
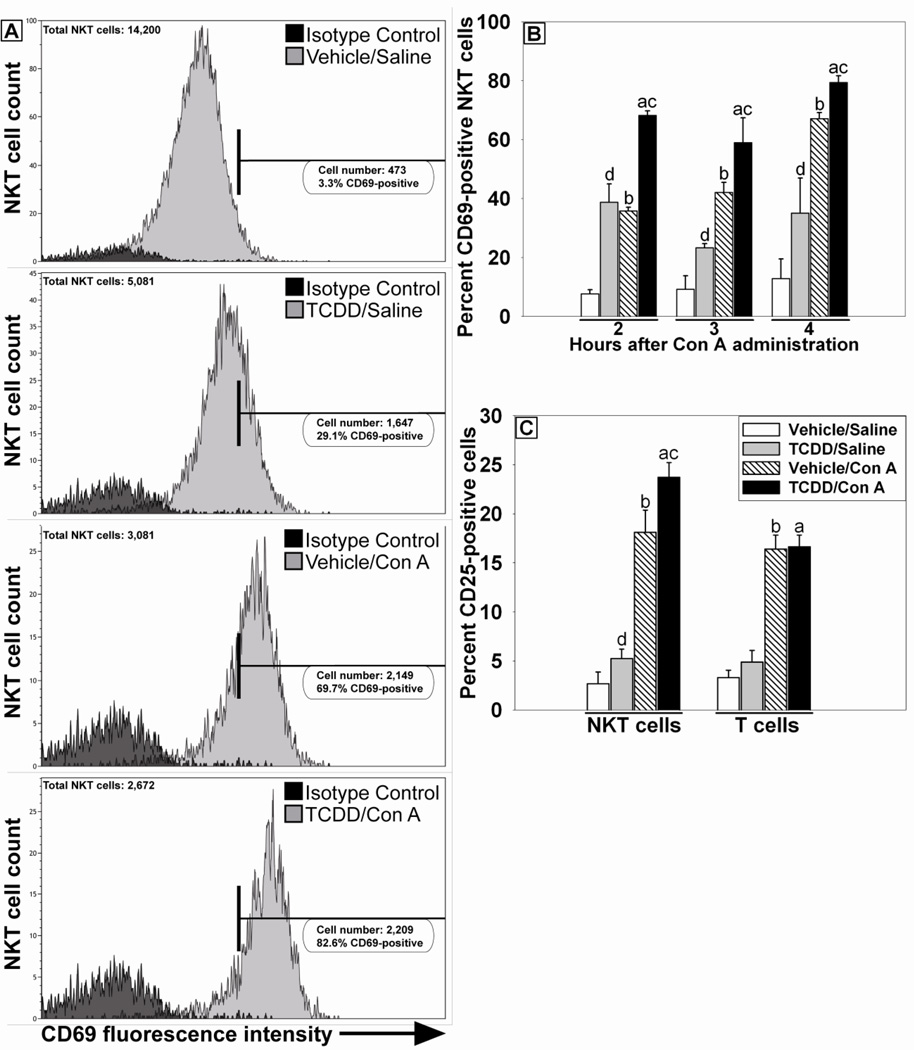
Activation status of these cell types was also assessed. Hepatic lymphocytes were first gated as described previously to identify NK, NKT and T cells. Then NKT cells were further gated based on staining for expression of the early lymphocyte activation marker CD69. Positive and negative gating parameters were set using samples stained with appropriately labeled fluorochrome-conjugated isotype control antibodies. The percentage of activated hepatic NKT cells, as detected by expression of CD69, was increased by TCDD/Saline treatment compared to Vehicle/Saline treatment at all times examined (Figure 7A and B). A similar increase in NKT cells expressing CD69 was detected in the Vehicle/Con A-treatment group (Figure 7B). The percentage of CD69-positive NKT cells in the TCDD/Con A-treatment group was significantly increased compared to all other groups at 2, 3 and 4 h after Con A administration. TCDD/Saline treatment did not increase the percentage of T cells expressing CD69 compared to Vehicle/Saline, and administration of Con A resulted in similar increases in the percentage of T cells positively stained for CD69 in both Vehicle- and TCDD- pretreated groups (data not shown). In addition, the proportion of NKT cells expressing the activation marker CD25 was increased at 3 h by TCDD/Saline treatment compared to Vehicle/Saline treatment. Vehicle/Con A treatment resulted in increased CD25-positive NKT cells compared to either Vehicle/Saline- or TCDD/Saline-treatment groups, and the proportion of NKT cells expressing CD25 in the TCDD/Con A-treatment group was increased additively relative to treatment with either agent alone (Figure 7C). In contrast, no significant increase was observed in CD25-positive T cells due to TCDD treatment alone. Con A administration increased the percentage of CD25-positive T cells in the Vehicle- and TCDD-pretreated groups.
Figure 7. Activation of hepatic lymphocytes after TCDD/Con A treatment.
Mice were treated as described in the legend to Figure 2 with Vehicle/Saline (white bars), TCDD/Saline (grey bars), Vehicle/Con A (striped bars) or TCDD/Con A (black bars). Hepatic NKT cells (NK1.1 +, CD3ε +) and T cells (NK1.1 −, CD3ε +), identified as described in Figure 6, were stained for the lymphocyte activation markers CD69 and CD25. (A) Representative histograms showing fluorescence intensity of CD69 staining on NKT cells 4 h after Con A or Saline administration. Treatments are indicated in the panels. The horizontal bar represents the area of positive staining based on the isotype control. (B) The percent of NKT cells staining positive for CD69 at 2, 3 and 4 h after Con A or Saline administration. a p < 0.05 TCDD/Con A versus TCDD/Saline at the same time point. b p < 0.05 Vehicle/Con A versus Vehicle/Saline at the same time point. c p < 0.05 TCDD/Con A versus Vehicle/Con A at the same time point. d p < 0.05 TCDD/Saline versus Vehicle/Saline at the same time point. (C) The percent of NKT and T cells staining positive for CD25 3 h after Con A or Saline administration. a p < 0.05 TCDD/Con A versus TCDD/Saline within the same cell type. b p < 0.05 Vehicle/Con A versus Vehicle/Saline within the same cell type. c p < 0.05 TCDD/Con A versus Vehicle/Con A within the same cell type. d p < 0.05 TCDD/Saline versus Vehicle/Saline within the same cell type. Data represent the mean ± SE of independent replicates from 2 separate experiments. For each time point or cell type: Vehicle/Saline n=5, TCDD/Saline n=5, Vehicle/Con A n=3–5, TCDD/Con A n=3–5.
Inhibition of immune cell extravasation with CD18 antiserum alters the development of liver injury
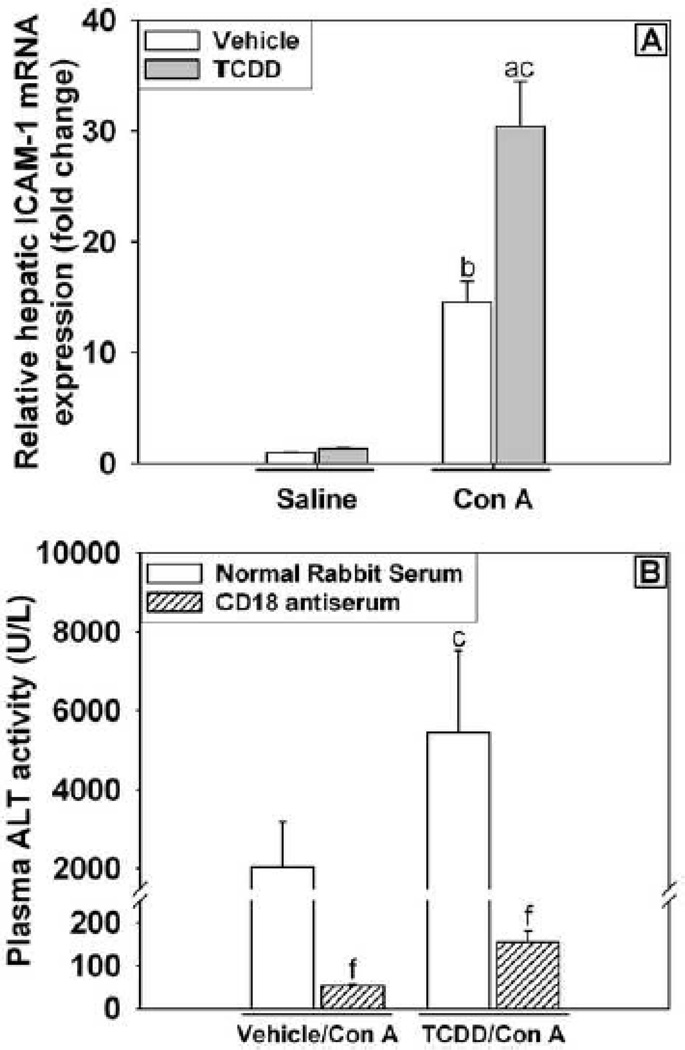
CD18 is a component of many cell adhesion integrins including lymphocyte function-associated antigen 1 (LFA-1) and macrophage-1 antigen (Mac-1) that are expressed on leukocytes. Neutralizing the interaction between CD18 and other intracellular adhesion molecules reduces the extravasation of leukocytes from liver sinusoids into parenchymal tissue and prevents direct cell-cell interaction between leukocytes and hepatocytes that is important for cytolytic processes involved in the killing of hepatic parenchymal cells (Klintman et al., 2002). Intracellular adhesion molecule 1 (ICAM-1) is a major target for integrin binding. Hepatic mRNA expression of ICAM-1 was not altered by TCDD/Saline treatment but was increased with Con A treatment at 6 h, and TCDD pretreatment further increased expression in Con A-treated mice (Figure 8A). The results suggest increased cellular adhesion and cell-cell interaction as a result of these treatments although in this experiment a distinction cannot be made between ICAM-1 expression on parenchymal cells and leukocytes. Treatment with neutralizing antiserum to CD18 attenuated the increase in plasma ALT activity at 24 h in both Vehicle/Con A- and TCDD/Con A-treated mice (Figure 8B). Administration of CD18 antiserum to Vehicle/Saline-treated mice caused no adverse effects on the liver at the 24 h time point (ALT activity in plasma= 22.3 ± 0.3 U/L). Despite preventing the development of liver injury, CD18 antiserum treatment did not decrease the plasma concentration of IFNγ in TCDD/Con A treated mice (data not shown).
Figure 8. Increased adhesion molecule expression and the effect of neutralization of CD18 on TCDD/Con A-mediated liver injury.
(A) Mice were treated as described in the legend to Figure 2 with Vehicle/Saline, TCDD/Saline, Vehicle/Con A or TCDD/Con A. Liver samples were collected 6 h after Saline or Con A treatment, and hepatic ICAM-1 mRNA expression was determined by RT-PCR. a p < 0.05 TCDD/Con A versus TCDD/Saline. b p < 0.05 Vehicle/Con A versus Vehicle/Saline. c p < 0.05 TCDD/Con A versus Vehicle/Con A. Data represent the mean ± SE of 6 independent replicates. (B) Mice were treated with vehicle or TCDD on day 0 then administered either CD18 antiserum (striped bars) or normal rabbit serum (NRS)(open bars) 15 h prior to treatment with 6 mg/kg Con A. A second administration of CD18 antiserum or NRS was given 2 h after Con A. ALT activity in plasma was measured 24 h after Con A administration. c p < 0.05 TCDD/Con A versus Vehicle/Con A within the same pre-treatment. f p < 0.05 versus the same treatment group with normal rabbit serum pretreatment. Data represent the mean ± SE of independent replicates from 2 separate experiments. For each treatment group: Vehicle/Saline n=6, TCDD/Saline n=6, Vehicle/Con A n=4-6, TCDD/Con A n=4–6.
Cytolytic potential of NKT cells after TCDD/Con A treatment
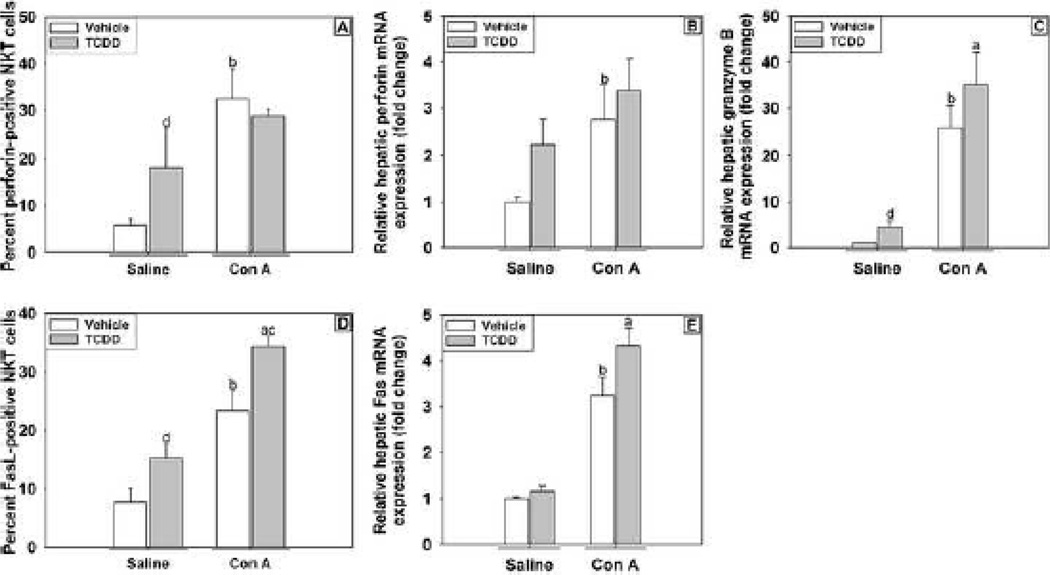
Perforin and Fas ligand (FasL) are important factors commonly used by NKT cells to kill target cells. The percent of NKT cells expressing perforin (Figure 9A) was evaluated 3 h after treatment with Con A. Treatment with either TCDD or Con A increased the percentage of NKT cells expressing perforin, but no additional increase occurred in cotreated mice. The mRNA expression in liver was investigated at 6 h as a time when injury is still developing in both the Vehicle/Con A and TCDD/Con A treatment groups. Hepatic expression of perforin mRNA was increased by Con A treatment at 6 h. TCDD/Saline treatment did not significantly increase perforin expression, and TCDD pretreatment did not alter its expression in Con A-treated mice (Figure 9B). Hepatic granzyme B expression at 6 h was increased slightly by TCDD/Saline treatment. Compared to Vehicle/Saline and TCDD/Saline, granzyme B expression was significantly increased by both Vehicle/Con A and TCDD/Con A treatments (Figure 9C). The percentage of NKT cells expressing FasL (Figure 9D) was evaluated at 4 h after treatment. TCDD/Saline treatment increased the proportion of FasL-positive NKT cells, and a similar increase was observed after Con A treatment. The percentage of NKT cells in the TCDD/Con A-treatment group that expressed FasL was greater than in any of the other treatment groups. The hepatic expression of mRNA for Fas receptor (CD95) was increased by Con A at 6 h after treatment, but TCDD pretreatment did not affect the expression in either Saline- or Con A-treated mice (Figure 9E).
Figure 9. Expression of cytolytic markers on hepatic NKT cells and hepatic expression of perforin, granzyme B and fas in mice treated with TCDD/Con A.
Mice were treated as described in the legend to Figure 2, and hepatic NKT cells (NK1.1+, CD3ε+) were isolated from mice and stained for markers of cytolytic activity. (A) NKT cells isolated 3 h after Con A or Saline administrations were stained for intracellular perforin. (D) NKT cells isolated 4 h following Con A or Saline administration were stained for expression of Fas Ligand (CD95). Liver samples were collected 6 h after Saline or Con A treatment, and hepatic perforin (B), granzyme B (C) and Fas (E) mRNA expression was determined by RT-PCR. a p < 0.05 TCDD/Con A versus TCDD/Saline. b p < 0.05 Vehicle/Con A versus Vehicle/Saline. c p < 0.05 TCDD/Con A versus Vehicle/Con A. d p < 0.05 TCDD/Saline versus Vehicle/Saline. Data represent the mean ± SE of independent replicates 2 separate experiments. For each treatment group: Vehicle/Saline n=3–6, TCDD/Saline n=3–6, Vehicle/Con A n=3–6, TCDD/Con A n=3–6.
The role of FasL in the development of TCDD/Con A-induced liver injury
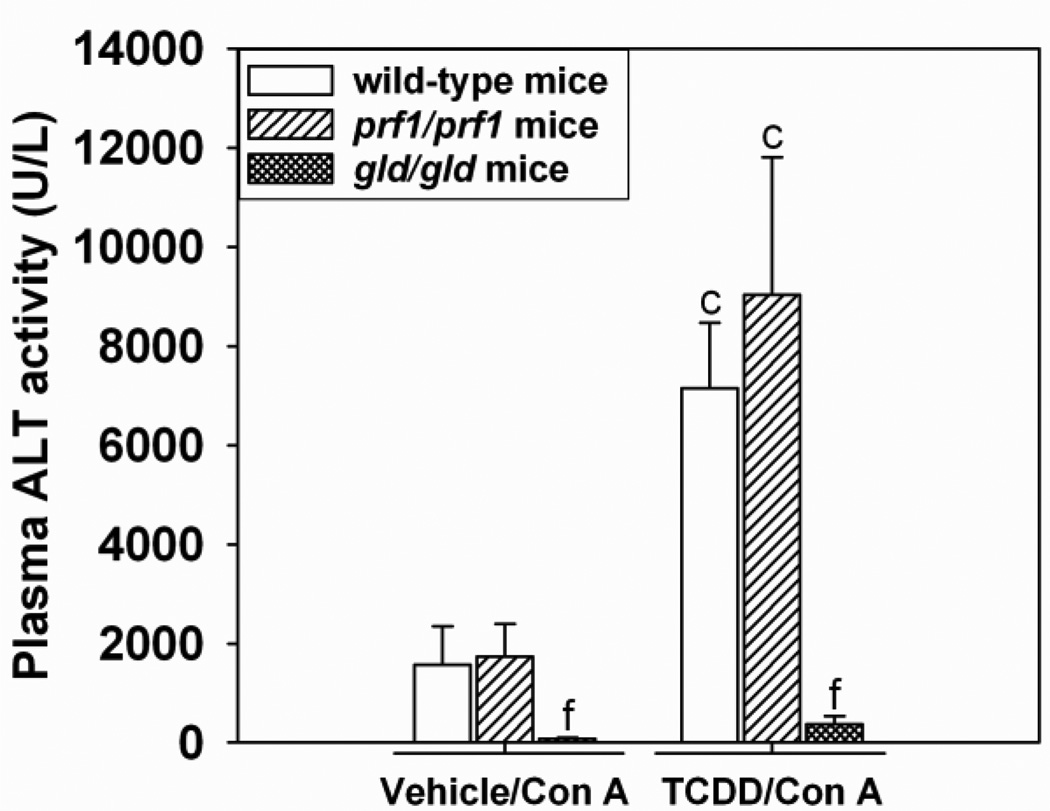
B6Smn.C3-Faslgld/J (gld/gld) mice, which possess a mutated form of FasL resulting in inability to activate the Fas receptor on target cells, and perforin deficient C57BL/6-Prf1tm1Sdz/J (prf1/prf1) mice were treated with TCDD and Con A as described above. Age-matched C57Bl/6J wild-type mice were used as controls. ALT activity in plasma was measured 24 h after Con A administration. In Vehicle/Con A- and TCDD/Con A-treated groups, prf1/prf1 mice were not protected from liver injury. However, Vehicle/Con A- and TCDD/Con A-treated gld/gld mice had attenuated activity of ALT in plasma compared to wild-type controls (Figure 10). The plasma concentrations of IFNγ were also decreased in gld/gld mice (640 ± 179 pg/mL) compared to wild-type mice (1, 716 ± 108 pg/mL) 8 h after TCDD-Con A-treatment. ALT activity in plasma was consistent with observed histopathological changes (Supplemental Data Figure 2).
Figure 10. TCDD/Con A-induced liver injury in prf/prf and gld/gld mice.
Wild-type (open bars), C57BL/6-Prf1tm1Sdz/J (prf1/prf1) (striped bars) and B6Smn.C3-Faslgld/J (gld/gld) (cross-hatched bars) mice were treated as described in the legend to Figure 2 with Vehicle/Con A or TCDD/Con A. Plasma ALT activity was determined at 24 h after Con A administration. c p < 0.05 TCDD/Con A versus Vehicle/Con A in the same mouse genotype. f p < 0.05 versus the same treatment in the wild-type control. Data represent the mean ± SE of 3–5 independent replicates per treatment group.
Discussion
The studies presented here were designed to investigate the effects of TCDD pretreatment on the outcome of immune-mediated liver injury and to determine what role the altered responses of immune cells play in the pathogenesis. The 30 ug/kg dose of TCDD was chosen because it has been commonly used for single oral dose exposure in this strain of mice. Using this dose enabled direct comparisons of our results to previously published work on acute toxicity (Patterson et al., 2003; Boverhof et al., 2005; Kopec et al., 2008; N'Jai et al., 2008) and humoral immunity (Smialowicz et al., 1994). In addition, doses in this range were used to examine cytokine expression following innate immune cell stimulation with endotoxin (Clark et al., 1991), sensitization to sheep red blood cells (Moos et al., 1994) and the response to ovalbumin (Nohara et al., 2002).
A major source of uncertainty regarding the toxic effects of dioxins in humans is associated with the limited data available on body burdens present in populations exposed to large doses. In particular it has been difficult to determine the human dosage at the time of exposure. Human body burdens are most commonly estimated by measuring lipid-adjusted serum concentrations (DeVito et al., 1995). This measurement is used as a proxy for the concentration of dioxins in adipose tissue, a major site of distribution in the body. In the general population the body burden of dioxin-like compounds is estimated to be equivalent to 36-58 ng TCDD/kg lipid according to lipid-adjusted serum measurements (DeVito et al., 1995). These measurements are based on established toxic equivalency factors (Birnbaum and DeVito, 1995). The TCDD dose used in these experiments more closely resembles those that have been proposed to occur in cases of accidental or occupational exposure in humans, in which significantly greater body burdens of TCDD have been reported. Lipid-adjusted serum concentrations as high as 56 µg/kg have been found in workers one year after an exposure resulting from a chemical plant explosion in Seveso, Italy (Needham et al., 1997). In another study of chemical plant workers, values as high as 3 µg/kg were observed despite all workers having received their last occupational exposure between 15–37 years earlier (Fingerhut et al., 1991). These values are not unlike those measured in adipose tissue of mice given a single dose of 10 µg TCDD/kg: 37 µg/kg and 54 µg/kg at 4 and 7 days respectively (Diliberto et al., 1995; Hakk et al., 2009). Accordingly, the 30 µg/kg dose used in these experiments is in the range of those likely to have occurred during accidental exposure to TCDD in humans.
Con A-induced liver injury is a well-established model of hepatitis. A single, intravenous injection of this mitogenic lectin (typically 15–25 mg/kg) causes inflammatory liver injury in mice within 8–24 h after administration. For studies presented here, smaller Con A doses (0–10 mg/kg) that result in only minimal to moderate liver injury (Mizuhara et al., 1998) were chosen so that exacerbation of hepatotoxicity by TCDD pretreatment could be detected. Pretreatment with TCDD resulted in an increased hepatotoxic response to a range of TCDD doses and Con A doses, as indicated by increased plasma ALT activity and histopathology. In addition, the onset of injury after Con A administration occurred earlier in TCDD-pretreated mice. The ALT activity in the plasma of TCDD/Con A-treated mice was significantly elevated as early as 4 h after Con A administration, whereas a significant increase in Vehicle/Con A-treated mice was not observed until 6 h.
One mechanism by which TCDD might increase the sensitivity to Con A-induced liver injury is by altering the cytokine response. TNFα, IL-6, and IL-10 are known to play important roles in the modulation of injury at larger doses of Con A. For example, TNFα, a cytokine released primarily by activated macrophages and T-cells (Gantner et al., 1996), is a major effector of liver injury induced by large, hepatotoxic doses of Con A; neutralization of TNFα completely protected against hepatotoxicity (Mizuhara et al., 1994; Gantner et al., 1995). IL-6 plays contrasting roles in the development of injury after Con A. IL-6 was protective if administered or induced prior to Con A treatment (Nishikage et al., 1999), whereas recombinant IL-6 exacerbated injury when administered after Con A (Mizuhara et al., 1994). The antiinflammatory cytokine IL-10 was induced early after Con A administration. Reducing IL-10 with neutralizing antibodies increased the severity of Con A hepatotoxicity, and treatment with recombinant IL-10 before Con A administration reduced the production of TNFα, IL-12, and IFNγ and attenuated liver injury (Louis et al., 1997). In studies presented here, a smaller dose of Con A had a similar effect to increase IL-6, TNFα, and IL-10 concentrations in plasma; however, TCDD-pretreatment did not alter the induction of any of these cytokines. These results suggest that the modulation of these inflammatory and protective cytokines does not play a direct role in the increased sensitivity of TCDD-pretreated mice to Con A.
The plasma concentrations of IL-2, IL-4 and IFNγ, cytokines produced by the T cell populations directly activated by large doses of Con A, are known to be increased by Con A administration. IL-2 is a marker for T cell activation, and its role in the development of Con Ainduced liver injury is not fully discerned. IL-4 production by NKT cells is partially responsible for the increase in TNFα after Con A, and neutralization of IL-4 with monoclonal antibodies completely protected mice from Con A-induced injury (Toyabe et al., 1997; Kaneko et al., 2000). IFNγ is essential for the development of liver injury after Con A administration (Kusters et al., 1996; Tagawa et al., 1997). In our studies, administration of Con A induced IL-2, IL-4, and IFNγ, confirming earlier work. Interestingly, whereas TCDD pretreatment decreased the production of IL-2 and IL-4 after Con A, the plasma concentration of IFNγ was increased. In addition, IFNγ knockout mice did not develop liver injury from treatment with TCDD/Con A. As in studies using larger doses of Con A alone, these results indicate that IFNγ plays a central role in liver injury resulting from TCDD sensitization to a smaller dose of Con A. The effects of TCDD treatment alone in IFNγ knockout mice were not determined in this study. However, given that in the absence of Con A, 30 µg/kg TCDD pretreatment failed to cause hepatocellular necrosis in wild-type mice, as determined by plasma ALT activity (Figure 1B) and analysis of histopathology (Figure 2), it is unlikely that this dose of TCDD alone would result in liver injury in the IFNγ knockout mice. The expression of IL-17 and IL-22 mRNA induced by Con A was unaltered by TCDD pretreatment, which indicates that TCDD does not exacerbate Con A induced liver injury by modulating expression of Th17-type cytokines.
Liver injury from large doses of Con A is the result of a number of immune cell-mediated and cytokine-driven responses induced by activation of leukocytes in the liver. The cellular immune response is focused around the initial activation of CD4+ T-cells, in particular NKT cells. These cells are sufficient to cause injury in the absence of any other T cell population (Kaneko et al., 2000; Takeda et al., 2000). In addition, the secondary activation of innate immune cell types, such as resident hepatic macrophages (Schumann et al., 2000; Morita et al., 2003) and infiltrating neutrophils (Bonder et al., 2004), contributes to hepatotoxicity through accessory roles in the development and progression of injury. TCDD pretreatment did not alter the proportions of NK, NKT or T cells in the liver after Con A treatment. However, whereas Con A administration did result in a reduction of the percentage of NKT cells in the liver, the activation status of these critical effector cells was increased by TCDD-pretreatment as evidenced by increased expression of CD69 and CD25. This occurred at early times before the onset of liver injury. In addition, hepatic expression of ICAM-1 was significantly increased by TCDD/Con A treatment, and neutralization of CD18 greatly reduced hepatotoxicity. These findings demonstrate the importance of leukocyte extravasation and suggest a requirement for direct interaction of leukocytes with target parenchymal cells for hepatocellular killing to occur in this model. Whereas CD18 antiserum treatment did protect against the development of liver injury, it did not decrease the plasma concentration of IFNγ in TCDD/Con A-treated mice (data not shown), a result consistent with results reported previously in LFA-1 knockout mice. LFA-1 is an adhesion molecule composed of the integrin chains CD18 and CD11a. Con A administration to LFA-1 knockout mice produced plasma IFNγ concentrations that were not significantly different from wild-type mice, however LFA-1 knockout mice were protected from liver injury (Matsumoto et al., 2002). This result also raised the possibility that cell cytolytic activity might play an important role in the increased liver injury caused by TCDD cotreatment.
Fas-FasL signaling represents a major mechanism by which lymphocytes can induce cell death in parenchymal cells. The role of FasL (CD95) in lymphocyte-mediated parenchymal cell death after Con A administration is still controversial. FasL knockout (gld/gld) mice, Fas knockout (lpr/lpr) mice, and mice treated with neutralizing FasL antibody were protected against liver injury induced by a hepatotoxic dose (15mg/kg) of Con A (Seino et al., 1997; Takeda et al., 2000). However, at even larger doses (20–30 mg/kg), lpr/lpr knockout mice were not protected (Leist et al., 1996; Watanabe et al., 1996; Tagawa et al., 1998). Additionally, when mice were given a neutralizing Fas fusion protein prior to treatment with 10 mg/kg Con A, no protection was observed (Ksontini et al., 1998). In studies presented here, the percentage of NKT cells expressing FasL was increased only in TCDD/Con A-treated mice. In addition, gld/gld mice were protected from TCDD/Con A-induced liver injury. These results confirm an important role for the increased cytolytic activity of NKT cells in Con A treated mice that were pretreated with TCDD and suggest that increased FasL-mediated killing of hepatocytes is a major mechanism by which TCDD-pretreatment exacerbates liver injury from Con A.
In summary, these results demonstrate that TCDD pretreatment increases the sensitivity of mice to liver injury in a model of immune hepatitis induced by moderate doses of Con A. This increased sensitivity is characterized by an exacerbated inflammatory response and severe hepatocellular necrosis. The mechanisms underlying the exacerbated Con A response induced by TCDD pretreatment involve an increase in the production of the critical cytokine IFNγ, enhanced activation of NKT cells, and increased cytolytic activity by FasL towards hepatic parenchymal cells.
Supplementary Material
Highlights.
TCDD pretreatment sensitizes mice to Con A-induced hepatotoxicity.
TCDD pretreatment increased concentration of IFNγ in plasma after Con A.
Con A-induced activation of NKT cells was increased by TCDD pretreatment.
FasL-positive NKT cells increased with TCDD pretreatment versus Con A alone.
IFNγ and FasL are critical to the development of liver injury from TCDD/Con A.
Acknowledgments
We thank Nicole Crisp for experimental support regarding flow cytometry and Dr. Christine Dugan for assistance in developing protocols for intrahepatic immune cell isolation. We also thank Ryan Albee and Sarah Thomas for technical assistance.
Funding:
This work was supported by National Institutes of Health grant [ES004911]; AMF was supported by National Institute of Environmental Health Sciences training grant T32 ES007255.
Abbreviations used in this article
- AhR
aryl hydrocarbon receptor
- ALT
alanine aminotransferase
- FasL
fas ligand
- IFNγ
Interferon gamma
- IL
interleukin
- NK
natural killer
- TCDD
tetrachlorodibenzo-p-dioxin
- TNFαs
tumor necrosis alpha
Footnotes
Publisher's Disclaimer: This is a PDF file of an unedited manuscript that has been accepted for publication. As a service to our customers we are providing this early version of the manuscript. The manuscript will undergo copyediting, typesetting, and review of the resulting proof before it is published in its final citable form. Please note that during the production process errors may be discovered which could affect the content, and all legal disclaimers that apply to the journal pertain.
References
- Birnbaum LS, DeVito MJ. Use of toxic equivalency factors for risk assessment for dioxins and related compounds. Toxicology. 1995;105:391–401. doi: 10.1016/0300-483x(95)03237-a. [DOI] [PubMed] [Google Scholar]
- Birnbaum LS, Tuomisto J. Non-carcinogenic effects of TCDD in animals. Food Addit Contam. 2000;17:275–288. doi: 10.1080/026520300283351. [DOI] [PubMed] [Google Scholar]
- Bonder CS, Ajuebor MN, Zbytnuik LD, Kubes P, Swain MG. Essential Role for Neutrophil Recruitment to the Liver in Concanavalin A-Induced Hepatitis. J Immunol. 2004;172:45–53. doi: 10.4049/jimmunol.172.1.45. [DOI] [PubMed] [Google Scholar]
- Boverhof DR, Burgoon LD, Tashiro C, Chittim B, Harkema JR, Jump DB, Zacharewski TR. Temporal and Dose-Dependent Hepatic Gene Expression Patterns in Mice Provide New Insights into TCDD-Mediated Hepatotoxicity. Toxicol Sci. 2005;85:1048–1063. doi: 10.1093/toxsci/kfi162. [DOI] [PubMed] [Google Scholar]
- Clark G, Taylor M, Tritscher A, Lucier G. Tumor necrosis factor involvement in 2,3,7,8-tetrachlorodibenzo-p-dioxin-mediated endotoxin hypersensitivity in C57BL/6J mice congenic at the Ah locus. Toxicol Appl Pharmacol. 1991;111:422–431. doi: 10.1016/0041-008x(91)90247-c. [DOI] [PubMed] [Google Scholar]
- DeVito MJ, Birnbaum LS, Farland WH, Gasiewicz TA. Comparisons of Estimated Human Body Burdens of Dioxinlike Chemicals and TCDD Body Burdens in Experimentally Exposed Animals. Environ Health Perspect. 1995;103:820–831. doi: 10.1289/ehp.95103820. [DOI] [PMC free article] [PubMed] [Google Scholar]
- Diliberto JJ, Akubue PI, Luebke RW, Birnbaum LS. Dose-response relationships of tissue distribution and induction of CYP1A1 and CYP1A2 enzymatic activities following acute exposure to 2,3,7,8-tetrachlorodibenzo-p-dioxin (TCDD) in mice. Toxicol Appl Pharmacol. 1995;130:197–208. doi: 10.1006/taap.1995.1025. [DOI] [PubMed] [Google Scholar]
- Dong Z, Wei H, Sun R, Tian Z. The roles of innate immune cells in liver injury and regeneration. Cell Mol Immunol. 2007;4:241–252. [PubMed] [Google Scholar]
- Esser C, Rannug A, Stockinger B. The aryl hydrocarbon receptor in immunity. Trends Immunol. 2009;30:447–454. doi: 10.1016/j.it.2009.06.005. [DOI] [PubMed] [Google Scholar]
- Fingerhut MA, Halperin WE, Marlow DA, Piacitelli LA, Honchar PA, Sweeney MH, Greife AL, Dill PA, Steenland K, Suruda AJ. Cancer mortality in workers exposed to 2,3,7,8-tetrachlorodibenzo-p-dioxin. N Engl J Med. 1991;324:212–218. doi: 10.1056/NEJM199101243240402. [DOI] [PubMed] [Google Scholar]
- Gantner F, Leist M, Küsters S, Vogt K, Volk H-D, Tiegs G. T Cell Stimulus- Induced Crosstalk between Lymphocytes and Liver Macrophages Results in Augmented Cytokine Release. Exp Cell Res. 1996;229:137–146. doi: 10.1006/excr.1996.0351. [DOI] [PubMed] [Google Scholar]
- Gantner F, Leist M, Lohse AW, Germann PG, Tiegs G. Concanavalin A-induced T-cell-mediated hepatic injury in mice: the role of tumor necrosis factor. Hepatology. 1995;21:190–198. doi: 10.1016/0270-9139(95)90428-x. [DOI] [PubMed] [Google Scholar]
- Gasiewicz TA, Geiger LE, Rucci G, Neal RA. Distribution, excretion, and metabolism of 2,3,7,8-tetrachlorodibenzo-p-dioxin in C57BL/6J, DBA/2J, and B6D2F1/J mice. Drug Metab Dispos. 1983;11:397–403. [PubMed] [Google Scholar]
- Hakk H, Diliberto JJ, Birnbaum LS. The effect of dose on 2,3,7,8-TCDD tissue distribution, metabolism and elimination in CYP1A2 (−/−) knockout and C57BL/6N parental strains of mice. Toxicol Appl Pharmacol. 2009;241:119–126. doi: 10.1016/j.taap.2009.08.009. [DOI] [PubMed] [Google Scholar]
- Kaneko Y, Harada M, Kawano T, Yamashita M, Shibata Y, Gejyo F, Nakayama T, Taniguchi M. Augmentation of Vα14 Nkt Cell–Mediated Cytotoxicity by Interleukin 4 in an Autocrine Mechanism Resulting in the Development of Concanavalin a–Induced Hepatitis. J Exp Med. 2000;191:105–114. doi: 10.1084/jem.191.1.105. [DOI] [PMC free article] [PubMed] [Google Scholar]
- Klintman D, Schramm R, Menger MD, Thorlacius H. Leukocyte recruitment in hepatic injury: selectin-mediated leukocyte rolling is a prerequisite for CD18-dependent firm adhesion. J Hepatol. 2002;36:53–59. doi: 10.1016/s0168-8278(01)00226-4. [DOI] [PubMed] [Google Scholar]
- Kopec AK, Boverhof DR, Burgoon LD, Ibrahim-Aibo D, Harkema JR, Tashiro C, Chittim B, Zacharewski TR. Comparative toxicogenomic examination of the hepatic effects of PCB126 and TCDD in immature, ovariectomized C57BL/6 mice. Toxicol Sci. 2008;102:61–75. doi: 10.1093/toxsci/kfm289. [DOI] [PubMed] [Google Scholar]
- Ksontini R, Colagiovanni DB, Josephs MD, Edwards CK, 3rd, Tannahill CL, Solorzano CC, Norman J, Denham W, Clare-Salzler M, MacKay SL, Moldawer LL. Disparate roles for TNF-alpha and Fas ligand in concanavalin A-induced hepatitis. J Immunol. 1998;160:4082–4089. [PubMed] [Google Scholar]
- Kusters S, Gantner F, Kunstle G, Tiegs G. Interferon gamma plays a critical role in T cell-dependent liver injury in mice initiated by concanavalin A. Gastroenterology. 1996;111:462–471. doi: 10.1053/gast.1996.v111.pm8690213. [DOI] [PubMed] [Google Scholar]
- Leist M, Gantner F, Kunstle G, Bohlinger I, Tiegs G, Bluethmann H, Wendel A. the 55-kB tumor necrosis factor receptor and CD95 independently signal murine hepatocyte apoptosis and subsequent liver failure. Mol Med. 1996;2:109–124. [PMC free article] [PubMed] [Google Scholar]
- Louis H, Le Moine O, Peny MO, Quertinmont E, Fokan D, Goldman M, Deviere J. Production and role of interleukin-10 in concanavalin A-induced hepatitis in mice. Hepatology. 1997;25:1382–1389. doi: 10.1002/hep.510250614. [DOI] [PubMed] [Google Scholar]
- Matsumoto G, Tsunematsu S, Tsukinoki K-i, Ohmi Y, Iwamiya M, Oliveira-dos-Santos A, Tone D, Shindo J, Penninger JM. Essential Role of the Adhesion Receptor LFA-1 for T Cell-Dependent Fulminant Hepatitis. J Immunol. 2002;169:7087–7096. doi: 10.4049/jimmunol.169.12.7087. [DOI] [PubMed] [Google Scholar]
- Mizuhara H, Kuno M, Seki N, Yu WG, Yamaoka M, Yamashita M, Ogawa T, Kaneda K, Fujii T, Senoh H, Fujiwara H. Strain difference in the induction of T-cell activation–associated, interferon gamma–dependent hepatic injury in mice. Hepatology. 1998;27:513–519. doi: 10.1002/hep.510270227. [DOI] [PubMed] [Google Scholar]
- Mizuhara H, O'Neill E, Seki N, Ogawa T, Kusunoki C, Otsuka K, Satoh S, Niwa M, Senoh H, Fujiwara H. T cell activation-associated hepatic injury: mediation by tumor necrosis factors and protection by interleukin 6. J Exp Med. 1994;179:1529–1537. doi: 10.1084/jem.179.5.1529. [DOI] [PMC free article] [PubMed] [Google Scholar]
- Moos A, Baecher-Steppan L, Kerkvliet N. Acute inflammatory response to sheep red blood cells in mice treated with 2,3,7,8-tetrachlorodibenzo-p-dioxin: the role of proinflammatory cytokines, IL-1 and TNF. Toxicol Appl Pharmacol. 1994;127:331–335. doi: 10.1006/taap.1994.1169. [DOI] [PubMed] [Google Scholar]
- Morita A, Itoh Y, Toyama T, Fujii H, Nishioji K, Kirishima T, Makiyama A, Yamauchi N, Okanoue T. Activated Kupffer cells play an important role in intra-hepatic Th1- associated necro-inflammation in Concanavalin A-induced hepatic injury in mice. Hepatol Res. 2003;27:143–150. doi: 10.1016/s1386-6346(03)00206-7. [DOI] [PubMed] [Google Scholar]
- N'Jai A, Boverhof DR, Dere E, Burgoon LD, Tan YS, Rowlands JC, Budinsky RA, Stebbins KE, Zacharewski TR. Comparative temporal toxicogenomic analysis of TCDD- and TCDF-mediated hepatic effects in immature female C57BL/6 mice. Toxicol Sci. 2008;103:285–297. doi: 10.1093/toxsci/kfn053. [DOI] [PubMed] [Google Scholar]
- Needham LL, Gerthoux PM, Patterson DG, Jr, Brambilla P, Turner WE, Beretta C, Pirkle JL, Colombo L, Sampson EJ, Tramacere PL, Signorini S, Meazza L, Carreri V, Jackson RJ, Mocarelli P. Serum dioxin levels in Seveso, Italy, population in 1976. Teratog Carcinog Mutagen. 1997;17:225–240. [PubMed] [Google Scholar]
- Nishikage T, Seki S, Toyabe S, Abo T, Kagata Y, Iwai T, Hiraide H. Inhibition of concanavalin A-induced hepatic injury of mice by bacterial lipopolysaccharide via the induction of IL-6 and the subsequent reduction of IL-4: the cytokine milieu of concanavalin A hepatitis. J Hepatol. 1999;31:18–26. doi: 10.1016/s0168-8278(99)80159-7. [DOI] [PubMed] [Google Scholar]
- Nohara K, Fujimaki H, Tsukumo S, Inouye K, Sone H, Tohyama C. Effects of 2,3,7,8-tetrachlorodibenzo-p-dioxin (TCDD) on T cell-derived cytokine production in ovalbumin (OVA)-immunized C57Bl/6 mice. Toxicology. 2002;172:49–58. doi: 10.1016/s0300-483x(01)00582-0. [DOI] [PubMed] [Google Scholar]
- Olivero-Verbel J, Roth RA, Ganey PE. Dioxin alters inflammatory responses to lipopolysaccharide. Toxicol Environ Chem. 2011;93:1180–1194. [Google Scholar]
- Patterson RM, Stachlewitz R, Germolec D. Induction of apoptosis by 2,3,7,8- tetrachlorodibenzo-p-dioxin following endotoxin exposure. Toxicol Appl Pharmacol. 2003;190:120–134. doi: 10.1016/s0041-008x(03)00186-8. [DOI] [PubMed] [Google Scholar]
- Poland A, Glover E. 2,3,7,8,-Tetrachlorodibenzo-p-dioxin: segregation of toxocity with the Ah locus. Mol Pharmacol. 1980;17:86–94. [PubMed] [Google Scholar]
- Rehermann B, Nascimbeni M. Immunology of hepatitis B virus and hepatitis C virus infection. Nat Rev Immunol. 2005;5:215–229. doi: 10.1038/nri1573. [DOI] [PubMed] [Google Scholar]
- Santodomingo-Garzon T, Swain MG. Role of NKT cells in autoimmune liver disease. Autoimmun Rev. 2011;10:793–800. doi: 10.1016/j.autrev.2011.06.003. [DOI] [PubMed] [Google Scholar]
- Sass G, Heinlein S, Agli A, Bang R, Schümann J, Tiegs G. Cytokine Expression in Three Mouse Models of Experimental Hepatitis. Cytokine. 2002;19:115–120. doi: 10.1006/cyto.2002.1948. [DOI] [PubMed] [Google Scholar]
- Schumann J, Wolf D, Pahl A, Brune K, Papadopoulos T, van Rooijen N, Tiegs G. Importance of Kupffer cells for T-cell-dependent liver injury in mice. Am J Pathol. 2000;157:1671–1683. doi: 10.1016/S0002-9440(10)64804-3. [DOI] [PMC free article] [PubMed] [Google Scholar]
- Seino K, Kayagaki N, Takeda K, Fukao K, Okumura K, Yagita H. Contribution of Fas ligand to T cell-mediated hepatic injury in mice. Gastroenterology. 1997;113:1315–1322. doi: 10.1053/gast.1997.v113.pm9322527. [DOI] [PubMed] [Google Scholar]
- Shaw PJ, Ganey PE, Roth RA. Trovafloxacin enhances the inflammatory response to a Gram-negative or a Gram-positive bacterial stimulus, resulting in neutrophil-dependent liver injury in mice. J Pharmacol Exp Ther. 2009;330:72–78. doi: 10.1124/jpet.109.151068. [DOI] [PMC free article] [PubMed] [Google Scholar]
- Smialowicz RJ, Riddle MM, Williams WC, Diliberto JJ. Effects of 2,3,7,8-Tetrachlorodibenzo-P-Dioxin (Tcdd) on Humoral Immunity and Lymphocyte Subpopulations - Differences between Mice and Rats. Toxicol Appl Pharm. 1994;124:248–256. doi: 10.1006/taap.1994.1029. [DOI] [PubMed] [Google Scholar]
- Sweeney MH, Mocarelli P. Human health effects after exposure to 2,3,7,8-TCDD. Food Addit Contam. 2000;17:303–316. doi: 10.1080/026520300283379. [DOI] [PubMed] [Google Scholar]
- Tagawa Y, Sekikawa K, Iwakura Y. Suppression of concanavalin A-induced hepatitis in IFN-gamma(−/−) mice, but not in TNF-alpha(−/−) mice: role for IFN-gamma in activating apoptosis of hepatocytes. J Immunol. 1997;159:1418–1428. [PubMed] [Google Scholar]
- Tagawa Y-i, Kakuta S, Iwakura Y. Involvement of Fas/Fas ligand system-mediated apoptosis in the development of concanavalin A-induced hepatitis. Eur J Immunol. 1998;28:4105–4113. doi: 10.1002/(SICI)1521-4141(199812)28:12<4105::AID-IMMU4105>3.0.CO;2-8. [DOI] [PubMed] [Google Scholar]
- Takeda K, Hayakawa Y, Van Kaer L, Matsuda H, Yagita H, Okumura K. Critical contribution of liver natural killer T cells to a murine model of hepatitis. Proc Natl Acad Sci USA. 2000;97:5498–5503. doi: 10.1073/pnas.040566697. [DOI] [PMC free article] [PubMed] [Google Scholar]
- Teske S, Bohn AA, Regal JF, Neumiller JJ, Lawrence BP. Activation of the aryl hydrocarbon receptor increases pulmonary neutrophilia and diminishes host resistance to influenza A virus. Am J Physiol Lung Cell Mol Physiol. 2005;289:L111–L124. doi: 10.1152/ajplung.00318.2004. [DOI] [PubMed] [Google Scholar]
- Tiegs G, Hentschel J, Wendel A. A T cell-dependent experimental liver injury in mice inducible by concanavalin A. J Clin Invest. 1992;90:196–203. doi: 10.1172/JCI115836. [DOI] [PMC free article] [PubMed] [Google Scholar]
- Toyabe S, Seki S, Iiai T, Takeda K, Shirai K, Watanabe H, Hiraide H, Uchiyama M, Abo T. Requirement of IL-4 and liver NK1+ T cells for concanavalin A-induced hepatic injury in mice. J Immunol. 1997;159:1537–1542. [PubMed] [Google Scholar]
- Veldhoen M, Duarte JH. The aryl hydrocarbon receptor: fine-tuning the immuneresponse. Curr Opin Immunol. 2010;22:747–752. doi: 10.1016/j.coi.2010.09.001. [DOI] [PubMed] [Google Scholar]
- Veldhoen M, Hirota K, Westendorf AM, Buer J, Dumoutier L, Renauld JC, Stockinger B. The aryl hydrocarbon receptor links TH17-cell-mediated autoimmunity to environmental toxins. Nature. 2008;453:106–109. doi: 10.1038/nature06881. [DOI] [PubMed] [Google Scholar]
- Watanabe Y, Morita M, Akaike T. Concanavalin A induces perforin-mediated but not Fas-mediated hepatic injury. Hepatology. 1996;24:702–710. doi: 10.1053/jhep.1996.v24.pm0008781346. [DOI] [PubMed] [Google Scholar]
Associated Data
This section collects any data citations, data availability statements, or supplementary materials included in this article.


