LETTER
In a phase I clinical trial in Guinea-Bissau, we have tested an immunotherapeutic HIV-1 vaccine candidate in HIV-1-infected subjects (V. R. Gómez Román, K. J. Jensen, S. S. Jensen, C. Leo-Hansen, S. Jespersen, D. S. Té, C. M. Rodrigues, C. M. Janitzek, L. Vinner, T. L. Katzenstein, P. Andersen, I. Kromann, L. V. Andreasen, I. Karlsson, and A. Fomsgaard, submitted for publication). The HIV-1 epidemic in Guinea-Bissau is comprised predominantly by the subtypes CRF02_AG and A3 (4). The gag gene of CRF02_AG is derived from the clade A ancestor (1, 11).
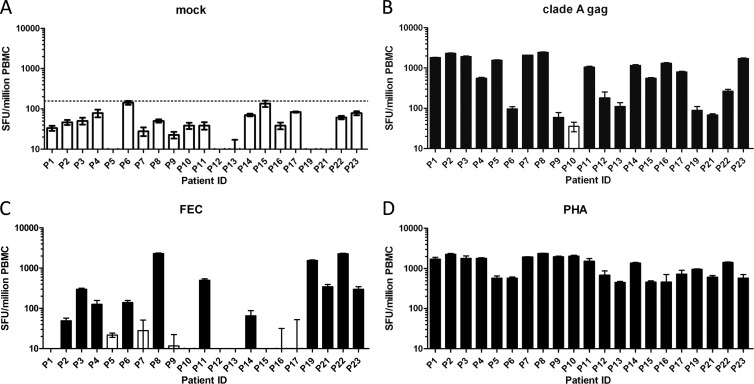
We discovered a high rate and magnitude of gamma interferon (IFN-γ) responders to a pool of overlapping peptides derived from the Gag segment of the Tanzanian clade A isolate HIV-101TZA173. Responses to phytohemagglutinin A (PHA) and a mix of influenza A virus, Epstein-Barr virus, and human cytomegalovirus (FEC) peptides were also tested with an IFN-γ enzyme-linked immunosorbent spot (ELISPOT) assay. Background responses (Fig. 1A) were subtracted from the antigen-specific responses, and the distribution-free resampling (DFR) statistical test [DFR(eq)] (12) was applied (Fig. 1B to D). Twenty of the twenty-one patients (95%) passing the ELISPOT assay criteria had positive responses against clade A Gag peptides. Among responders, the mean clade A Gag-specific response was 1,055 spot-forming units (SFU) per million peripheral mononuclear blood cells (PBMC). Half of the patients had robust responses above the 1,000-SFU/million PBMC level, whereas only three patients (14%) had low responses below 100 SFU/million PBMC.
Fig 1.
IFN-γ ELISPOT responses for 21 treatment-naïve HIV-infected individuals living in Guinea-Bissau. SFU counts for each patient in response to the indicated stimuli are presented per million PBMC. (A) Mock responses to 0.2% dimethyl sulfoxide (DMSO). Each bar represents the mean of six responses observed for each donor. Error bars denote the standard errors of the means. The dotted line indicates an arbitrary cutoff value of 157 SFU per million PBMC. (B) Responses to overlapping clade A Gag peptides. (C) Responses to FEC peptides. (D) Responses to the PHA positive control. SFU counts in panels B to D were determined after subtracting background (mock) values from the mean of triplicate responses observed for each donor. Black bars denote responses that scored positive using the DFR(eq) statistical test criteria. White bars denote responses that scored negative.
In comparison, only 52% of the patients passing the ELISPOT criteria had positive FEC-specific responses based on the DFR(eq) test criteria (Fig. 1C). All 21 patients (100%) passing the ELISPOT criteria responded to the PHA positive control (Fig. 1D), reaching high levels of responses, in the range of 452 to 2,360 SFU/million PBMC. The mean response was 1,252 SFU/million PBMC.
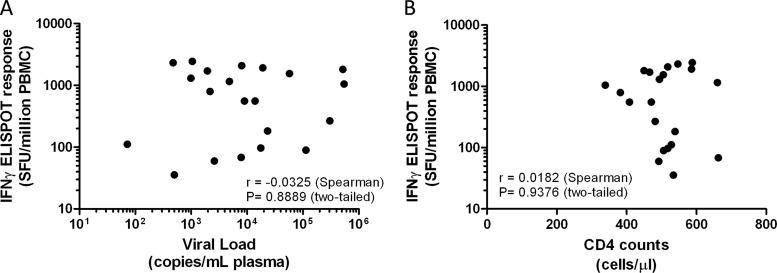
The observation of a high frequency of clade A Gag responders is interesting for two primary reasons. (i) The sequence covering the overlapping Gag peptide pool is incorporated into a prophylactic HIV vaccine candidate currently being tested in clinical trials in East Africa (7). The high degree of reactivity in this geographically distinct population may indicate the potential of testing such a vaccine in regions outside East Africa. (ii) We found no correlation between the magnitude of IFN-γ responses and the plasma HIV-1 viral load or CD4+ T cell counts (Fig. 2).
Fig 2.
The magnitude of IFN-γ ELISPOT responses does not correlate with either the viral load or CD4T cell counts. Each dot represents the mean of triplicate ELISPOT responses observed against clade A Gag peptides for each patient, plotted against the observed viral load (A) or CD4 T cell count (B) determined at the time of sample collection. Correlation analysis was performed using the nonparametric Spearman's rank correlation test.
The relatively high background level in the medium-alone controls may be caused by an expectedly high overall immune activation among HIV-infected subjects living in a high-disease-burden setting (6, 8–10, 13) and the lower-standard laboratory conditions in Guinea-Bissau.
The wide span from high to low responses across the conditions and the fact that the medium-alone controls were consistently lower than the tests lead us to conclude that the cause cannot be attributed to the medium used or other assay artifacts. The present political instability in Guinea-Bissau has prevented us from testing the peptide pool in HIV-negative subjects to rule out nonspecific reactivity. However, although the standard operating procedure and geographical location differed from those of the present study, an absence of reactivity was recently demonstrated elsewhere for naïve HIV-negative individuals (7).
This is the first report of HIV-1-specific T cell responses from Guinea-Bissau. There is no consensus on the clinical significance of cellular immune responses to HIV epitopes during a natural infection, since there are reports of both positive (2, 3) and negative (5) associations with viral load.
ACKNOWLEDGMENTS
We thank the following members of the SSI Department of Virology: Susanne Thelle, Lene Petersen, Solvej Jensen, and Birgit Knudsen, for technical support in conducting the ELISPOT assays; Sheila Tang, for discussions and guidance leading to the use of the DFR statistical test criteria; and Lasse Vinner, for critical revision of the manuscript.
This work was supported by grants from the Danish International Development Agency (DANIDA) and the European & Developing Countries Clinical Trials Partnership (EDCTP HIV-VAC-RGB), awarded to Anders Fomsgaard.
Footnotes
Published ahead of print 17 October 2012
Contributor Information
Ingrid Karlsson, Department of Virology, Statens Serum Institut, Copenhagen, Denmark.
Terese Lea Katzenstein, Department of Infectious Diseases, Rigshospitalet, Copenhagen, Denmark.
Candida Medina Rodrigues, Centro de Tratamento Ambulatório (CTA), Hospital Nacional Simão Mendes (HNSM), Bissau, Guinea-Bissau.
Sanne Jespersen, The Bandim Health Project, Bissau, Guinea-Bissau.
Christoph Mikkel Janitzek, Department of Virology, Statens Serum Institut, Copenhagen, Denmark.
David da Silva Té, Centro de Tratamento Ambulatório (CTA), Hospital Nacional Simão Mendes (HNSM), Bissau, Guinea-Bissau.
Peter Hayes, International AIDS Vaccine Initiative Human Immunology Laboratory, Imperial College London, London, United Kingdom.
REFERENCES
- 1. Carr JK, et al. 1998. Full genome sequences of human immunodeficiency virus type 1 subtypes G and A/G intersubtype recombinants. Virology 247: 22– 31 [DOI] [PubMed] [Google Scholar]
- 2. Chahroudi A, et al. 2005. Measurement of HIV-1 CRF02_AG-specific T cell responses indicates the dominance of a p24(gag) epitope in blood donors in Abidjan, Cote d'Ivoire. J. Infect. Dis. 192: 1417– 1421 [DOI] [PubMed] [Google Scholar]
- 3. Edwards BH, et al. 2002. Magnitude of functional CD8+ T-cell responses to the Gag protein of human immunodeficiency virus type 1 correlates inversely with viral load in plasma. J. Virol. 76: 2298– 2305 [DOI] [PMC free article] [PubMed] [Google Scholar]
- 4. Esbjornsson J, Mild M, Mansson F, Norrgren H, Medstrand P. 2011. HIV-1 molecular epidemiology in Guinea-Bissau, West Africa: origin, demography and migrations. PLoS One 6: e17025 doi:10.1371/journal.pone.0017025 [DOI] [PMC free article] [PubMed] [Google Scholar]
- 5. Fu TM, et al. 2007. Evaluation of cellular immune responses in subjects chronically infected with HIV type 1. AIDS Res. Hum. Retroviruses 23:67– 76 [DOI] [PubMed] [Google Scholar]
- 6. Kalinkovich A, et al. 2001. Increased CCR5 and CXCR4 expression in Ethiopians living in Israel: environmental and constitutive factors. Clin. Immunol. 100: 107– 117 [DOI] [PubMed] [Google Scholar]
- 7. Keefer MC, et al. 2012. A phase I double blind, placebo-controlled, randomized study of a multigenic HIV-1 adenovirus subtype 35 vector vaccine in healthy uninfected adults. PLoS One 7: e41936 doi:10.1371/journal.pone.0041936 [DOI] [PMC free article] [PubMed] [Google Scholar]
- 8. Kemp K, Akanmori BD, Hviid L. 2001. West African donors have high percentages of activated cytokine producing T cells that are prone to apoptosis. Clin. Exp. Immunol. 126:69– 75 [DOI] [PMC free article] [PubMed] [Google Scholar]
- 9. Koesters SA, et al. 2004. Elevation of immune activation in Kenyan women is associated with alterations in immune function: implications for vaccine development. J. Clin. Immunol. 24: 702– 709 [DOI] [PubMed] [Google Scholar]
- 10. Messele T, et al. 1999. Reduced naive and increased activated CD4 and CD8 cells in healthy adult Ethiopians compared with their Dutch counterparts. Clin. Exp. Immunol. 115: 443– 450 [DOI] [PMC free article] [PubMed] [Google Scholar]
- 11. Montavon C, et al. 2000. Most env and gag subtype A HIV-1 viruses circulating in West and West Central Africa are similar to the prototype AG recombinant virus IBNG. J. Acquir. Immune Defic. Syndr. 23: 363– 374 [DOI] [PubMed] [Google Scholar]
- 12. Moodie Z, et al. 2010. Response definition criteria for ELISPOT assays revisited. Cancer Immunol. Immunother. 59: 1489– 1501 [DOI] [PMC free article] [PubMed] [Google Scholar]
- 13. Tiba F, et al. 2011. Constitutive activation and accelerated maturation of peripheral blood T cells in healthy adults in Burkina Faso compared to Germany: the case of malaria? Eur. J. Med. Res. 16: 519– 525 [DOI] [PMC free article] [PubMed] [Google Scholar]


