

Abstract
The safety and efficacy of a single 1,200-mg dose of the lipoglycopeptide oritavancin are currently being investigated in two global phase 3 studies of acute bacterial skin and skin structure infections. In this study, an in vitro pharmacokinetic/pharmacodynamic model was established to compare the free-drug pharmacodynamics associated with a single 1,200-mg dose of oritavancin to once-daily dosing with daptomycin at 6 mg/kg of body weight and twice-daily dosing with vancomycin at 1,000 mg against three methicillin-resistant Staphylococcus aureus (MRSA) strains over 72 h. The area under the bacterial-kill curve (AUBKC) was used to assess the antibacterial effect of each dosing regimen at 24 h (AUBKC0-24), 48 h (AUBKC0-48), and 72 h (AUBKC0-72). The rapid bactericidal activities of oritavancin and daptomycin contributed to lower AUBKC0-24s for the three MRSA strains than with vancomycin (P < 0.05, as determined by analysis of variance [ANOVA]). Oritavancin exposure also resulted in a lower AUBKC0-48 and AUBKC0-72 against one MRSA strain and a lower AUBKC0-48 for another strain than did vancomycin exposure (P < 0.05). Furthermore, daptomycin exposure resulted in a lower AUBKC0-48 and AUBKC0-72 for one of the MRSA isolates than did vancomycin exposure (P < 0.05). Lower AUBKC0-24s for two of the MRSA strains (P < 0.05) were obtained with oritavancin exposure than with daptomycin. Thus, the antibacterial effect from the single-dose regimen of oritavancin is as effective as that from either once-daily dosing with daptomycin or twice-daily dosing with vancomycin against the MRSA isolates tested in an in vitro pharmacokinetic/pharmacodynamic model over 72 h. These results provide further justification to assess the single 1,200-mg dose of oritavancin for treatment of acute bacterial skin and skin structure infections.
INTRODUCTION
The investigational lipoglycopeptide oritavancin is derived from the natural product chloroeremomycin by addition of a 4′-chlorobiphenylmethyl group to the molecule. Oritavancin exerts rapid and concentration-dependent bactericidal activity against Gram-positive pathogens in vitro, distinguishing it from both chloroeremomycin and the prototypic glycopeptide vancomycin (1, 2). Oritavancin antibacterial activity is not affected by antistaphylococcal beta-lactam resistance, exhibiting similar potencies (MIC90 = 0.12 μg/ml) against both methicillin-susceptible and -resistant isolates (3).
Population analysis of the pharmacokinetics (PK) of oritavancin in patients from phase 2 or 3 studies revealed dose-linear PK that are best described by a three-compartment model with two distributional (alpha and beta) half-lives (t1/2s) of 2.0 and 31.3 h and a terminal elimination (gamma) half-life of 393 h (4). Oritavancin is not metabolized and is slowly excreted unchanged in urine and feces (5). The PK/pharmacodynamic (PK/PD) profile associated with optimal efficacy in vivo occurs when oritavancin is administered as a front-loaded dosing regimen (6, 7). This attribute was recently confirmed clinically in a phase 2 study of acute bacterial skin and skin structure infections (ABSSSI) in which a single infusion of 1,200 mg oritavancin yielded efficacy and safety comparable to those of a once-daily dosing regimen of 200 mg oritavancin for 3 to 7 days (8). The single 1,200-mg dose regimen of oritavancin is currently being investigated in two global phase 3 studies of ABSSSI using vancomycin as a comparator (http://clinicaltrials.gov/ct2/show/NCT01252719 and http://clinicaltrials.gov/ct2/show/NCT01252732).
In vitro PK/PD models are useful tools to understand the PD of antimicrobial agents (9). Furthermore, they can be used to support the determination of susceptibility breakpoints for antibacterial agents (10). An in vitro PK/PD model was previously used to investigate oritavancin PD from total drug estimates resulting from a once-daily dosing regimen of 200 mg used in past clinical studies (11). In light of recent advances in understanding of oritavancin potency against Gram-positive pathogens (12), population PK (4), and serum-protein binding (13), we have established an in vitro PK/PD model that can mimic the multiexponential decay of oritavancin that occurs in humans following intravenous (i.v.) dosing and can simultaneously determine its antibacterial activity against Gram-positive pathogens. Using this model, we investigated the PD associated with free-drug estimates of simulated dosing regimens of a single 1,200-mg dose of oritavancin, once-daily dosing with daptomycin at 6 mg/kg of body weight, and 1,000 mg vancomycin every 12 h (q12h) against three methicillin-resistant Staphylococcus aureus (MRSA) isolates over 72 h.
(Part of this work was presented at the 51st Interscience Conference on Antimicrobial Agents and Chemotherapy, Chicago, IL, 17 to 20 September 2011 [14].)
MATERIALS AND METHODS
Bacterial isolates and MIC determinations.
The three clinical MRSA isolates used in this study were the ATCC reference strain 33591 (susceptible to daptomycin and vancomycin), the community-associated strain NRS123 (obtained from the Network of Antimicrobial Resistance in S. aureus repository; susceptible to daptomycin and vancomycin), and 1561603 (Eurofins Medinet; susceptible to daptomycin; heterogenous-vancomycin-intermediate S. aureus [hVISA] [15]). Broth microdilution MICs were determined by following CLSI M7-A8 guidelines (16). Following drug exposure in the in vitro PK/PD model, antimicrobial susceptibilities were determined by broth microdilution for any isolates which survived challenge (typically from the 72-h time point, if present), and susceptibilities were compared to those of the corresponding baseline isolates. As initial broth microdilution MICs with 0.01% polysorbate 80 (the percentage used in the in vitro PK/PD model; P80) were equivalent to those under standardized conditions with 0.002% P80 (16), MIC testing on isolates from the present study was performed using 0.002% P80. For surviving isolates that exhibited a ≥4-fold increase in MIC, the MICs were reassessed following four consecutive days of passage on cation-adjusted Mueller-Hinton agar.
In vitro PK/PD model.
A continuous-flow, one-compartment in vitro PK/PD model that consisted of a 1-liter central polypropylene flask (Nalgene; Thermo Scientific, Rochester, NY) with a modified cap to include inlet, outlet, sampling, and infusion ports was used to investigate the PD of simulated dosing regimens of oritavancin, daptomycin, and vancomycin. The flask, representing the central compartment, was filled with 250 ml cation-adjusted Mueller-Hinton broth (CAMHB) for vancomycin, CAMHB supplemented with 0.01% P80 (to prevent drug precipitation and nonspecific binding to surfaces [17]) for oritavancin, or CAMHB supplemented with 50 μg/ml CaCl2 for daptomycin (16). Fresh medium was delivered to the flask via the inlet port by peristaltic pump (Masterflex model 7550–10; Cole-Parmer Inc., Montreal, Quebec, Canada).
For oritavancin, a series of monoexponential elimination rates was used to replicate the mean concentration/time profile derived from 2,000 simulated patients (using mean parameter estimates from the population PK model [4]) receiving a single 1,200-mg infusion of oritavancin over 3 h (C. Rubino, personal communication). Flow rates and their respective durations to account for the 72-h challenge were as follows: 1.25 ml/min for 5.04 h (to simulate the alpha half-life for a duration including the 3-h infusion), 0.94 ml/min for 2.96 h, 0.31 ml/min for 25.2 h (to simulate the beta half-life), and 0.05 ml/min for 38.8 h (to simulate the gamma half-life). Assuming protein binding of 85% for oritavancin (13), targeted mean population PK parameters were a free maximum concentration of drug in serum (ƒCmax) of 19.4 μg/ml and a 24-h free area under the curve (ƒAUC0-24) of 138.1 μg · h/ml.
For daptomycin, free-drug PK parameters associated with the approved dosage for bacteremia of 6 mg/kg once daily (ƒCmax of 8 μg/ml assuming mean protein binding of 91.5%; t1/2, 8 h) (Cubicin prescribing information [http://www.cubicin.com/pdf/PrescribingInformation.pdf]) were targeted using a flow rate of 0.36 ml/min over 72 h. For vancomycin, free-drug PK parameters associated with 1,000 mg q12h (ƒCmax of 15 μg/ml assuming mean protein binding of 55%; t1/2, 6 h [18]) were targeted using a flow rate of 0.48 ml/min for 72 h.
The central compartment of the model was inoculated with approximately 6 log CFU/ml of each test strain and incubated for 72 h at 37°C with stirring (380 rpm) using a magnetic stir bar. Aliquots were taken at various time points, sampled for bacterial viability by serial dilution plating in the presence of 25 mg/ml activated charcoal to prevent drug carryover, and frozen at −20°C until drug concentrations were determined. Values presented are the log of the mean CFU/ml ± standard deviation (SD) of two independent experiments done in duplicate, with the exception of oritavancin against MRSA NRS123 and daptomycin against MRSA ATCC 33591, for which four independent experiments were performed in duplicate for each drug. Bactericidal activity was defined as ≥3 log killing of organisms at 24 h compared to the inoculum (19).
Dosing of antibiotics in the in vitro PK/PD model.
An oritavancin solution of 1.2 mg/ml was infused through the infusion port at a rate of 2.08 ml/h over 3 h using a programmable syringe pump (model number BS-9000-2; Braintree Scientific Inc., MA). Bolus once-daily dosing with daptomycin was done manually over 1 min. For vancomycin, the first dose of each day was added manually by bolus addition over 1 min, whereas the programmable syringe pump was used to deliver the second bolus dose of each day.
Determination of oritavancin, daptomycin, and vancomycin concentrations.
Prior to determination of oritavancin concentrations in the in vitro PK/PD model by liquid chromatography-mass spectrometry, sample aliquots were heated to 75°C for 30 min to kill remaining viable bacteria. Samples were analyzed by liquid chromatography-mass spectrometry directly after adjusting the P80 level to 0.02% and diluting with 0.002% P80 and 0.2% formic acid in 20:80 (vol/vol) methanol-water. The resulting solution was loaded on a Zorbax SB-Aq (3.5-μm, 2.1- by 50-mm) column and eluted with a programmed gradient of 0.1% formic acid in methanol and 0.1% formic acid in water over 6 min. N3-4(4-Ethylphenyl)benzyl chloroeremomycin was used as the internal standard. The mass spectrometry detection was performed in multiple-reaction monitoring mode on an API3000 triple quadrupole mass spectrometer (AB Sciex, Foster City, CA). For oritavancin, the mass/charge ratio (m/z) 598.5 was fragmented into 825.9. For the internal standard, m/z 596.4 was fragmented into 822.7. The linear range of sensitivity was 1.0 to 30 μg/ml. Samples with concentrations below the lower limit of the linear range but within the 25% coefficient of variation (CV) for the lower limit of quantification were included in the concentration/time profile (e.g., concentrations obtained at 48 to 72 h).
For quantification of oritavancin by bioassay, samples were heated to 75°C for 30 min to kill remaining viable bacteria. Although these conditions are known not to affect stability of the molecule (data not shown), oritavancin standards were similarly heated for consistency. One-hundred-microliter aliquots of either standards or samples were dispensed into bored wells of cation-adjusted Mueller-Hinton agar plates containing 5% lysed horse blood which were then kept at room temperature for 72 h to allow for diffusion of oritavancin. Plates were seeded by swabbing the agar surface with a suspension (optical density at 600 nm [OD600] = 0.1) with the indicator strain Streptococcus pneumoniae ATCC 49619 and then incubating the plates overnight at 37°C in 5% CO2. Inhibition zone diameters were measured and concentrations determined by nonlinear regression analysis (with interpolation from standard curves) using GraphPad Prism 5 software. Concentrations presented for oritavancin are the means ± SDs from 8 independent experiments performed in duplicate; the 24-h free area under the concentration-time curves (ƒAUC0-24) for oritavancin PK profiles were calculated using GraphPad Prism 5 software.
Targeted concentrations of daptomycin and vancomycin were confirmed by bioassay and are presented as the means ± SDs from 8 and 6 independent experiments done in duplicate, respectively (only the first dose of the first day in each experiment was confirmed). Briefly, wells were bored in antibiotic medium 1 agar (Difco, Sparks, MD) supplemented with 50 μg/ml CaCl2 and 5% lysed horse blood. Vancomycin standards and samples were heated at 75°C for 30 min to kill viable bacteria remaining in the samples. Fifty microliters of standard or sample was added to each well and allowed to diffuse overnight at room temperature. A suspension (OD600 = 0.1) of the indicator strain Streptococcus pyogenes ATCC 12962 was swabbed onto the agar surface, and then plates were incubated overnight at 37°C in 5% CO2. Inhibition zone diameters (in mm) were measured using a ruler. Sample concentrations were determined using linear regression analysis derived from standard curves as indicated above. The limits of detection for the daptomycin and vancomycin bioassays were 0.5 μg/ml and 2.5 μg/ml, respectively. Half-lives for daptomycin and vancomycin were calculated using nonlinear regression analysis (Prism 5) of the concentration/time curves obtained from the respective bioassays.
Statistical analysis and quantification of antibacterial effect.
The mean changes in bacterial viability (log CFU/ml) relative to inoculum at the specified exposure times were analyzed by one-way analysis of variance (ANOVA) using the Tukey posttest (Prism 5) to determine statistical significance (P < 0.05). Comparisons of mean changes in bacterial viability following 4 h of exposure to daptomycin and vancomycin were analyzed using the t test (Prism 5) to determine statistical significance (P < 0.05). The area under the bacterial-kill curves (AUBKC) for the time intervals of 24 h (AUBKC0–24), 48 h (AUBKC0–48), and 72 h (AUBKC0–72) were calculated as a measure of the antibacterial effect (18) for each dosing regimen using log-transformed viable bacterial counts (Prism 5); the limit of detection (66.7 CFU/ml) was used as the baseline in the calculation. One-way ANOVA using the Tukey posttest (Prism 5) was used to determine statistical significance among the AUBKC values (P < 0.05).
RESULTS
Susceptibilities of the MRSA isolates.
As shown in Table 1, oritavancin exhibited MICs of 0.12 and 0.06 μg/ml against MRSA strains NRS123 and ATCC 33591, respectively. These strains were thus representative of wild-type strains for susceptibility to oritavancin with MICs less than or equal to the MIC90 of 0.12 μg/ml for S. aureus (3). Furthermore, both isolates were susceptible to daptomycin and vancomycin, with MICs of 0.5 and 1 μg/ml, respectively (Table 1). The clinical isolate MRSA-hVISA 1561603 was obtained from an ongoing oritavancin surveillance program, and it demonstrated an unusually variable distribution of oritavancin broth microdilution MICs ranging from 0.12 to 4 μg/ml with repeated testing (Table 1). MICs for daptomycin and vancomycin were both 1 μg/ml for MRSA-hVISA 1561603.
Table 1.
Susceptibility profiles of the MRSA strains used in this study
| Antibacterial agent | MIC (μg/ml) for strain: |
||
|---|---|---|---|
| MRSA NRS123 | MRSA ATCC 33591 | MRSA-hVISA 1561603a | |
| Oritavancin | 0.12 | 0.06 | 0.12–4b |
| Daptomycin | 0.5 | 0.5 | 1 |
| Vancomycin | 1 | 1 | 1 |
| Oxacillin | 32 | 128 | 128 |
hVISA confirmed by population analysis profile testing (15).
MRSA-hVISA 1561603 exhibited a variable oritavancin broth microdilution MIC ranging from 0.12 to 4 μg/ml.
Validation of PK modeling.
For oritavancin, infusion conditions were established which approximated the mean free-drug concentration/time profile derived from human population PK modeling. Oritavancin was infused at a concentration used in patients (1.2 mg/ml) over 3 h, during which time a dilutional flow rate (1.25 ml/min) was used to simulate the alpha half-life distribution in the in vitro PK/PD model. Following the infusion and alpha half-life period, an intermediate flow rate (0.94 ml/min for 2.96 h) was incorporated to fit the mean free-drug concentration/time profile and its consequent ƒAUC0–24. Analysis of the free-drug concentration/time curve from the in vitro PK/PD model (8 experiments) (Fig. 1) showed that the mean values for ƒCmax (19.8 ± 2.0 μg/ml; range of 16.0 to 22.2 μg/ml) and ƒAUC0–24 (136.8 ± 25.9 μg · h/ml; range of 94.2 to 168.7 μg · h/ml) were within 2.0% and 0.9%, respectively, of targeted values from the mean population PK profile (Table 2). Assessment of daptomycin concentrations in the in vitro PK/PD model revealed an ƒCmax of 7.6 ± 0.3 μg/ml and a half-life of 7.0 ± 0.3 h, which were within 5.0% and 12.5% of the targeted values (Table 2). Similarly, the vancomycin ƒCmax of 15.4 ± 0.7 μg/ml and half-life of 5.9 ± 0.7 h were within 2.6% and 1.7% of targeted values (Table 2). These results demonstrate that both monoexponential decay PK profiles for daptomycin and vancomycin and the more complex multiexponential decay PK profile for oritavancin can be reproducibly simulated in the in vitro PK/PD model using the conditions described here.
Fig 1.
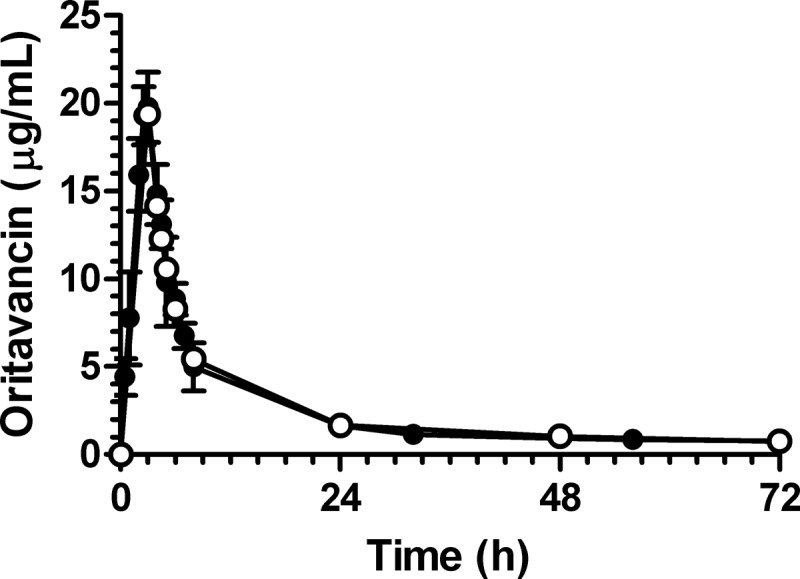
Mean oritavancin concentration-time profiles for single-dose infusion over 3 h as obtained by population PK modeling (○; predicted free drug levels from a single 1,200-mg dose based on estimated 85% protein binding) and as measured in the in vitro PK/PD model (●; n = 8 independent experiments; actual measured drug level in model).
Table 2.
Pharmacokinetic parameters obtained for the indicated dosing regimens in the in vitro PK/PD model
| Parameter | Value with indicated dosing regimen |
|||||
|---|---|---|---|---|---|---|
| Oritavancin |
Daptomycin |
Vancomycin |
||||
| 1,200-mg single dose |
6 mg/kg once daily |
1,000 mg q12h |
||||
| Targeteda | Obtained | Targetedb | Obtained | Targetedc | Obtained | |
| ƒCmax (μg/ml) | 19.4 | 19.8 ± 2.0 | 8 | 7.6 ± 0.3 | 15 | 15.4 ± 0.7 |
| Half-life (h) | NDd | ND | 8 | 7.0 ± 0.3 | 6 | 5.9 ± 0.7 |
| ƒAUC0–24 | 138.1 | 136.8 ± 25.9 | ND | ND | ND | ND |
The mean population PK model was used to derive the targeted PK values from 2,000 simulated patients receiving a single 1,200-mg dose of oritavancin during a 3-h infusion (assuming protein binding of 85%).
The targeted PK values for daptomycin were derived from the full prescribing information (assuming protein binding of 91.5%) (Cubicin prescribing information [http://www.cubicin.com/pdf/PrescribingInformation.pdf]).
The targeted PK values for vancomycin were obtained from reference 9.
ND, not determined.
Antibacterial effect of simulated dosing regimens.
The PD of simulated dosing regimens of oritavancin, daptomycin, and vancomycin against the three MRSA strains were determined. As shown in Table 3 and Fig. 2, a single-dose infusion of oritavancin that approximated the predicted mean free-drug concentration-time profile in serum of patients receiving a single 1,200-mg dose exerted rapid bactericidal activity (at least 3 log kill relative to inoculum) within the first 2 h of the 3 h of infusion against the three MRSA isolates: mean decreases in log CFU/ml were significantly greater at 2 h than those from vancomycin exposure (Table 3) (P < 0.05). Oritavancin exposure also resulted in significantly greater mean decreases in log CFU/ml at 8 h for MRSA isolates NRS123 and 1561603 compared to vancomycin exposure and at 24 h for MRSA ATCC 33591 compared to daptomycin and vancomycin exposures (Table 3) (P < 0.05). Bactericidal activity of oritavancin was sustained over 72 h against the three MRSA strains (Table 3 and Fig. 2). No changes in the profile of susceptibility to oritavancin, daptomycin, vancomycin, or oxacillin were observed for any surviving isolates of the three MRSA strains following exposure to oritavancin.
Table 3.
Mean decrease in bacterial viability relative to inoculum of the MRSA strains exposed to oritavancin, daptomycin, and vancomycin in the in vitro PK/PD model
| Exposure time (h) | Mean decrease in bacterial viability (log CFU/ml ± SD)a |
||||||||
|---|---|---|---|---|---|---|---|---|---|
| MRSA NRS123 |
MRSA ATCC 33591 |
MRSA-hVISA 1561603 |
|||||||
| Oritavancin | Daptomycin | Vancomycin | Oritavancin | Daptomycinb | Vancomycin | Oritavancin | Daptomycin | Vancomycin | |
| 2 | −4.3 ± 0.1* | −3.6 ± 0.2* | −0.6 ± 0.3 | −3.7 ± 0.4** | −2.6 ± 0.3* | −0.2 ± 0.1 | −4.0 ± 0.1* | −2.7 ± 0.5* | −0.1 ± 0.1 |
| 4 | Not done | −4.0 ± 0.1* | −1.2 ± 0.2 | Not done | −3.8 ± 0.1* | −0.8 ± 0.3 | Not done | −3.4 ± 1.1 | −0.3 ± 0.0 |
| 8 | −4.2 ± 0.7* | −3.6 ± 1.1 | −1.7 ± 0.6 | −4.0 ± 0.4 | −3.8 ± 0.5 | −2.6 ± 0.5 | −4.1 ± 0.1* | −3.3 ± 0.8* | −0.8 ± 0.1 |
| 24 | −3.3 ± 0.7 | −4.2 ± 0.0 | −3.2 ± 0.3 | −4.1 ± 0.0*** | −2.2 ± 0.5 | −3.2 ± 0.8 | −4.1 ± 0.1 | −3.1 ± 0.6 | −2.7 ± 0.2 |
| 48 | −4.0 ± 0.4 | −4.1 ± 0.2 | −3.4 ± 0.2 | −4.0 ± 0.1 | −2.9 ± 1.1 | −3.2 ± 0.6 | −3.4 ± 1.0 | −3.2 ± 0.3 | −3.4 ± 0.6 |
| 72 | −3.6 ± 0.6 | −3.1 ± 1.1 | −3.2 ± 0.3 | −3.9 ± 0.3 | −2.0 ± 1.1 | −3.1 ± 1.2 | −3.3 ± 0.3 | −2.7 ± 0.7 | −3.5 ± 0.5 |
*, decrease in log CFU/ml significantly different from the corresponding value obtained for vancomycin at the same exposure time (P < 0.05). Comparisons of daptomycin to vancomycin after 4 h of exposure were determined to be significantly different using the t test (P < 0.05). **, decrease in log CFU/ml significantly different from the corresponding values obtained for daptomycin and vancomycin at the same exposure time (P < 0.05). ***, decrease in log CFU/ml significantly different from the corresponding value obtained for daptomycin at the same exposure time (P < 0.05).
Experimental replicates in which reduced susceptibility to daptomycin was detected against MRSA ATCC 33591 (three of eight replicates from four independent experiments) were excluded from these calculations.
Fig 2.
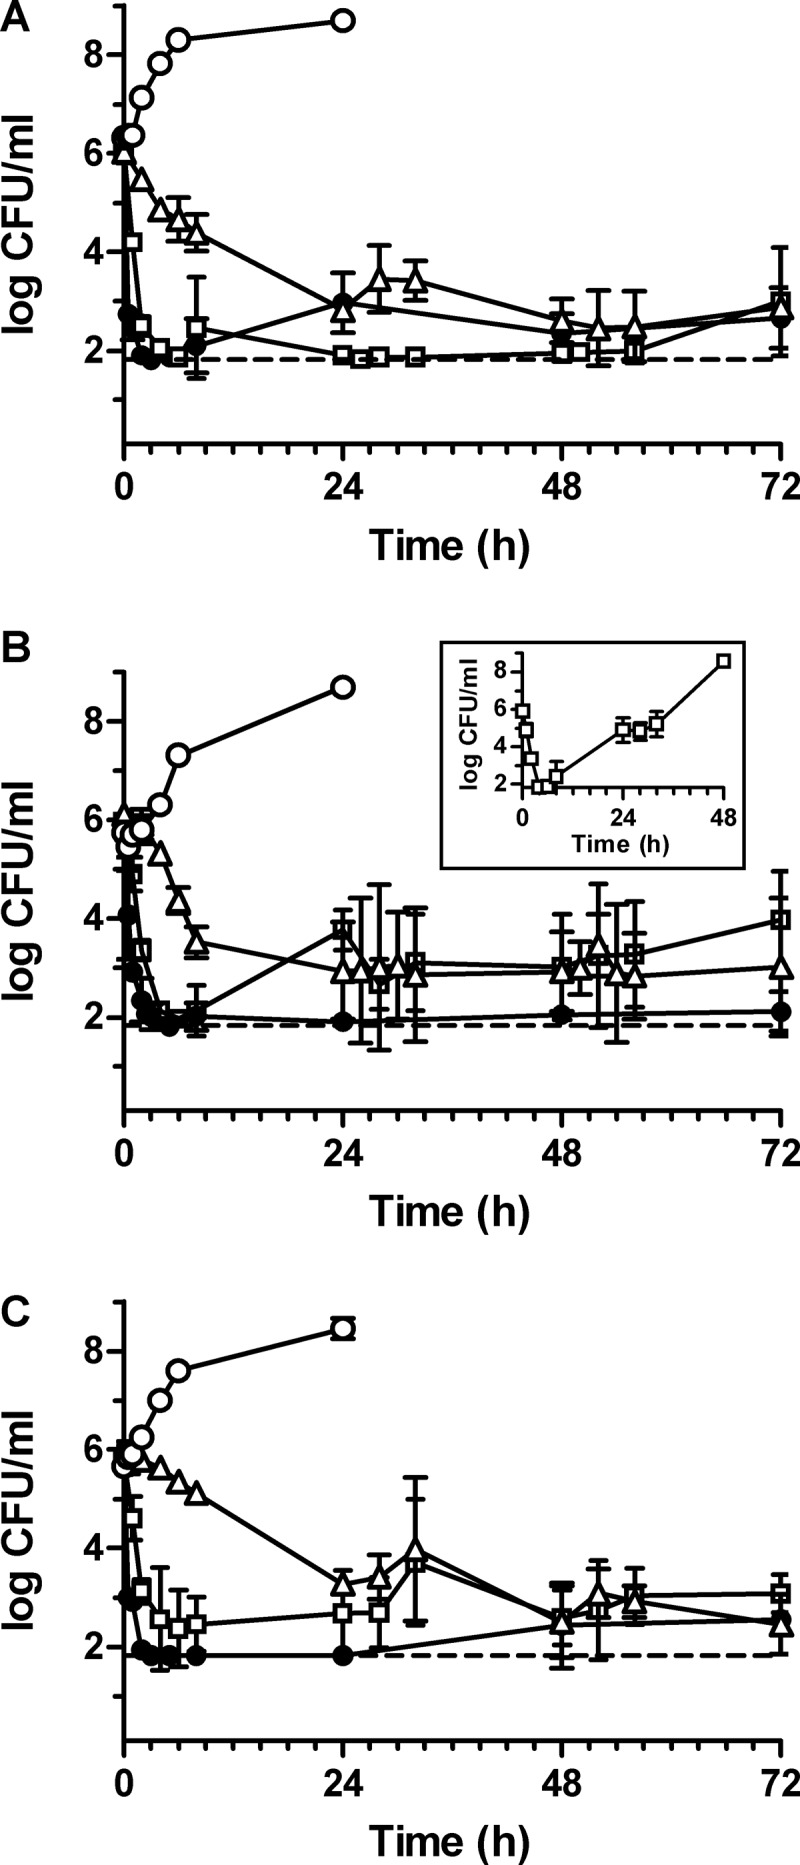
Pharmacodynamics of simulated dosing regimens of a single dose of 1,200 mg oritavancin (●), once-daily dosing with 6 mg/kg daptomycin (□), and q12h dosing with 1,000 mg vancomycin (△) against MRSA NRS123 (A), MRSA ATCC 33591 (B), and MRSA-hVISA 1561603 (C) over 72 h. The inset in panel B depicts the pharmacodynamic activity of daptomycin against MRSA ATCC 33591 in replicate experiments (three of eight replicates from four independent experiments) in which changes in susceptibility to daptomycin occurred. No-drug growth controls (○) for each MRSA isolate were performed using the flow rates for oritavancin PK simulations to supply fresh medium over 24 h. The limit of detection (dashed line) of viable bacteria is 66.7 CFU/ml.
Compared to vancomycin, daptomycin exposure resulted in mean decreases in log CFU/ml that were significantly greater for all three MRSA strains at 2 h (Table 3) (P < 0.05) and was bactericidal within 4 h (Table 3 and Fig. 2). Bactericidal activity of daptomycin was sustained over 72 h for MRSA NRS123 (Table 3 and Fig. 2A). Against MRSA-hVISA 1561603, daptomycin maintained bactericidal activity over 48 h and exerted a mean of 2.7 ± 0.7 log kill at 72 h compared to starting inocula (Table 3 and Fig. 2C). No changes in the daptomycin susceptibility profile were observed for surviving isolates of NRS123 and 1561603 following exposure to daptomycin. Daptomycin exhibited sustained antibacterial activity against MRSA ATCC 33591 in five of eight replicates (from four independent experiments, each done in duplicate), with a mean of 2.0 ± 1.1 log kill observed at 72 h compared to starting inocula (Fig. 2B). In the remaining three replicates, bacterial growth surpassed a density of 8 log CFU/ml by 48 h (Fig. 2B, inset). Surviving isolates of MRSA ATCC 33591 from these replicated experiments exhibited daptomycin MICs of 4 μg/ml (compared to 0.5 μg/ml for the parental strain), oritavancin MICs of 0.5 μg/ml (compared to 0.06 μg/ml for the parental strain), and vancomycin MICs of 2 to 4 μg/ml (compared to 1 μg/ml for the parental strain).
Bacterial killing by vancomycin was not as rapid as that by oritavancin or daptomycin against the three MRSA isolates (Table 3 and Fig. 2). Bactericidal activity was observed against MRSA NRS123 and MRSA ATCC 33591 at 24 h (Fig. 2A and B), whereas a mean of 2.7 ± 0.2 log kill was attained against the MRSA-hVISA 1561603 at that time (Fig. 2C). Vancomycin also suppressed bacterial growth over 72 h, exerting bactericidal activity against the three MRSA strains at 72 h, compared to starting inocula (Fig. 2C). Despite equivalent in vitro susceptibility, vancomycin exerted activity against MRSA-hVISA 1561603, but bacterial killing was slower than against the two standard MRSA strains. No changes in the susceptibility profile were observed for surviving isolates of the three MRSA strains following exposure to vancomycin.
The AUBKC for each dosing regimen was calculated and used as a measure to more rigorously compare the antibacterial effects against the MRSA isolates (18). As shown in Table 4, the rapid bactericidal activity of oritavancin contributed to significantly lower AUBKC0–24 values for the three MRSA strains than with vancomycin (P < 0.05). The remaining AUBKC values against the three MRSA isolates trended lower than those obtained for vancomycin: the AUBKC0–48 for MRSA NRS123 as well as the AUBKC0–48 and AUBKC0–72 for MRSA-hVISA 1561603 were significantly lower (P < 0.05) (Table 4). Daptomycin exposure also trended to lower AUBKC values than did vancomycin, with significantly lower daptomycin AUBKC0–24s for all three strains and a lower AUBKC0–48 and AUBKC0–72 for MRSA NRS123 (P < 0.05) (Table 4). Comparing the antibacterial effects of oritavancin and daptomycin regimens, oritavancin exposure resulted in AUBKCs that trended to lower values against MRSA 33591 and MRSA-hVISA 1561603, of which the AUBKC0–24s were significantly lower (P < 0.05). For MRSA NRS123, daptomycin AUBKCs trended to lower values than did oritavancin AUBKCs, but the differences were not significant (P > 0.05) (Table 4). These results show that the antibacterial effect obtained from the modeled single dose of oritavancin over 72 h was at least equivalent to the antibacterial effect obtained with once-daily dosing of daptomycin or q12h dosing with vancomycin.
Table 4.
Antibacterial effect at the indicated time intervals for the dosing regimens against the MRSA strains
| Measure of antibacterial effect | Value (mean ± SD) fora: |
||||||||
|---|---|---|---|---|---|---|---|---|---|
| MRSA NRS123 |
MRSA ATCC 33591 |
MRSA-hVISA 1561603 |
|||||||
| Oritavancin | Daptomycin | Vancomycin | Oritavancin | Daptomycinb | Vancomycin | Oritavancin | Daptomycin | Vancomycin | |
| AUBKC0–24 | 14.6 ± 5.2* | 12.9 ± 9.2* | 54.4 ± 2.7 | 6.1 ± 0.6** | 24.9 ± 2.6* | 48.7 ± 5.2 | 2.5 ± 0.1** | 21.8 ± 1.5* | 67.9 ± 0.1 |
| AUBKC0–48 | 34.6 ± 7.1* | 14.4 ± 11.3* | 85.2 ± 6.0 | 9.8 ± 3.2 | 54.9 ± 17.3 | 75.0 ± 33.3 | 9.8 ± 10.2* | 51.9 ± 20.4 | 104.1 ± 10.9 |
| AUBKC0–72 | 51.0 ± 8.4 | 26.4 ± 22.6* | 104.3 ± 5.0 | 15.9 ± 10.4 | 93.8 ± 39.9 | 102.5 ± 58.2 | 25.9 ± 22.4* | 79.2 ± 28.1 | 126.5 ± 9.8 |
*, AUBKC significantly different from the corresponding AUBKC obtained for vancomycin at the same time interval (P < 0.05); **, AUBKC significantly different from the corresponding AUBKC obtained for daptomycin and vancomycin at the same time interval (P < 0.05).
Experimental replicates in which reduced susceptibility to daptomycin was detected against MRSA ATCC 33591 (three of eight replicates from four independent experiments) were excluded from the AUBKC calculations.
DISCUSSION
The in vitro PK/PD model described here offers an effective method to reproducibly study the PD of dosing regimens of oritavancin and comparator agents under clinically meaningful conditions. Using parameters from the oritavancin population PK model, the mean free-drug concentration-time profile for oritavancin was estimated from 2,000 simulated patients receiving a single 1,200-mg dose of oritavancin administered over a 3-h infusion. Analysis of oritavancin PK in the phase 2 and 3 patient population revealed a 10-fold range in Cmax (range, 10.9 to 131 μg/ml) and AUC0–24 (42.2 to 618 μg · h/ml) from a 200-mg/day dosing regimen (4). In this context, the variability of the ƒCmax (CV = 10.1%) and ƒAUC0–24 (CV = 18.9%) obtained experimentally in the in vitro PK/PD model is modest and could allow for PD determinations in special patient populations that present altered pharmacokinetics for oritavancin, such as patients with higher and lower clearance rates.
The MIC90 of oritavancin against S. aureus isolates in ongoing surveillance programs is 0.12 μg/ml (3). Since resistance to oritavancin has not yet been defined and because >99.99% of vancomycin-susceptible S. aureus isolates have an oritavancin MIC of <0.5 μg/ml, it is likely that the MIC distribution range for wild-type isolates does not exceed 0.25 μg/ml at its uppermost margin. Both MRSA NRS123 and ATCC 33591 are typical of wild-type isolates. The clinical isolate MRSA-hVISA 1561603 was identified from an ongoing oritavancin surveillance program because its oritavancin MIC was reported as 2 μg/ml, among the highest MICs recorded for a non-VISA phenotype. Subsequent MIC retesting resulted in a distribution of oritavancin MICs ranging from 0.12 to 4 μg/ml. It remains to be determined if the hVISA phenotype for this isolate (15) accounts for the range of oritavancin MICs obtained by the broth microdilution method since other hVISA isolates do not exhibit this phenomenon (data not shown). Regardless of its MIC variability, the AUBKC0–72 for oritavancin against MRSA-hVISA 1561603 was not significantly different from those of MRSA NRS123 and ATCC 33591 in the in vitro PK/PD model (P > 0.05). Furthermore, a humanized dosing regimen of the single 1,200-mg dose of oritavancin in a neutropenic mouse thigh model of infection was similarly effective against both MRSA-hVISA 1561603 and wild-type isolates, including MRSA NRS123 (7). Therefore, despite its hVISA phenotype and its uncharacteristic variability in oritavancin broth microdilution MICs against this strain, oritavancin exhibits a PD profile against MRSA-hVISA 1561603 that is similar to those against the wild-type MRSA isolates NRS123 and ATCC 33591.
In vitro PK/PD modeling has proven to be a useful tool in elucidating how different dosing regimens prevent or evoke resistance development, described by the mutant selection window hypothesis and the inverted U-shaped pattern of bacterial killing as a function of exposure (20, 21). Other in vitro PK/PD studies have shown that drug exposure may elicit survival of bacterial isolates that retain susceptibility to the test agent (18, 22–24). How these survivors subsist despite exposure to antibacterial agents at concentrations that are above the MIC or minimal bactericidal concentration remains poorly understood. Whether these survivors reflect only an in vitro phenomenon or are relevant to clinical infection warrants further exploration, as they may confound interpretation of antibacterial effect in longer-term in vitro PK/PD studies. Surviving clones/isolates without changes in susceptibility were obtained for each MRSA isolate that was exposed to the clinically relevant tested dosing regimens of oritavancin, daptomycin, and vancomycin. Interestingly, isolates that survived oritavancin challenge only became apparent following reduction of the bacterial cell density to below the limit of detection (66.7 CFU/ml). A similar response also occurred for MRSA NRS123 exposed to daptomycin, whereas survivors of MRSA ATCC 33591 and MRSA-hVISA 1561603 appeared following reduction of the viable bacterial count to near the limit of detection. This likely indicates that only a very limited number (≤0.0001%) of the total bacteria inoculated into the in vitro PK/PD model exhibit a phenotype that promotes survival following drug exposure. In contrast to this phenomenon, only MRSA ATCC 33591 exposed to daptomycin (in three of the eight replicates from four independent experiments) elicited an altered susceptibility profile to the three drugs. Reduced susceptibility to daptomycin and concurrent reduced susceptibility to vancomycin have been reported for MRSA isolates exposed to daptomycin under different in vitro conditions (25–27). Recently, MRSA isolates with reduced susceptibility to daptomycin exhibited oritavancin MICs between 0.06 and 0.5 μg/ml; oritavancin killing activity against these isolates was similar to that of daptomycin-susceptible isolates (28, 29). Because oritavancin and daptomycin both perturb bacterial membrane potential to effect killing (1, 30, 31), it is plausible that reduced susceptibility to daptomycin may impact oritavancin susceptibility in some instances, such as reported here. A more thorough analysis of the daptomycin PK/PD targets (e.g., AUC/MIC) that are associated with the mutant selection window for MRSA ATCC 33591 may help explain the reduced susceptibility to daptomycin that was occasionally observed in this study.
Because oritavancin antibacterial activity is concentration dependent (2, 32), it is expected that the PD index associated with bacterial eradication would be best described by exposures that maximize ratios of Cmax/MIC or AUC/MIC. Dose fractionation studies of oritavancin in in vivo infection models have identified the Cmax/MIC and AUC/MIC ratios as strong predictors of bacterial eradication (33, 34). An in-depth analysis of the AUC/MIC ratio in relation to bacterial eradication of five S. aureus isolates in the same infection model identified important PK/PD targets and demonstrated that front-loaded doses of oritavancin result in greater antibacterial activity than do fractionated doses (7, 35), confirming earlier findings with a single strain (33). Correspondingly, a single 1,200-mg dose of oritavancin was comparable in terms of safety and efficacy to once-daily dosing with 200 mg for 3 to 7 days in a recent phase 2 study of ABSSSI (8). As has been done for other agents (10, 36), dose-ranging studies in the in vitro PK/PD model combined with Monte Carlo simulations could be used to predict target attainment rates and help support determination of the susceptibility breakpoint for oritavancin.
In conclusion, simulation of free-drug PK parameters for oritavancin derived from population PK studies in a newly established in vitro PK/PD model revealed the potent antibacterial activity associated with the 1,200-mg single-dose regimen. As demonstrated by the rapid bactericidal activity of the single dose, it is interesting to speculate whether this feature would be of clinical benefit to the treatment of certain types of infections (37). Future studies with the in vitro PK/PD model could help guide dose selection of oritavancin for severe infections as well as for patients with special PK profiles. Other studies could help identify a PD index associated with bacterial eradication and provide support for determining the susceptibility breakpoint for oritavancin. In light of recent studies that optimized PK/PD targets to prevent in vitro changes in susceptibility, in vitro PK/PD modeling could also assist in elucidating PK/PD targets for oritavancin that inhibit the emergence of reduced susceptibility to this investigational agent.
Footnotes
Published ahead of print 22 October 2012
REFERENCES
- 1. Belley A, McKay GA, Arhin FF, Sarmiento I, Beaulieu S, Fadhil I, Parr TR, Jr, Moeck G. 2010. Oritavancin disrupts membrane integrity of Staphylococcus aureus and vancomycin-resistant enterococci to effect rapid bacterial killing. Antimicrob. Agents Chemother. 54:5369–5371 [DOI] [PMC free article] [PubMed] [Google Scholar]
- 2. McKay GA, Beaulieu S, Arhin FF, Belley A, Sarmiento I, Parr T, Jr, Moeck G. 2009. Time-kill kinetics of oritavancin and comparator agents against Staphylococcus aureus, Enterococcus faecalis and Enterococcus faecium. J. Antimicrob. Chemother. 63:1191–1199 [DOI] [PubMed] [Google Scholar]
- 3. Arhin FF, Draghi DC, Pillar CM, Parr TR, Jr, Moeck G, Sahm DF. 2009. Comparative in vitro activity profile of oritavancin against recent gram-positive clinical isolates. Antimicrob. Agents Chemother. 53:4762–4771 [DOI] [PMC free article] [PubMed] [Google Scholar]
- 4. Rubino CM, Van Wart SA, Bhavnani SM, Ambrose PG, McCollam JS, Forrest A. 2009. Oritavancin population pharmacokinetics in healthy subjects and patients with complicated skin and skin structure infections or bacteremia. Antimicrob. Agents Chemother. 53:4422–4428 [DOI] [PMC free article] [PubMed] [Google Scholar]
- 5. Bhavnani SM, Owen JS, Loutit JS, Porter SB, Ambrose PG. 2004. Pharmacokinetics, safety, and tolerability of ascending single intravenous doses of oritavancin administered to healthy human subjects. Diagn. Microbiol. Infect. Dis. 50:95–102 [DOI] [PubMed] [Google Scholar]
- 6. Ambrose PG, Drusano GL, Craig WA. 2012. In vivo activity of oritavancin in animal infection models and rationale for a new dosing regimen in humans. Clin. Infect. Dis. 54(Suppl 3):S220–S228 [DOI] [PubMed] [Google Scholar]
- 7. Lehoux D, Laquerre K, Ostiguy V, Fadhil I, Malouin M, Cadieux C, Fournier S, Arhin FF, Sarmiento I, Moeck G, Parr TR., Jr 2009. Comparative efficacy of oritavancin (ORI) against methicillin-sensitive and -resistant Staphylococcus aureus strains in a neutropenic-mouse thigh infection model, abstr B-1324. Abstr. 49th Intersci. Conf. Antimicrob. Agents Chemother., 12 to 15 September 2009 [Google Scholar]
- 8. Dunbar LM, Milata J, McClure T, Wasilewski MM. 2011. Comparison of the efficacy and safety of oritavancin front-loaded dosing regimens to daily dosing: an analysis of the SIMPLIFI trial. Antimicrob. Agents Chemother. 55:3476–3484 [DOI] [PMC free article] [PubMed] [Google Scholar]
- 9. MacGowan A, Bowker K. 2002. Developments in PK/PD: optimising efficacy and prevention of resistance. A critical review of PK/PD in in vitro models. Int. J. Antimicrob. Agents 19:291–298 [DOI] [PubMed] [Google Scholar]
- 10. Booker BM, Smith PF, Forrest A, Bullock J, Kelchlin P, Bhavnani SM, Jones RN, Ambrose PG. 2005. Application of an in vitro infection model and simulation for reevaluation of fluoroquinolone breakpoints for Salmonella enterica serotype typhi. Antimicrob. Agents Chemother. 49:1775–1781 [DOI] [PMC free article] [PubMed] [Google Scholar]
- 11. Aeschlimann JR, Allen GP, Hershberger E, Rybak MJ. 2000. Activities of LY333328 and vancomycin administered alone or in combination with gentamicin against three strains of vancomycin-intermediate Staphylococcus aureus in an in vitro pharmacodynamic infection model. Antimicrob. Agents Chemother. 44:2991–2998 [DOI] [PMC free article] [PubMed] [Google Scholar]
- 12. Mendes RE, Farrell DJ, Sader HS, Jones RN. 2012. Oritavancin microbiologic features and activity results from the surveillance program in the United States. Clin. Infect. Dis. 54(Suppl 3):S203–S213 [DOI] [PubMed] [Google Scholar]
- 13. Arhin FF, Belley A, McKay G, Beaulieu S, Sarmiento I, Parr TR, Jr, Moeck G. 2010. Assessment of oritavancin serum protein binding across species. Antimicrob. Agents Chemother. 54:3481–3483 [DOI] [PMC free article] [PubMed] [Google Scholar]
- 14. Belley A, Arhin FF, Sarmiento I, Deng H, Rose WE, Moeck G. 2011. Comparison of a single dose of oritavancin (ORI) to daily dosing regimens of daptomycin (DAP) or vancomycin (VAN) against methicillin-resistant Staphylococcus aureus (MRSA) in an in vitro pharmacokinetic (PK)/pharmacodynamic (PD) model (IVPM), abstr A2-021. Abstr. 51st Intersci. Conf. Antimicrob. Agents Chemother., Chicago, IL, 17 to 20 September 2011 [Google Scholar]
- 15. Arhin FF, Sarmiento I, Parr TR, Jr, Moeck G. 2010. Assessment of glycopeptide heteroresistance in Staphylococcus aureus by broth macrodilution assay, abstr F1-1974. Abstr. 50th Intersci. Conf. Antimicrob. Agents Chemother., Boston, MA, 12 to 15 September 2010 [Google Scholar]
- 16. CLSI 2009. Methods for dilution antimicrobial susceptibility tests for bacteria that grow aerobically. Approved standard, CLSI document M7-A8, 8th ed CLSI, Wayne, PA [Google Scholar]
- 17. Arhin FF, Sarmiento I, Belley A, McKay GA, Draghi DC, Grover P, Sahm DF, Parr TR, Jr, Moeck G. 2008. Effect of polysorbate 80 on oritavancin binding to plastic surfaces: implications for susceptibility testing. Antimicrob. Agents Chemother. 52:1597–1603 [DOI] [PMC free article] [PubMed] [Google Scholar]
- 18. MacGowan AP, Noel AR, Tomaselli S, Elliott HC, Bowker KE. 2011. Pharmacodynamics of telavancin studied in an in vitro pharmacokinetic model of infection. Antimicrob. Agents Chemother. 55:867–873 [DOI] [PMC free article] [PubMed] [Google Scholar]
- 19. NCCLS 1999. Methods for determining bactericidal activity of antimicrobial agents; approved guideline. NCCLS document M26-A. NCCLS, Wayne, PA [Google Scholar]
- 20. Firsov AA, Smirnova MV, Lubenko IY, Vostrov SN, Portnoy YA, Zinner SH. 2006. Testing the mutant selection window hypothesis with Staphylococcus aureus exposed to daptomycin and vancomycin in an in vitro dynamic model. J. Antimicrob. Chemother. 58:1185–1192 [DOI] [PubMed] [Google Scholar]
- 21. Mouton JW, Ambrose PG, Canton R, Drusano GL, Harbarth S, MacGowan A, Theuretzbacher U, Turnidge J. 2011. Conserving antibiotics for the future: new ways to use old and new drugs from a pharmacokinetic and pharmacodynamic perspective. Drug Resist. Updat. 14:107–117 [DOI] [PubMed] [Google Scholar]
- 22. Rose WE, Knier RM, Hutson PR. 2010. Pharmacodynamic effect of clinical vancomycin exposures on cell wall thickness in heterogeneous vancomycin-intermediate Staphylococcus aureus. J. Antimicrob. Chemother. 65:2149–2154 [DOI] [PubMed] [Google Scholar]
- 23. Rose WE, Rybak MJ, Tsuji BT, Kaatz GW, Sakoulas G. 2007. Correlation of vancomycin and daptomycin susceptibility in Staphylococcus aureus in reference to accessory gene regulator (agr) polymorphism and function. J. Antimicrob. Chemother. 59:1190–1193 [DOI] [PubMed] [Google Scholar]
- 24. Vidaillac C, Leonard SN, Rybak MJ. 2009. In vitro activity of ceftaroline against methicillin-resistant Staphylococcus aureus and heterogeneous vancomycin-intermediate S. aureus in a hollow fiber model. Antimicrob. Agents Chemother. 53:4712–4717 [DOI] [PMC free article] [PubMed] [Google Scholar]
- 25. Camargo IL, Neoh HM, Cui L, Hiramatsu K. 2008. Serial daptomycin selection generates daptomycin-nonsusceptible Staphylococcus aureus strains with a heterogeneous vancomycin-intermediate phenotype. Antimicrob. Agents Chemother. 52:4289–4299 [DOI] [PMC free article] [PubMed] [Google Scholar]
- 26. Mishra NN, Yang SJ, Sawa A, Rubio A, Nast CC, Yeaman MR, Bayer AS. 2009. Analysis of cell membrane characteristics of in vitro-selected daptomycin-resistant strains of methicillin-resistant Staphylococcus aureus. Antimicrob. Agents Chemother. 53:2312–2318 [DOI] [PMC free article] [PubMed] [Google Scholar]
- 27. Patel D, Husain M, Vidaillac C, Steed ME, Rybak MJ, Seo SM, Kaatz GW. 2011. Mechanisms of in-vitro-selected daptomycin-non-susceptibility in Staphylococcus aureus. Int. J. Antimicrob. Agents 38:442–446 [DOI] [PubMed] [Google Scholar]
- 28. Saravolatz LD, Pawlak J, Johnson LB. 2010. In vitro activity of oritavancin against community-associated methicillin-resistant Staphylococcus aureus (CA-MRSA), vancomycin-intermediate S. aureus (VISA), vancomycin-resistant S. aureus (VRSA) and daptomycin-non-susceptible S. aureus (DNSSA). Int. J. Antimicrob. Agents 36:69–72 [DOI] [PubMed] [Google Scholar]
- 29. Vidaillac C, Parra-Ruiz J, Rybak MJ. 2011. In vitro time-kill analysis of oritavancin against clinical isolates of methicillin-resistant Staphylococcus aureus with reduced susceptibility to daptomycin. Diagn. Microbiol. Infect. Dis. 71:470–473 [DOI] [PubMed] [Google Scholar]
- 30. Silverman JA, Perlmutter NG, Shapiro HM. 2003. Correlation of daptomycin bactericidal activity and membrane depolarization in Staphylococcus aureus. Antimicrob. Agents Chemother. 47:2538–2544 [DOI] [PMC free article] [PubMed] [Google Scholar]
- 31. Zhanel GG, Schweizer F, Karlowsky JA. 2012. Oritavancin: mechanism of action. Clin. Infect. Dis. 54(Suppl 3):S214–S219 [DOI] [PubMed] [Google Scholar]
- 32. Belley A, Neesham-Grenon E, McKay G, Arhin FF, Harris R, Beveridge T, Parr TR, Jr, Moeck G. 2009. Oritavancin kills stationary-phase and biofilm Staphylococcus aureus cells in vitro. Antimicrob. Agents Chemother. 53:918–925 [DOI] [PMC free article] [PubMed] [Google Scholar]
- 33. Boylan CJ, Campanale K, Iversen PW, Phillips DL, Zeckel ML, Parr TR., Jr 2003. Pharmacodynamics of oritavancin (LY333328) in a neutropenic-mouse thigh model of Staphylococcus aureus infection. Antimicrob. Agents Chemother. 47:1700–1706 [DOI] [PMC free article] [PubMed] [Google Scholar]
- 34. Lehoux D, Okusanya OO, Ostiguy V, Forrest A, Laquerre K, Bhavnani SM, Fadhil I, Malouin M, Arhin FF, Sarmiento I, Belanger O, Rafai Far A, Moeck G, Parr TR, Jr, Ambrose PG. 2007. PK-PD of oritavancin against S. pneumoniae in a murine-pneumonia infection model, abstr A-49. Abstr. 47th Intersci. Conf. Antimicrob. Agents Chemother., Chicago, IL, 17 to 20 September 2007 [Google Scholar]
- 35. Okusanya OO, Lehoux D, Van Wart SA, Rafai Far A, Forrest A, Moeck G, Bhavnani SM, Parr TR, Jr, Ambrose PG. 2009. Pharmacokinetics and pharmacokinetics-pharmacodynamics of oritavancin against Staphylococcus aureus using data from a neutropenic murine thigh-infection model, abstr A1-1287. Abstr. 49th Intersci. Conf. Antimicrob. Agents Chemother., San Francisco, CA, 12 to 15 September 2009 [Google Scholar]
- 36. MacGowan AP, Reynolds R, Noel AR, Bowker KE. 2009. Bacterial strain-to-strain variation in pharmacodynamic index magnitude, a hitherto unconsidered factor in establishing antibiotic clinical breakpoints. Antimicrob. Agents Chemother. 53:5181–5184 [DOI] [PMC free article] [PubMed] [Google Scholar]
- 37. Finberg RW, Moellering RC, Tally FP, Craig WA, Pankey GA, Dellinger EP, West MA, Joshi M, Linden PK, Rolston KV, Rotschafer JC, Rybak MJ. 2004. The importance of bactericidal drugs: future directions in infectious disease. Clin. Infect. Dis. 39:1314–1320 [DOI] [PubMed] [Google Scholar]