

Abstract
Objective. This paper assessed the effectiveness of pre-, pro-, and synbiotics on reducing two protein-bound uremic toxins, p-cresyl sulphate (PCS) and indoxyl sulphate (IS). Methods. English language studies reporting serum, urinary, or fecal PCS and/or IS (or their precursors) following pre-, pro-, or synbiotic interventions (>1 day) in human adults were included. Population estimates of differences in the outcomes between the pre- and the postintervention were estimated for subgroups of studies using four meta-analyses. Quality was determined using the GRADE approach. Results. 19 studies met the inclusion criteria, 14 in healthy adults and five in haemodialysis patients. Eight studies investigated prebiotics, six probiotics, one synbiotics, one both pre- and probiotics, and three studies trialled all three interventions. The quality of the studies ranged from moderate to very low. 12 studies were included in the meta-analyses with all four meta-analyses reporting statistically significant reductions in IS and PCS with pre- and probiotic therapy. Conclusion. There is a limited but supportive evidence for the effectiveness of pre- and probiotics on reducing PCS and IS in the chronic kidney disease population. Further studies are needed to provide more definitive findings before routine clinical use can be recommended.
1. Introduction
Chronic kidney disease (CKD) coupled with cardiovascular disease (CVD) is emerging as a major public health problem. CKD has become one of the most common chronic conditions attributable to the burden of disease worldwide [1]. Moreover, CVD is highly prevalent in CKD, such that CKD patients are far more likely to experience cardiovascular (CV) mortality than progression to end-stage renal failure [2]. Treatment to reduce both CKD progression and CV mortality is urgently required. This paper investigates a potential therapeutic strategy targeting the gut with a low cost, innovative nutrition-based treatment of pre- and probiotics.
Recent studies suggest that two protein-bound toxins implicated in the uremic syndrome, p-cresyl sulphate (PCS) and indoxyl sulphate (IS), may be risk factors for the high CV mortality rates observed in the CKD population [3–6]. Both PCS and IS originate exclusively from dietary amino acid bacterial fermentation in the large intestine [7]. CKD enhances the protein fermentation process through a number of mechanisms including inefficient protein assimilation in the small intestine resulting in more protein entering the large intestine, prolonged colonic transit time, and increased luminal pH secondary to increased colonic urea diffusion, all of which contribute to the alteration of the bacterial composition of the microbiota (colonic microenvironment) specific to this population [8, 9]. This increase in PCS and IS toxin production in CKD patients, coupled with inadequate renal clearance, results in high serums levels, which are inversely correlated with glomerular filtration rate [10].
Lowering the production of these uremic toxins by manipulating bacterial composition of the microbiota and/or colonic transit time therefore represents a promising therapeutic strategy. Pre- and probiotics may be able to facilitate such a change in the colonic environment by enhancing the ratio of available carbohydrates to nitrogen, increasing short-chain fatty acid production, decreasing colonic pH, increasing colonic transit time, and repressing the enzymes which catalyse the reactions producing PCS and IS. Therefore, in theory, this treatment offers compelling therapeutic appeal.
The objective of this paper is to assess the effectiveness of pre-, pro-, and synbiotics on reducing PCS and IS production. A secondary aim is to identify the most effective intervention, including probiotic strain/prebiotic variety, dosage, and duration, as well as to highlight the gaps in the literature to guide future studies in this area.
2. Methods
An extensive review of the literature from 1951 to 2011 (inclusive) was conducted using Cochrane, PubMed, Embase, and CINAHL. A combination of the following Medical Subject Heading search terms were used: Prebiotics, Probiotics, Synbiotics, Oligosaccharides/therapeutic, Fructans/therapeutic use, Bacteria/therapeutic use and Kidney Diseases, Indican, Cresols, Tyrosine/metabolism, Tryptophan/metabolism. In addition, manual searches were performed to identify studies and literature reviews from the bibliographies of relevant published articles. A search limited to English language studies of human adults, that had implemented a pre-, pro-, or synbiotic intervention for longer than one day resulted in 237 articles (including 10 studies identified from the manual search). After applying the exclusion criteria (review articles, studies which did not report PCS and/or IS (or their precursors), use of nonvalidated prebiotics as defined by Gibson et al. [11], and studies using high doses of prebiotics for purgation (i.e., lactulose)), only 19 remained. Figure 1 indicates a flow diagram of the methodology.
Figure 1.
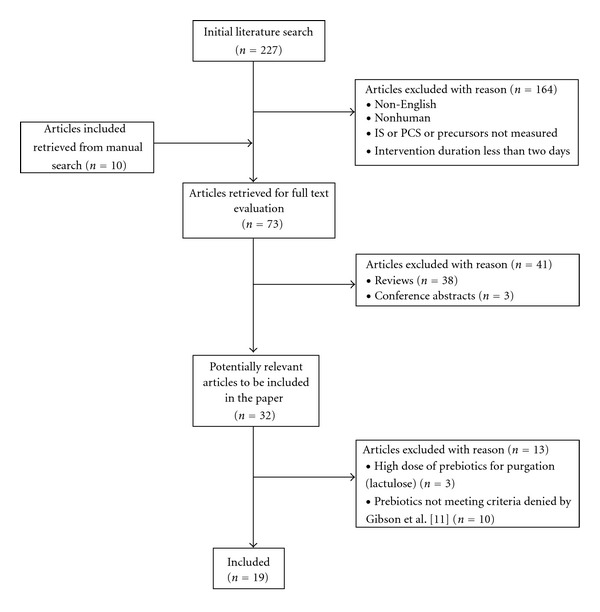
Search methodology for the PCS and IS literature review.
Studies were classified using the study design definitions from the National Health and Medical Research Council [12]. The Grades of Recommendation, Assessment, Development, and Evaluation (GRADE) approach for grading the evidence was applied [13].
The unit of measurement for PCS and IS was converted to milligrams (mg)/litre (L) (serum), mg/day (urine), or mg/gram (g) (fecal) where possible using molecular weights from the Human Metabolome Database [14]. P-cresol (PC), an artefact of PCS induced by hydrolysis in the analytical process, is used interchangeably with PCS in this paper [15]. Also, indole is the precursor for IS prior to hydroxylation and sulphation in the body. Therefore, fecal indole is a surrogate marker of urinary and serum IS.
Attempts were made to contact corresponding authors for information that was not published, including probiotic form (i.e., powder or capsule) and strain, analysis information, missing numerical values of outcome measures, and information on dietary protocol.
2.1. Statistical Analysis
The summary statistics reported from the relevant studies were translated into means and standard deviations (SD), assuming normal distribution. SDs were obtained via simulation for those studies which reported median and interquartile range.
The meta-analysis was performed to estimate the true population treatment effect and to find factors significantly associated with the outcome variable, which was the mean change in serum IS/urinary PCS before/after treatment. The meta-analysis was limited by the number of studies that could be included given the inconsistencies in the outcome measures reported, that is, serum, urine, and fecal. Four meta-analyses were undertaken. The first analysis looked at serum IS as an outcome from pre-, pro-, and synbiotic interventions in the HD population. The other three meta-analyses were in the healthy population investigating urinary PCS as the outcome. One of the three from the healthy population included only prebiotic interventions, another solely probiotics, and the final a combination of all three: pre-, pro-, and synbitoic interventions.
Fixed- and random-effects meta-analyses were performed where the random-effects model was fitted with restricted maximum-likelihood estimators for the amount of heterogeneity. The best model fit was selected using the likelihood ratio test. Potential publication bias was investigated using funnel plots. The significance of between-trial heterogeneity was also tested. Sensitivity analyses were undertaken to determine any possible effects relating to the assumed correlation between pre- and post- IS/PCS measures to the estimated true population treatment effect.
Possible associations of treatment dose and types of pre- and probiotics with the outcomes were investigated using multivariable metaregression. Akaike and Bayesian information criteria were used to determine whether the models with the covariates fitted the data significantly better. R program (version 2.14.0) [16] with metaphor library [17] was used to perform the meta-analysis and meta regression.
3. Results
3.1. Literature Review
The 19 eligible studies consisted of 14 studies in the healthy population [18–31] and five studies in patients with kidney disease [32–36], all of whom were undergoing haemodialysis (HD) for end-stage kidney disease (ESKD). Seven studies conducted in the healthy and one from the HD population investigated prebiotics (Table 1); [18–24, 32] six trialled probiotics, three in the healthy [25–27] and the others in the HD population [33–35] (Table 2); one looked at both pre- and probiotics separately, [29] one studied synbiotics alone [36], and three studies investigated the effects of all three types of interventions (Table 3) [28, 30, 31].
Table 1.
Published studies on the effectiveness of prebiotics on reducing indoxyl sulphate and p-cresyl sulphate.
| Author (year) |
Study design |
Patients | Supplement total dose/day (CFU or g) number of doses/day | Duration | Analysis method |
Main results (preintervention and postintervention (mean difference (SD))) | Comments | Grade benefit |
|---|---|---|---|---|---|---|---|---|
| Cloetens et al., (2010) [18] |
Randomised-placebo-controlled crossover trial | n = 20 healthy (6 male) | Prebiotic: AXOS degree of polymerization = 6 10 g administered in orange juice Placebo: maltodextrin 10 g 2 dose/day |
3 wks in each arm |
Heat and acid deproteinisation, GC, MS |
Δ Urinary PC (mg/24 h)
∧
(within group, 0–2 wks) Tx grp: 32.1–14.9 (−17.2 ) (0.011) Placebo: 32.9–27.3 (−5.6 ) (ns) (within group, 0–3 wks) Tx grp: 32.1–27.2 (−4.9) (ns) Placebo: 28.2–25.2 (−3.0) (ns) |
(i) 4-week washout period between each arm (ii) Analysis 0–2 weeks n = 10 only in both groups (iii) Analysis at week 3 was taken the day after prebiotic was ceased (iv) Increased bifidobacterium levels at 2 weeks, P = 0.025; compared to placebo, this was lost at week 3 (v) Correlation pre- and postintervention bifidobacterium levels r = −0.51 P = 0.022 (vi) Usual diet, asked to have a regular eating pattern (3 meals/day), and foods containing prebiotics were limited to 1/week |
Moderate PC + (0–2 wks) |
|
| ||||||||
| De Preter et al., (2008)[19] |
Case series (2 independent studies—S1 and S2) |
n = 48 healthy S1, n = 29 (14 male) S2,n = 19 (9 male) |
S1: lactulose 20 g S2: OF-IN (Orafti Synergy1) (i) Oligofructose degree of polymerization = 4, 10 g (ii) Raftiline HP degree of polymerization = 25, β(2,1) linkage, 10 g 2 dose/day |
0–4 wks | Heat and acid deproteinisation, GCMS | Δ Urinary PC (mg/24 h)(wk 0–4) S1: 20.7–12.7 (−8) (0.001) S2: 27.7–17.8 (−9.9) (0.005) |
(i) Both studies increased in bifidobacterium levels S1: P = 0.017, S2: P < 0.001, and no difference between studies (ii) Correlation between baseline PC levels and effect of prebiotic intervention (r = −0.64) (S1), r = −0.74 (S2) P < 0.001) (iii) No runout period (iv) Usual diet, advised to keep stable. Avoid fermented milk products and foods containing fermentable carbohydrates |
Low PC + |
|
| ||||||||
| Ito et al., (1993a) [20] |
Case series | n = 12 healthy (all male) | TD (including GOS) 15 g administered in iced tea 1 dose/day |
0–6 days | Heat and acid deproteinisation GC, FID | Δ Fecal (ug/g wet wt)(day 0–6) PC 9.8–3.3 (−6.5) (<0.05) Indole 10.5–7.4 (−3) (<0.01) |
(i) Post was measured on the 6th day of ingestion (ii) Increased bifidobacterium levels and lactobacillus P < 0.01 and P < 0.05, respectively. Decrease in bacteroidaceae P < 0.05 (iii) 6 day runout levels PC, indole returned towards baseline (iv) Usual diet with no lactose containing foods or fermentation products |
Low PC+ IS+ |
|
| ||||||||
| Ito et al., (1993b) [21] |
Case series | n = 12 healthy (all male) | GOS (Oligomate 50) 2.5 g administrated in apple juice which included 1 dose/day |
0–3 wks | Heat and acid deproteinisation GC, FID |
Δ Fecal (mg/L)
(wk 0–3) Indole 50.4–31.6 (−18.8) (<0.05) PC 48.7–41.1 (−7.6) (ns) |
(i) Post was measured on 6th day of week 3 (ii) Participants were selected out of a group of 28 on the basis of the lowest bifidobacterium levels (iii) Increased bifidobacterium levels P < 0.05 (iv) 6 day runout levels indole decreased further 23.4 mg/L (v) Usual diet with no lactose containing foods or fermentation products |
Low IS+ PC− |
|
| ||||||||
| Terada et al., (1992) [22] |
Case series | n = 8 healthy (n = 5 male) | Lactulose 3 g administered in a drink 1 dose/day |
0–2 wks | Heat and acid deproteinisation GC, FID | Δ Fecal (mg/d)
(wk 0-1) Indole 6.3–2.4 (−3.9) (<0.05) PC (not reported) (wk 0–2) Indole 6.3–0.9 (−5.4) (<0.05) PC (not reported) (ns) |
(i) Increased bifidobacterium levels and lactobacillus P < 0.001 and P < 0.05, respectively. Decrease in bacteroidaceae P < 0.05 (ii) Usual diet. Avoided food with abundant viable cultures (iii) 1 week runout period levels returned to preintervention levels* |
Low IS+ PC− |
|
| ||||||||
| Geboes et al., (2006) [23] |
Case series | n = 7 healthy (n = 2 male) | Inulin degree of polymerization = 12, β(2,1) linkage 15 g 3 dose/day |
0–4 wks | Heat and acid deproteinisation, GCMS | Δ Urinary PC (mg/24 hr)
∧
(wk 0–4) Total: 32.3–22.3 (−10) (ns) Percentage of isotope ([2H4]p-cresol): 0.81–0.51 (−0.3 ) (ns) |
(i) Low overall recovery of the label (ii) 1 week runout urinary PC and urinary percentage of isotope increased towards baseline. Fecal PC exceeded baseline, 13.33 mg/72 hrs, and fecal percentage of isotope decreased further to 0.44% |
Very low PC− |
| Outcome markers-total PC and stable isotopes [2]p-cresol given as [2]tyrosine in test meal | Δ Fecal PC (mg/72 hr)
∧
(wk 0–4) Total: 9.7–9.3 (−0.4) (ns) Percentage of isotope ([2H4]p-cresol): 0.78–0.71 (−0.07) (ns) |
(iii) Usual diet, advised to keep constant macronutrient composition. Diet records kept at intervals throughout the study to allow for qualitative comparison—results not reported | ||||||
|
| ||||||||
| Alles et al., (1999) [24] |
Placebo controlled nonrandomised experimental trial |
n = 39 healthy High dose = 14 (8 male) Low dose = 13 (7 male) |
TOS degree of polymerization = 2, Elix' or high dose group = 15 g |
0–3 wk standardise run in diet | Freeze-thaw deproteinisation, HPLC, UV |
Δ Fecal indole (ug/g wet wt) (mean difference (95% CI)) (between placebo and intervention wk 3–7) | (i) Intervention and placebo increased in bifidobacterium levels. |
Low |
| Placebo = 12 (7 male) |
Low dose group = 7.5 g Administered in juice |
3–7 wk intervention | High dose group: −3.0 (−11,6) (ns) | (ii) No run-out period |
||||
| 3 dose/day | Low dose group: −5.0 (−11,6) (ns) | (iii) 90% of food was provided according to a dietitian prescribed standardized low-fibre high-protein diet | IS− | |||||
|
| ||||||||
| Meijers et al., (2009) [32] |
Case series | n = 22 hemodialysis (15 male) | OF-IN (Orafti Synergy1) total 20 g | 0–4 wks | Sodium octanoate, HPLC, FS |
Δ Serum (mg/L) ∧ | (i) Commenced 1/2 dose: 1/day first wk, increase to full by week 2 | Very Low |
| (i) Oligofructose degree of polymerization = 4, 10 g | wk 0–4 | |||||||
| (ii) Raftiline HP degree of polymerization = 12, β (2,1) linkage, 10 g | PCS 38.5–32.0 (−6.5) (0.01) | (ii) PCS levels remained significantly different 4 weeks post | PC+ | |||||
| 2 dose/day | IS 23.7–22.4 (−1.3) (ns) | (iii) No monitoring of diet | IS– | |||||
Table 2.
Published studies on the effectiveness of probiotics on reducing indoxyl sulphate and p-cresyl sulphate.
| Author (year) |
Study design |
Patients | Supplement total dose/day (CFU or g) number of doses/day | Duration | Analysis method | Main results (preintervention and postintervention (mean difference)) | Comments | Grade benefit |
|---|---|---|---|---|---|---|---|---|
| Ling et al., (1994) [25] |
n = 33 healthy female | Lactobacillus rhamnosus GG 1 × 10¹¹ administered in yogurt | 0–4 wks | Heat and acid deproteinisation, HPLC, FS | ΔUrinary PC mg/24 hr | (i) Subgroup from a larger study | Moderate | |
| Placebo-controlled non-randomised experimental trial | n = 22 treatment | (within group, wk 0–4) | (ii) 2 week runout period levels increased towards baseline levels 41.5 mg/24 hr | |||||
| n = 11 placebo | 1 dose/day | Tx grp: 45.0–35.5 (−9.5) (<0.05) | (iii) Both groups were also given 9 g fibre from aleuronic layer of whole-grain rye daily | PC+ | ||||
| Placebo: 46.5–43.1 (−3.4) (ns) | (iv) 3 day food records were analysed for macro nutrients and fibre questionnaire for total fibre intake. No significant difference between groups was reported | |||||||
|
| ||||||||
| Tohyama et al., (1981) [26] |
n = 7 healthy (all male) |
Lactobacillus casei 90241 1 × 10¹⁰ administered in milk |
0–3 wk control 4–9 wk intervention |
Heat and acid deproteinisation, GC, FID | ΔUrinary (percentage of reduction (±SD)) | (i) Urine was analysed at different times of the day between baseline and post | Very Low | |
| Interrupted time series without a parallel control group | (within group, wk 4–9) | (ii) Included rat study which showed significant reductions also | ||||||
| PC − 42.6 (±33.7) (<0.05) | (iii) Strong correlation between fecal tryptophanase activity and urinary IS (r = 0.93) | |||||||
| 1 dose/day | IS − 29.3 (±15.9) (<0.05) | (iv) 2 week run-out period concentrations returned to initial levels post feeding—data not shown | PC+ | |||||
| (v) No dietary restrictions | IS+ | |||||||
|
| ||||||||
| Fujiwara et al., (2001) [27] |
Case series | n = 8 healthy |
Lactobacillus gasseri SBT2055SR-lyophilized 1 × 10¹¹ administrated in milk 1 dose/day |
0-1 wk | Deprotinisation method was not disclosed, HPLC, UV-VIS | ΔFecal mg/g
(wk 0-1) PC 0.064–0.022* (− 0.045) (0.01) Indole (not reported) (ns) |
(i) Subgroup of another study (ii) Decreased staphylococcus P < 0.05 (iii) By 5 day run-out PC levels returned to baseline* (iv) Usual diet with restriction on fermented milk, pickles, and natto |
Low PC+ IS− |
|
| ||||||||
| Takayama et al., (2003) [33] |
Nonrandomised-placebo controlled experimental trial | n = 22 hemodialysis (n = 14 male) | Probiotic: Bifidobacterium longum strain JCM008 administered in gastroresistant capsules 3 × 10⁹ | 0–5 wks | Deproteinization (not disclosed) Reverse-phase HPLC, FS |
ΔSerum IS (mg/L)
(within group, wk 0−5) |
(i) Placebo has different dose and strain | Low |
| n = 11 treatment | Placebo: Bifidobacterium (powder form) 2 × 10⁷ | Tx group: 49.0–35.0 (−14.0) (<0.005) | (ii) 2 week runout period levels increased towards baseline levels 44 mg/L | IS+ | ||||
| n = 11 placebo | Dose/day not disclosed | Placebo: 48.0–52.0 (+4.0) (ns) | (iii) No monitoring of diet | |||||
|
| ||||||||
| Taki et al., (2005) [34] |
n = 27 hemodialysis (n = 14 male) | Bifidobacterium longum | 0–12 wks | Not disclosed | ΔSerum IS (mg/L) | (i) Strain not disclosed | Very low | |
| 0–4 wks: 3 × 10⁹ | (wk 0–4) 35.1–31.0 (−4.1) (<0.01) |
(ii) Analysis methods not described | ||||||
| Case series | 4–8 wks: 6 × 10⁹
8–12 wk: 12 × 109 |
(wk 0–8) 35.1–31.7 (−3.4) (<0.05) |
(iii) No dose response effect | |||||
| Administered in gastroresistant capsule | (wk 0–12) 35.1–31.9 (−3.2) (<0.05) |
(iv) No runout period | ||||||
| Dose/day not disclosed | (v) Monitoring of diet (not disclosed) | IS+ | ||||||
|
| ||||||||
| Hida et al., (1996) [35] | n = 20 hemodialysis (n = 8 male) | Bifidobacterium infantis, Lactobacillus acidophilus, Enterococcus faecalis 2 × 10⁸ of each strain administered in a capsule | 0–4 wks | Plasma: reverse-Phase HPLC, UV detection | ΔPlasma (mg/L)
(wk 0–4) |
(i) Strain not disclosed | Very low | |
| Case series | Fecal: steam distilled, GC, FID | IS 45.2–31.1 (−14.1) (<0.01) | (ii) Fecal analysis included 10 patients only from 0–2 week | IS+ | ||||
| PC 17.8–18.3*(+0.5) (ns) | (iii) Decreased enterobacteria P < 0.05 | PC+ (fecal) | ||||||
| 2 dose/day | ΔFecal (mg/g) (wk 0–4) PC 102.0–70.0* (−32.0 ) (<0.01) |
(iv) No runout period | PC− (serum) | |||||
| Indole 45.0–32.0* (−13.0) (<0.05) | (v) No monitoring of diet | |||||||
Table 3.
Published studies with more than one intervention (Pre-, Pro- and/or Synbiotics) on reducing indoxyl sulphate and p-cresyl sulphate.
| Author (year) | Intervention | Study design | Patients | Supplement total dose/day (CFU or g) number of doses/day | Duration | Analysis method |
Main results (preintervention and post intervention (mean difference)) | Comments | Grade benefit |
|---|---|---|---|---|---|---|---|---|---|
| De Preter et al., (2006) [28] |
Prebiotic Probiotic Synbiotic (Group3) |
Randomised placebo controlled cross over trial |
n = 43 healthy (n = 21 male) Group 1 : 14 Group 2 : 14 Group 3 : 15 |
Probiotic: lyophilized Saccharomyces boulardii A07FA02 (yeast) administered via capsules Group1 = 2–5 × 10⁹ Group2 = 4–10 × 109 Group3 = 2–5 × 10⁹ Prebiotic: lactulose Group1 = 20 g Group2 = 30 g Group3 = 20 g Placebo: maltodextrin 2 dose/day |
4 wk in each arm Probiotic Prebiotic Placebo (Group 1 and 2) Synbiotic (Group3) |
Heat and acid deproteinisation, GC, MS |
Urinary PC (mg/24 hr) (between placebo and intervention at 4 wk) Prebiotic arm Group1: 17.9, 9.5 (−8.4) (0.022) Group2: 21.9, 14.7 (−7.2) (0.022) Probiotic arm Group1: 17.9, 21.0 (+3.1) (ns) Group2: 21.9, 18.4 (−3.5) (ns) ΔUrinary PC (mg/24 hr)(within group, 0–4 wks) Prebiotic arm Group1: 17.7–9.5 (−8.2) (0.019) Group2: 20.1–14.7 (−5.4) (0.002) Group3: 20.2–16.2 (−4.0) (0.002) Probiotic arm Group1: 17.7–21.0 (+3.3) (ns) Group2: 20.1–18.4 (−1.7) (ns) Group3: 20.2-20.2 (0.0) (ns) Synbiotic arm Group3: 20.2–18.9 (−1.3) (ns) |
(i) Variability of probiotic dose per capsule (1–2.5 × 10⁹) (ii) Δ Fecal concentration was also assess; however, no trend was evident among the three groups (iii) 4 week run-out period levels returned towards baseline becoming statistically significant compared to week 4 (iv) Usual diet, advised to keep stable. Avoid intake of fermented milk products and food components containing high quantities of fermentable carbohydrates |
Moderate PC+ (prebiotic) PC– (probiotic) |
|
| |||||||||
| De Preter et al., (2004) [29] |
Probiotic Prebiotic |
Randomised placebo controlled cross over trial (2 independent studies: probiotic and prebiotic) |
n = 19 healthy Probiotic, n = 10 Prebiotic, n = 9 |
Probiotic: Lactobacillus casei Shirota 13 × 109 administered in milk product Placebo: milk product without strain Prebiotic: lactulose 20 g Placebo: lactose |
2 wks in each arm Probiotic Prebiotic Placebo |
Heat and acid deproteinisation, GC, MS Outcome markers-total PC and stable isotopes [2H4]p-cresol given as [2H4]tyrosine in test meal |
ΔUrinary PC (mg 0–24 hr) (difference in intervention Group, difference in placebo (mean difference) 0–2 wk) Probiotic study Total: 6.6, 8.4 (−1.8) (ns) Percentage of isotope: 0.10, 0.25 (−0.15) (ns) Prebiotic study Total: −11.2, 8.3 (−19.5) (0.018) |
(i) Theory-based explanation of different phases of total urinary PC, that is, 0–24 hr and 24–48 hr; no other paper measures PC in this way (ii) Low overall recovery of the label (iii) 2-week washout period in between each arm (iv) Usual diet, advised to keep stable. Avoid intake of fermented milk products and food |
Moderate PC+ |
| Percentage of isotope: −0.87, 0.05 (−0.92) (0.005) | components containing high quantities of fermentable carbohydrates | ||||||||
| 2 dose/day | ΔUrinary PC (mg 24–48 hr) (difference in intervention group, difference in placebo (mean difference) 0–2 wk) Probiotic study Total: −16.2, 8.3 (−24.5) (0.009) Percentage of isotope: −0.70, 0.46 (−1.16) (0.042) Prebiotic study Total: 8.9, 6.6 (+2.3) (ns) Percentage of isotope: −0.72, −0.10 (+0.28) (ns) |
||||||||
|
| |||||||||
| De Preter et al., (2007) [30] |
Prebiotic Probiotic Synbiotic |
Randomized placebo-controlled crossover trial |
n = 19 healthy (n = 10 male) Group 1 : 10 Group 2 : 9 |
Probiotic: Group 1—lyophilized Bifidobacterium breve Yakult 2 × 10⁹ Group 2—Lactobacillus casei Shirota 13 × 109 administrated in milk product Prebiotic: Group 1 and 2—OF-IN (Orafti Synergy1) total 20 g (i) Oligofructose degree of polymerization = 4, 10 g (ii) Raftiline HP degree of polymerization = 12, β (2, 1) linkage, 10 g Placebo: strain free milk product (probiotic)/ Maltodextrine (prebiotic) |
Each Group 4 weeks in each arm Probiotic Prebiotic Placebo Synbiotic (Group 2 only) 0–4 wks |
Heat and acid deproteinisation, GC, MS | ΔUrinary PC (mg/24 h)
∧
(within group, 0–4 wks) Probiotic: Group 1: 21.2−16.7 (−4.5) (0.005) Group 2: 24.4–20.5 (−3.9) (0.038) Prebiotic Short-term effect (start of study) Group 1: 21.2–15.7 (−5.5) (0.013) Group 2: 24.4–14.7 (−9.7) (0.025) Long-term effect (end of study, wk4) Group 1: 21.2−21.3 (+0.2) (ns) Group 2: 24.4–13.4 (−11.0) (0.025) Group 1 + 2: (0.005) Synbiotic: Group 2: 24.4–9.8 (−14.6) (0.021) |
(i) Analysis at week 4 was taken the day after prebiotic was ceased (ii) Increased bifidobacterium levels after prebiotic intervention P = 0.006 (iii) Analysis based on baseline result at week 0 and not baseline of each period following washout (iv) 2-week washout period in between each arm; values increased during this time (except placebo) |
Low PC+ |
| Placebo Group 1: 21.2–22.0 (+0.8) (ns) Group2: 24.2–25.8 (+1.6) (ns) |
(v) Usual diet, advised to keep stable. Avoid intake of fermented milk products and food components containing high quantities of fermentable carbohydrates |
||||||||
|
| |||||||||
| Swanson et al., (2002) [31] |
Randomised placebo controlled trial | n = 62 healthy (n = 25 male) | Probiotic: free-dried Lactobacillus acidophilus NCFM powder ≥ 2 × 10⁹ administered in hard gelatin capsules coated with acid resistant chemical Placebo: cornstarch |
0–4 wks | Freeze thaw deproteinisation, GC, FID | ΔFecal (mg/g dry matter) (within group, wk 0–4) | (i) Concentration of all fecal parameters increased from week 2–4 even in the control group | Very low | |
| Probiotic Prebiotic Synbiotic |
Placebo, n = 15 Prebiotic, n = 15 Probiotic, n = 15 |
Prebiotic: fructose oligosaccharide, (Nutraflora) 6 g administered in non carbonated beverage Placebo: sucrose |
Probiotic Indole 0.13–0.18 (+0.06) (ns) |
(ii) Conclusions were made base on nonstatistically significant data | |||||
| Synbiotic, n = 17 |
2 dose/day | PC 0.26–0.30 (+0.04) (ns) Prebiotic Indole 0.10–0.11 (+0.01) (ns) PC 0.23–0.23 (0) (ns) Synbiotic Indole 0.09–0.08 (−0.01) (ns) |
(iii) No runout period (iv) 3 day food records were analysed for macro nutrients and fibre pre-, during, and postintervention. |
PC– IS– |
|||||
| PC 0.21–0.26 (+0.05) (ns) Placebo Indole 0.12–0.13 (+0.01) (ns) PC 0.22–0.19 (−0.03) (ns) |
(v) Substantial difference in total fibre intakes, that is, probiotic group had 10 g more than prebiotic group at week 6 | ||||||||
|
| |||||||||
| Nakabayashi et al., [36] (2011) |
Synbiotic | Interrupted time series without a parallel control group |
n = 7 hemodialysis |
Probiotic (i) Lactobacillus casei strain Shirota, |
0–2 wk runin | Heat acid deproteinization, HPLC, FS | ΔSerum (mg/L)
∧
(within group, wk 2−4) |
(i) 1 participant used medications that contained live lactic acid bacteria | Very Low |
| (ii) Bifidobacterium breve strain Yakult administered in powder form 3 × 10⁸ each strain | 3–5 wk intervention | PC 17.1–14.2 (−2.9) (0.031) | (ii) No runout period | PC+ | |||||
| Prebiotic: GOS (oligomate 55 N) ≥5 g 3 dose/day |
IS 32.2–30.1 (−1.8) (ns) | (iii) No monitoring of diet | IS– | ||||||
Key:
∧ median difference.
*estimated value from graph, exact value not reported.
#paper stated no change, exact figures not reported.
@no trend was evident among three groups.
AXOS: arabinoxylan-oligosaccharide; FID: flame ionisation detection; FS: fluorescence spectroscopy; GC: gas chromatography; GOS: galactooligosaccharide; HPLC: high performance liquid chromatography; IS: indoxyl sulphate; MS, mass spectrometry; OF-IN, oligofructose-enriched inulin; PC/S: p-cresyl/sulphate; SD: standard deviation; TD: transgalactosylated disaccharide; TOS: trans-galaco oligosaccharide; Tx Grp, treatment group; UV: ultra violet; VIS: visible; wk: week.
There was one randomised placebo-controlled trial [31], four randomised placebo-controlled crossover studies [18, 28–30], three nonrandomised placebo-controlled experimental trials [24, 25, 33], two interrupted time series without a parallel control group [26, 36], and 9 case series [19–23, 27, 32, 34, 35].
3.2. Validity
The overall quality of the studies that met the inclusion criteria was limited. The highest grade in this paper was moderate which four papers achieved [18, 25, 28, 29], eight papers were low [19–22, 24, 27, 30, 33], and the other seven papers were classified as very low (Tables 1, 2, and 3).
3.2.1. Diet
Overall, only one study involved a dietitian to ensure monitoring and controlling for dietary changes [24]. Nine studies made some attempt to control for the diet, such as encouraging the participants to maintain a “stable” or “regular” diet and advised a range of food restrictions, including fermented products, pickles, and natto (traditional Japanese dish) during the intervention [18–22, 27–30]. Four studies made an attempt to monitor the participants' diets throughout the study [23–25, 31]. One study that monitored fibre intake found that the probiotic group had 10 g more fibre than the prebiotic group [31]. This study subsequently found no significant change in uremic toxin levels between the two interventions.
3.2.2. Outcome Measures
The 19 studies spanned across the past 30 years, utilising a range in analytical techniques, therefore making it difficult to directly compare results across studies. The source of outcome measures of PCS and IS ranged from serum concentrations in the HD population to urinary and fecal excretion in the healthy population. Within the studies that reported fecal measures, there were nonconvertible differences between units, that is, mg/g of dry fecal weight, mg/g wet fecal weight and mg/L.
The range in outcome measures was a limitation to which studies were included in the meta-analyses.
3.3. Prebiotic Studies
From the 19 studies that met the inclusion criteria, there were 13 interventions that used prebiotics [18–24, 28–32], with only one in the HD population (Tables 1 and 3) [32]. Twelve of these interventions observed a trend for a decrease in PCS and/or IS, but only eight of 11 reported a significant decrease in PCS and three out of five a significant decrease in IS.
3.3.1. Meta-Analysis
Six out of the 11 studies looking at PCS postintervention were included in the meta-analysis [18, 19, 23, 28–30] with the exclusion of one study in the HD population [32] and five that measured fecal PCS [20–22, 24, 31]. The meta-analysis included five interventions from randomised placebo-controlled crossover trials [18, 28–30] and two case series [19, 23]. The studies used a range of prebiotics and doses, arabinoxylan-oligosaccharide (AXOS) 10 g, [18] oligofructose-enriched inulin (OF-IN) 20 g [19, 30], inulin 15 g [23], and lactulose 20–30 g [19, 28, 29], with a total of 136 patients.
The estimated population treatment effect size in urinary PCS was −7.4 mg/day (95% CI: 5.8–9.0). Meta regression was performed using both dose and type of prebiotics as covariates. The model with the type of treatment as the covariate performed significantly better. However, the estimated true population treatment effects did not differ between the models with/without the type of treatment.
3.3.2. Other Studies
Three out of the five studies that utilised fecal analysis to assess changes in PC and/or indole production found a significant decrease in indole concentrations [20–22] and a trend for reduced PC concentration, that only reached statistical significance in one study [20]. Both of the studies which found a nonsignificant decrease in PC used considerably smaller doses of the prebiotic (3 g lactulose [22], 2.5 g GOS [21]) compared to the other positive studies.
The single prebiotic study conducted in the HD population (n = 22) was a case series design and looked at the effect on both serum IS and PCS [32]. Following the administration of 20 g of OF-IN for four weeks, there was a significant reduction in PC, and a trend for a decrease in IS.
3.3.3. Effect on Microbiota
Six studies citing eight interventions looked at the prebiotic effect on the microbiota, of which seven reported an increase in either bifidobacteria [18, 19, 21, 30] or both Bifidobacterium and Lactobacillus [20, 22]. None of the studies saw a change in the total number of bacteria [18, 20–22], and three studies identified that the changes seen in the microbiota were diminished after the prebiotic was discontinued [18, 20, 21].
The study by Cloetens et al. [18] reported a significant inverse correlation between the levels of bifidobacteria before prebiotic intake and the change in bifidobacterium levels after the three-week intervention [18].
The one negative study, which did not find a significant difference in bifidobacteria, also did not observe a change in fecal indole concentration [24].
3.3.4. Effect on Colonic Transit Time and Fecal Characteristics
Four studies, all from in the healthy population, measured the oral-caecal transit time before and after prebiotic intervention using either labelled substrate method [18, 19, 23] or carboxylic acid breath test [28]. None found a significant change.
One study in the HD population reported an increase in stool quantity following synbiotic treatment, with no change in frequency, form or ease of defecation [36]. Importantly, over 70% of the study population was on regular laxatives throughout the study. None of the other six studies which measured fecal characteristics found a change in fecal weight, consistency, or frequency in the healthy population.
3.3.5. Longevity of Prebiotic Effect
Out of nine studies that found a significant decrease in PC and/or IS, seven measured the run-out effect [18, 20–22, 28–30, 32]. Only two of these studies reported a continued difference after the intervention, day six [21] and week four [32] postintervention. The other studies reported a return to preintervention values as early as the day following the intervention [18, 29, 30].
3.3.6. Gastrointestinal Tolerance
Three studies measured the tolerability of the prebiotic dose through a Likert questionnaire[18, 32] and a symptom diary [24]. The dose of prebiotics ranged from 20 g of OF-IN [32], 10 g AXOS [18], and 7.5–15 g TOS [24] divided into at least two half doses over the day. Flatulence was recognised by all three studies as a symptom. However, the two studies which collected quantitative outcomes reported a mild grade flatulence [18] and only 15% reported a negative tolerance overall [32].
3.4. Probiotic Studies
There were 11 interventions that administered probiotics using an array of different species and strains [25–31, 33–35]. Nine of these studies saw a decreasing trend in PCS and/or IS postintervention, which all seven and four from five found significance, respectively.
3.4.1. Meta-Analysis
Four out of the seven studies looking at PCS postintervention were included in the meta-analysis [25, 28–30] with the exclusion of one study in the HD population [35] and two that did not measure urinary PCS in mg/day [26, 27].
All of the studies included were from placebo-controlled crossover trials, [25, 28–30] and included 83 participants in total. The five interventions investigated probiotics from two different domains bacteria, and yeast.
The population treatment effect size in urinary PCS was −3.95 mg/day (95% CI: −0.12, 8.02), although this reduction was not significant. When adjusted by probiotic type, the effect size seen with bacterial probiotics was significantly greater (−7.05 mg/day; 95% CI: 3.51, 10.58).
3.4.2. Other Studies
Five of the six studies, not included in the meta-analysis, found a reduction in either PC and/or IS following probiotic intervention [26, 27, 33–35]. Tohyama et al. [26] also investigated mechanistic changes in gut activity and found a strong correlation (r = 0.93) between fecal tryptophanase activity and urinary IS, which also decreased postintervention. Hida et al. [35] investigated change in fecal flora which showed a significant decrease in the number of enterobacteria; however, no change in total number of bacteria was observed.
Five studies reported a run-out period and all of them found that PC and/or IS levels had returned to preintervention levels at two weeks postintervention [25–27, 30, 33].
3.5. Synbiotic Studies
Four studies assessed the effect of synbiotics on PCS [28, 30] and both PCS and IS [31, 36] concentrations. Three of these studies reported a trend for a decrease in PCS/IS, although only two of these reached significance with PCS [30, 36].
De Preter et al. conducted a randomized placebo-controlled crossover study which coadministered Lactobacillus casei Shirota 2 × 10⁹ and OF-IN: 20 g and found a significant difference in urinary PCS [30]. This study also looked at the effect on the microbiota whereby there was a trend for a greater increase in bifidobacteria in the synbiotic arm (subgroup n = 9) compared to the prebiotic arm (n = 19), although this did not reach statistical significance. Nakabayashi et al. administered the probiotics in powder form and at a lower dose compared to other studies and still found a significant decrease in PCS (no change in IS) [36]. Of note, this study had a small sample size, n = 7, and included a participant that continued taking a lactic acid bacteria-based medication throughout the study.
3.6. Summary Meta-Analysis
Two of the meta-analyses collated the effects of all interventions, pre-, pro-, and synbiotic studies, one looking at serum IS in the HD population (n = 87) (Figure 2) and the other at urinary PCS in the healthy population (n = 243) (Figure 3). Figure 2 demonstrates that the interventions in the HD population had a population effect size on serum IS of 6.4 mg/L (95% CI: 1.3 to 11.5). Given the limited number of relevant studies, meta regression was not able to be performed using the results from these studies.
Figure 2.
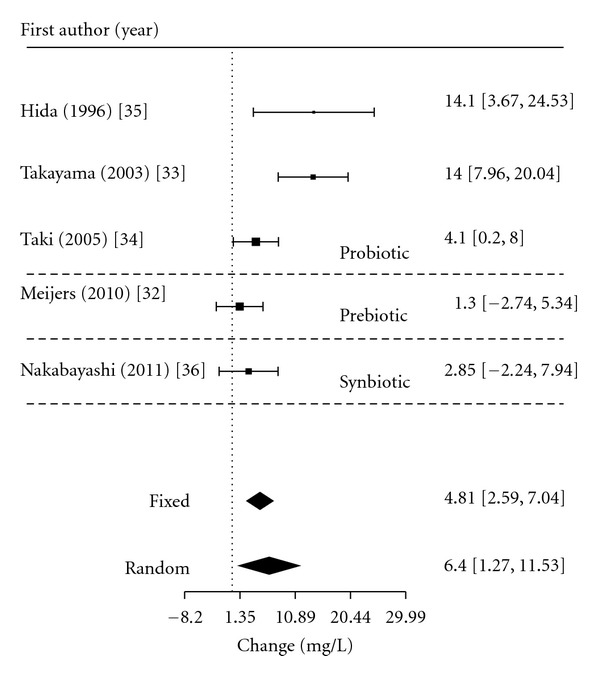
Meta-analysis for pre-, pro-, and synbiotic therapy on serum IS in the HD population.
Figure 3.
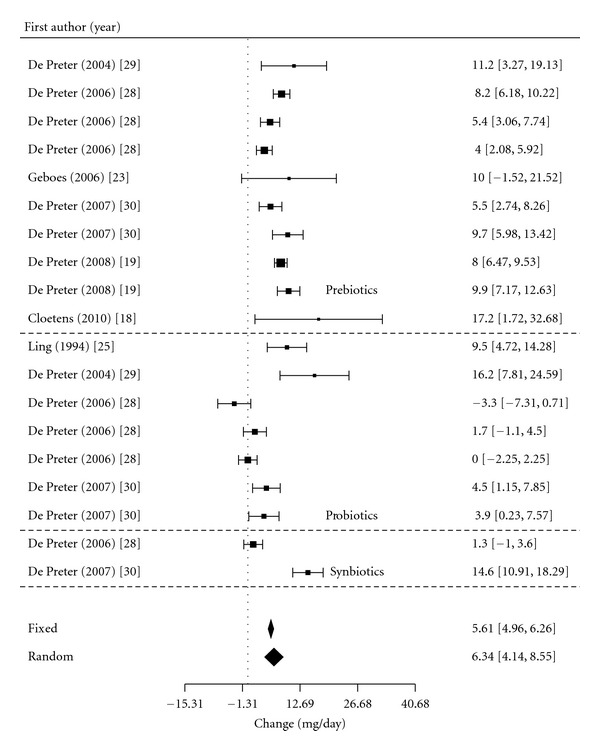
Meta-analysis for pre-, pro-, and synbiotic therapy on urinary PCS in the healthy population.
Figure 3 included all three treatments in the healthy population reported a population effect size of 6.34 mg/day (95% CI: 4.1, 8.6) in urinary PCS. Similarly to the prebiotic meta regression, when adjusted by type of intervention, the model performed significantly better despite no difference between the treatment effects.
3.7. Model Evaluation and Validation
Random effects models fitted the data best for all meta-analyses and the sensitivity analyses confirmed that the correlation assumptions (0.3–0.95) did not make clinically meaningful differences in the population outcome estimates. Hence, the correlation that best aligned with the published results was selected to be reported, 0.8 for the HD analysis and 0.95 for the healthy population.
Funnel plots indicated a small degree of publication bias with small studies tending to report only positive findings in comparison to the large studies which reported both. The heterogeneity of each of the meta-analyses was statistically significant (P < 0.01) though this was reduced when the models were adjusted by type of treatment.
4. Discussion
Overall there appeared to be a positive benefit of all three types of interventions, pre-, pro-, and synbiotics, on reducing the production of both PCS and IS. This benefit was seen in both the HD and healthy populations, although there was insufficient evidence to determine whether one treatment was more beneficial than the other.
Thirteen interventions investigated prebiotics and all but one saw a trend for a decrease in PCS and/or IS [31] with the meta-analysis reported an overall decrease in urinary PCS by 7.4 mg/day. Of the 11 probiotic interventions nine reported a trend for a decrease in PCS and/or IS, with the meta-analysis depicted an overall decrease in urinary PCS by 7.05 mg/day following bacterial probiotic therapy. Out of the four synbiotic interventions, three reported a trend for a decrease in PC and/or IS [28, 30, 36] with only two reaching statistical significance for PC [30, 36].
The studies investigating synbiotics were sparse and achieved variable results. The standout synbiotic study by De Preter et al. (2007) [30] was a parallel control trial and combined a pre- and probiotic that had both shown significant benefits on uremic toxin reduction in isolation [30]. This synbiotic intervention found a significant reduction in urinary PC with a tendency for an additive effect beyond that seen in the individual benefit of pre- and probiotics. De Preter et al. (2006) administered a prebiotic at a dose known to reduce urinary PC levels, 20 g lactulose, together with a probiotic that had previously shown no effect, Saccharomyces boulardii. Interestingly this intervention resulted in a less pronounced effect compared to the prebiotic in isolation [28]. The authors hypothesised that the cause of this less pronounced effect may have been due to the yeast probiotic being capable of using the prebiotic as an energy source leaving less available for the colonic microbiota.
The potential risk of publication bias was indicated in the funnel plot, where only two negative interventions were found in the literature search [28, 31]. Swanson's et al. study found no effect in pre-, pro-, or synbiotic groups at the end of the four-week supplement period [31]. This negative study found a surprising result where the concentrations of PC, IS, and nearly all fecal parameters increased from week two to week four, for all intervention groups and placebo. This study included some dietary monitoring and reported that there was no significant difference in protein intake that could have explained this trend.
Production of PCS and IS is reliant on the amount of protein that enters the large intestine. Exogenous (dietary) protein is the primary source of metabolised protein. There are a number of factors which alter the amount of protein that reaches the large intestine, escaping digestion in the small intestine. This includes protein form, that is, cooked or uncooked, and protein source, that is, animal or plant, as well as several gastrointestinal abnormalities that have been reported in uremic patients including gastrointestinal mobility disorders, small-bowel bacterial overgrowth, gastric hypochlorhydria, and pancreatic abnormalities [37, 38].
It is well established that restriction of dietary protein decreases the generation of both PCS and IS [3]. Several human studies have shown that increases in dietary protein result in increased serum, urine, and/or fecal concentration of PCS and/or IS [39–41]. This highlights that diet is a major confounder to assessing the real benefit of pre- and probiotics on PCS and IS production. Thereby controlling for dietary intakes is of importance in elucidating the effect of these interventions; however, this was rarely undertaken by studies featured in this paper.
It has been recognised that the preintervention values of both the uremic toxins and microflora are correlated with the effect size of pre- and probiotic interventions [18, 19]. This was highlighted in the study by De Preter et al. [19] which found a significant correlation between the baseline levels of urinary PC and effect size of the prebiotic intervention.
The majority of the studies looking at the effect of pre- and probiotics have been conducted in the healthy population where levels of these toxins are low and the microflora is “normalised.” The purpose of reviewing these studies was to confirm the mechanism of PCS and IS reduction through pre- and probiotics. Given that the CKD population have both lower Bifidobacterium and higher uremic toxin levels, the effect size in this group is expected to be significantly higher. It is important to note, however, that the concentration of the uremic toxins differs not only between the different populations, that is, HD and healthy, but also within the HD populations studied. This is attributed to a number of factors including cultural food intake, presence of diabetes, and residual renal function [39, 42]. The common use of antibiotics in the HD population is another factor known to influence the gut microflora and could be attributed to variations in the production of these toxins [43]. It is for this reason that most of the studies reported exclusion criteria around antibiotic use within at least two weeks of study commencement.
For both pre- and probiotics, there appears to be a threshold dose required to see a benefit and beyond this dose there is no additive benefit. Comparing across studies the three interventions which used at least 20 g of lactulose [19, 28, 29] found a decrease in PCS whereas the study which used only 3g per day did not [22]. Studies showed no difference in effect size with daily doses between 20 and 30 g of lactulose, [28] 7.5 and 15 g of trans-GOS [24], and 3 × 10⁹ and 12 × 109 of Bifidobacterium longum [34].
The duration of supplementation further complicates the concept of a threshold dose. A Lactobacillus probiotic administered at the highest dose in this paper, 1 × 10¹¹, for one week found no significant change in IS, whereas another Lactobacillus probiotic administered at a 2-fold lower dose over one month resulted in a significant change.
Given the diversity in the survival rates of different probiotic strains, different characteristics within prebiotic varieties, namely, their different bifidogenic capacities [19], and the minimum duration of supplementation, it is not possible to set a universal threshold dose for either pre- or probiotics.
There was no prebiotic effect seen on the oral-caecal transit time despite this being a recognised benefit of several prebiotics and a potential mechanism for lowering the amount of amino acid fermentation in the large intestine [43, 44]. However, this was tested in only four of the healthy population studies, none of which had any GI issues, compared to the HD population where constipation is common [45]. There was also no change in fecal biomass measured as fecal weight. This is in line with the recent literature which supports that prebiotics alter the type of bacteria but not the total number [23]. Prebiotic-induced flatulence was reported, though there was insufficient data to determine a dose-dependent effect [18, 24, 32]. All efforts were made to ensure this symptom was controlled including multiple smaller doses over the day. The literature also suggests that the increase in flatulence is transient and may resolve over time [46, 47].
There were a number of findings from the microbiota analysis which further support the mechanistic role of pre- and probiotics in reducing PCS and IS. Most of the microbiota analysis was undertaken in the prebiotic interventions with a focus on changes in bifidobacteria, a common property of prebiotics. Two of these studies saw a reduction in fecal PC and indole, and along with increases in Bifidobacterium and Lactobacillus there was a decrease in Bacteroidaceae [20, 22]. The Bacteroidaceae family includes a main producer of PCS [25]. Therefore the combination of the decrease in PCS producing bacteria and the increase in PCS and IS repressing bacteria (Bifidobacteria and Lactobacillus) resulted in significant improvements [25, 34].
Only one probiotic study provided a detailed investigation of the effect on the microbiota [35]. This study illustrated that the fecal flora in the HD population before intervention contained a significantly greater proportion of aerobic bacteria (specifically Escherichia coli), 100 times higher than that in healthy matched controls, and significantly lower Bifidobacteria. Following probiotic administration in the HD population, this study observed a significant decrease in the enterobacteria along with a decrease in serum IS levels. As Escherichia coli has one of the highest observed tryptophanase activities (the enzyme that produced IS), this is a clear example of one of the mechanisms of probiotics.
These findings not only support the potential role that pre- and probiotics may play but also emphasise the need to selectively choose probiotic strains and prebiotic varieties that inhibit the production of bacteria which aid mechanistic association with IS and PCS production.
A number of the studies evaluated in this paper were considered to have no effect, or did not reach statistical significance following pre-, pro-, or synbiotic intervention. Within these studies, several common limitations were identified, including short study duration [27], lower baseline levels of the toxin [32], small prebiotic doses of pre- and/or probiotics [21, 22, 35], small sample size [23], or did not find a decrease in bifidobacterium levels [24].
There are two other therapeutic possibilities for reducing IS and PCS: a low protein diet and oral charcoal adsorbent AST-120. Low protein diets may be contraindicated in the CKD population, especially in the dialysis population with high protein requirements, along with the increased risk of malnutrition, influence on quality of life, and adherence concerns [48–50]. Oral charcoal adsorbent AST-120 (Kremezin, Kureha Chemical Industry, Tokyo, Japan) has been more recently investigated as an effective agent for preventing intestinal absorption of both indole and PC. This compound completed Phase III investigations in the USA in November 2011 [51], and previously demonstrated in earlier studies in Asian countries a delay in the progression of CKD [6]. The side effects of AST-120 are not insignificant, as it may absorb other beneficial nutrients along with uremic toxins, result in constipation and GI upset, and require large fluid intake, all of which are potentially contraindicated in this population group [35].
Nevertheless, AST-120 studies have demonstrated significant decreases in IS. This has been subsequently associated with improvements in CV markers, such as carotid intermedial thickness, arterial stiffness (pulse wave velocity) [52] and flow-mediated vasodilatation [53], and postponement of the start of dialysis [54–56]. Given that pre- and probiotic treatment in CKD is in its infancy, there is a lack of studies measuring its effect on clinical outcomes. Fortunately this benefit can be extrapolated from the AST-120 studies which also measure serum IS concentrations with similar baseline concentrations. The effect size in IS reduction, resulting from AST-120 administration, of 2.8 mg/L resulted in an increase in flow-mediated dilatation in the brachial artery (endothelial function) [53] and a 5.5 mg/L reduction in IS delayed CKD progression [57]. This effect size in IS reduction is in line with the reduction achieved with pre- and probiotics in the HD population illustrated in the meta-analysis (6.4 mg/L).
5. Conclusion
Altering the microbiota via pre- and/or probiotics is a potential treatment for reducing bacterial protein fermentation and therefore the generation of PCS and IS, two nephro- and cardiovascular toxins. This investigation demonstrates that pre-, pro-, and synbiotics hold great potential in lowering PCS and IS production in the CKD population, which may potentially be translated into benefits to clinical outcome, such as reduction in CVD markers and CKD progression. This paper illustrates from the 19 eligible studies looking at this intervention on PCS and/or IS reduction that there is a positive trend for both pre- and probiotics. Unfortunately, there are a number of confounders that hinder the evaluation of this treatment. Strict control of dietary intake as well as appropriate selection of probiotic strains and prebiotic varieties is of importance. The increasing prevalence of CKD coupled with high mortality and morbidity rates and treatment costs presents a compelling and urgent need for further investigation into a cost-effective treatment such as pre- and probiotics. Future well-designed studies are needed so that the full potential of this treatment can be uncovered supporting its application in the clinical setting.
Acknowledgments
This paper was supported by the ANZ Trustees Ph.D. Scholarship in Medical Research, Queensland. K. L. Campbell is supported by a Queensland Government, Office of Health and Medical Research (OHMR) Health Research Fellowship, and a Lions Senior Medical Research Fellowship. D. W. Johnson is also supported by a Queensland Government OHMR Health Research Fellowship. The contribution of the authors was as follows: K. L. Campbell and M. Rossi were responsible for the study concept and development of the search strategy. M. Rossi carried out the search strategy, conducted the analysis, and wrote the draft of the final paper. K. Klein undertook the statistical analysis. All authors took part in the revision of the paper. The authors have no conflict of interests to declare.
References
- 1.Data WLCIP, editor. World Health Organisation. The Global Burden of Disease: 2004 Update . Geneva, Switzerland: WHO Press; 2004. [Google Scholar]
- 2.Weiner DE, Tighiouart H, Amin MG, et al. Chronic kidney disease as a risk factor for cardiovascular disease and all-cause mortality: a pooled analysis of community-based studies. Journal of the American Society of Nephrology . 2004;15(5):1307–1315. doi: 10.1097/01.asn.0000123691.46138.e2. [DOI] [PubMed] [Google Scholar]
- 3.Schepers E, Glorieux G, Vanholder R. The gut: the forgotten organ in Uremia? Blood Purification . 2010;29(2):130–136. doi: 10.1159/000245639. [DOI] [PubMed] [Google Scholar]
- 4.Meijers BKI, De Loor H, Bammens B, Verbeke K, Vanrenterghem Y, Evenepoel P. p-cresyl sulfate and indoxyl sulfate in hemodialysis patients. Clinical Journal of the American Society of Nephrology . 2009;4(12):1932–1938. doi: 10.2215/CJN.02940509. [DOI] [PMC free article] [PubMed] [Google Scholar]
- 5.Taki K, Tsuruta Y, Niwa T. Indoxyl sulfate and atherosclerotic risk factors in hemodialysis patients. American Journal of Nephrology . 2007;27(1):30–35. doi: 10.1159/000098542. [DOI] [PubMed] [Google Scholar]
- 6.Niwa T. Role of indoxyl sulfate in the progression of chronic kidney disease and cardiovascular disease: experimental and clinical effects of oral sorbent AST-120. Therapeutic Apheresis and Dialysis . 2011;15(2):120–124. doi: 10.1111/j.1744-9987.2010.00882.x. [DOI] [PubMed] [Google Scholar]
- 7.Meijers BKI, Evenepoel P. The gut-kidney axis: indoxyl sulfate, p-cresyl sulfate and CKD progression. Nephrology Dialysis Transplantation . 2011;26(3):759–761. doi: 10.1093/ndt/gfq818. [DOI] [PubMed] [Google Scholar]
- 8.Evenepoel P, Meijers BKI, Bammens BRM, Verbeke K. Uremic toxins originating from colonic microbial metabolism. Kidney International . 2009;76(supplement 114):S12–S19. doi: 10.1038/ki.2009.402. [DOI] [PubMed] [Google Scholar]
- 9.Evenepoel P, Claus D, Geypens B, et al. Amount and fate of egg protein escaping assimilation in the small intestine of humans. American Journal of Physiology . 1999;277(5):G935–G943. doi: 10.1152/ajpgi.1999.277.5.G935. [DOI] [PubMed] [Google Scholar]
- 10.Lin CJ, Chen HH, Pan CF, et al. p-cresylsulfate and indoxyl sulfate level at different stages of chronic kidney disease. Journal of Clinical Laboratory Analysis . 2011;25(3):191–197. doi: 10.1002/jcla.20456. [DOI] [PMC free article] [PubMed] [Google Scholar]
- 11.Gibson G, Scott K, Rastall R. Dietary Prebitoics: current status and new defintion. IFIS Functional Foods Bulletin . 2010;7(1):1–19. [Google Scholar]
- 12.National Health and Medical Research Council Guideline Assessment Register Consultants. NHMRC Levels of Evidence and Grades for Recommendations for Developers of Guidelines . N.H.A.M.R. Council; 2009. [Google Scholar]
- 13.Uhlig K, MacLeod A, Craig J, et al. Grading evidence and recommendations for clinical practice guidelines in nephrology. A position statement from Kidney Disease: Improving Global Outcomes (KDIGO) Kidney International . 2006;70(12):2058–2065. doi: 10.1038/sj.ki.5001875. [DOI] [PubMed] [Google Scholar]
- 14.Wishart DS, Tzur D, Knox C, et al. Human Metabolome Database . Canada: Genome Alberta & Genome; 2009. [Google Scholar]
- 15.Vanholder R, Bammens B, De Loor H, et al. Warning: the unfortunate end of p-cresol as a uraemic toxin. Nephrology Dialysis Transplantation . 2011;26(5):1464–1467. doi: 10.1093/ndt/gfr056. [DOI] [PubMed] [Google Scholar]
- 16.R Development Core Team. R: A Language and Environment for Statistical Computing . R Foundation for Statistical Computing; 2011. [Google Scholar]
- 17.Viechtbauer W. Conducting meta-analyses in R with the metafor. Journal of Statistical Software . 2010;36(3):1–48. [Google Scholar]
- 18.Cloetens L, Broekaert WF, Delaedt Y, et al. Tolerance of arabinoxylan-oligosaccharides and their prebiotic activity in healthy subjects: a randomised, placebo-controlled cross-over study. British Journal of Nutrition . 2010;103(5):703–713. doi: 10.1017/S0007114509992248. [DOI] [PubMed] [Google Scholar]
- 19.De Preter V, Vanhoutte T, Huys G, Swings J, Rutgeerts P, Verbeke K. Baseline microbiota activity and initial bifidobacteria counts influence responses to prebiotic dosing in healthy subjects. Alimentary Pharmacology and Therapeutics . 2008;27(6):504–513. doi: 10.1111/j.1365-2036.2007.03588.x. [DOI] [PubMed] [Google Scholar]
- 20.Ito M, Kimura M, Deguchi Y, Miyamori-Watabe A, Yajima T, Kan T. Effects of transgalactosylated disaccharides on the human intestinal microflora and their metabolism. Journal of Nutritional Science and Vitaminology . 1993;39(3):279–288. doi: 10.3177/jnsv.39.279. [DOI] [PubMed] [Google Scholar]
- 21.Ito M, Deguchi Y, Matsumoto K, Kimura M, Onodera N, Yajima T. Influence of galactooligosaccharides on the human fecal microflora. Journal of Nutritional Science and Vitaminology . 1993;39(6):635–640. doi: 10.3177/jnsv.39.635. [DOI] [PubMed] [Google Scholar]
- 22.Terada A, Hara H, Kataoka M, Mitsuoka T. Effect of lactulose on the composition and Metabolic Activity of the Human Faecal Flora. Microbial Ecology in Health and Disease . 1992;5(1):43–50. [Google Scholar]
- 23.Geboes KP, De Hertogh G, De Preter V, et al. The influence of inulin on the absorption of nitrogen and the production of metabolites of protein fermentation in the colon. British Journal of Nutrition . 2006;96(6):1078–1086. doi: 10.1017/bjn20061936. [DOI] [PubMed] [Google Scholar]
- 24.Alles MS, Hartemink R, Meyboom S, et al. Effect of transgalactooligosaccharides on the composition of the human intestinal microflora and on putative risk markers for colon cancer. American Journal of Clinical Nutrition . 1999;69(5):980–991. doi: 10.1093/ajcn/69.5.980. [DOI] [PubMed] [Google Scholar]
- 25.Ling WH, Korpela R, Mykkanen H, Salminen S, Hanninen O. Lactobacillus strain GG supplementation decreases colonic hydrolytic and reductive enzyme activities in healthy female adults. Journal of Nutrition . 1994;124(1):18–23. doi: 10.1093/jn/124.1.18. [DOI] [PubMed] [Google Scholar]
- 26.Tohyama K, Kobayashi Y, Kan T. Effect of lactobacilli on urinary indican excretion in gnotobiotic rats and in man. Microbiology and Immunology . 1981;25(2):101–112. doi: 10.1111/j.1348-0421.1981.tb00014.x. [DOI] [PubMed] [Google Scholar]
- 27.Fujiwara S, Seto Y, Kimura A, Hashiba H. Establishment of orally-administered Lactobacillus gasseri SBT2055SR in the gastrointestinal tract of humans and its influence on intestinal microflora and metabolism. Journal of Applied Microbiology . 2001;90(3):343–352. doi: 10.1046/j.1365-2672.2001.01251.x. [DOI] [PubMed] [Google Scholar]
- 28.De Preter V, Coopmans T, Rutgeerts P, Verbeke K. Influence of long-term administration of lactulose and Saccharomyces boulardii on the colonic generation of phenolic compounds in healthy human subjects. Journal of the American College of Nutrition . 2006;25(6):541–549. doi: 10.1080/07315724.2006.10719570. [DOI] [PubMed] [Google Scholar]
- 29.De Preter V, Geboes K, Verbrugghe K, et al. The in vivo use of the stable isotope-labelled biomarkers lactose-[15N]ureide and [2H4]tyrosine to assess the effects of pro- and prebiotics on the intestinal flora of healthy human volunteers. British Journal of Nutrition . 2004;92(3):439–446. doi: 10.1079/bjn20041228. [DOI] [PubMed] [Google Scholar]
- 30.De Preter V, Vanhoutte T, Huys G, et al. Effects of Lactobacillus casei Shirota, Bifidobacterium breve, and oligofructose-enriched inulin on colonic nitrogen-protein metabolism in healthy humans. American Journal of Physiology . 2007;292(1):G358–G368. doi: 10.1152/ajpgi.00052.2006. [DOI] [PubMed] [Google Scholar]
- 31.Swanson KS, Grieshop CM, Flickinger EA, et al. Fructooligosaccharides and Lactobacillus acidophilus modify bowel function and protein catabolites excreted by healthy humans. Journal of Nutrition . 2002;132(10):3042–3050. doi: 10.1093/jn/131.10.3042. [DOI] [PubMed] [Google Scholar]
- 32.Meijers BKI, De Preter V, Verbeke K, Vanrenterghem Y, Evenepoel P. P-Cresyl sulfate serum concentrations in haemodialysis patients are reduced by the prebiotic oligofructose-enriched inulin. Nephrology Dialysis Transplantation . 2010;25(1):219–224. doi: 10.1093/ndt/gfp414. [DOI] [PubMed] [Google Scholar]
- 33.Takayama F, Taki K, Niwa T. Bifidobacterium in gastro-resistant seamless capsule reduces serum levels of indoxyl sulfate in patients on hemodialysis. American Journal of Kidney Diseases . 2003;41(3):S142–S145. doi: 10.1053/ajkd.2003.50104. [DOI] [PubMed] [Google Scholar]
- 34.Taki K, Takayama F, Niwa T. Beneficial effects of Bifidobacteria in a gastroresistant seamless capsule on hyperhomocysteinemia in hemodialysis patients. Journal of Renal Nutrition . 2005;15(1):77–80. doi: 10.1053/j.jrn.2004.09.028. [DOI] [PubMed] [Google Scholar]
- 35.Hida M, Aiba Y, Sawamura S, Suzuki N, Satoh T, Koga Y. Inhibition of the accumulation of uremic toxins in the blood and their precursors in the feces after oval administration of Lebenin, a lactic acid bacteria preparation, to uremic patients undergoing hemodialysis. Nephron . 1996;74(2):349–355. doi: 10.1159/000189334. [DOI] [PubMed] [Google Scholar]
- 36.Nakabayashi I, Nakamura M, Kawakami K, et al. Effects of synbiotic treatment on serum level of p-cresol in haemodialysis patients: a preliminary study. Nephrology Dialysis Transplantation . 2011;26(3):1094–1098. doi: 10.1093/ndt/gfq624. [DOI] [PubMed] [Google Scholar]
- 37.Bammens B, Evenepoel P, Verbeke K, Vanrenterghem Y. Impairment of small intestinal protein assimilation in patients with end-stage renal disease: extending the malnutrition-inflammation-atherosclerosis concept. American Journal of Clinical Nutrition . 2004;80(6):1536–1543. doi: 10.1093/ajcn/80.6.1536. [DOI] [PubMed] [Google Scholar]
- 38.Bammens B, Verbeke K, Vanrenterghem Y, Evenepoel P. Evidence for impaired assimilation of protein in chronic renal failure. Kidney International . 2003;64(6):2196–2203. doi: 10.1046/j.1523-1755.2003.00314.x. [DOI] [PubMed] [Google Scholar]
- 39.Cummings JH, Hill MJ, Bone ES. The effect of meat protein and dietary fiber on colonic function and metabolism. II. Bacterial metabolites in feces and urine. American Journal of Clinical Nutrition . 1979;32(10):2094–2101. doi: 10.1093/ajcn/32.10.2094. [DOI] [PubMed] [Google Scholar]
- 40.Geypens B, Claus D, Evenepoel P, et al. Influence of dietary protein supplements on the formation of bacterial metabolites in the colon. Gut . 1997;41(1):70–76. doi: 10.1136/gut.41.1.70. [DOI] [PMC free article] [PubMed] [Google Scholar]
- 41.Ling WH, Hanninen O. Shifting from a conventional diet to an uncooked vegan diet reversibly alters fecal hydrolytic activities in humans. Journal of Nutrition . 1992;122(4):924–930. doi: 10.1093/jn/122.4.924. [DOI] [PubMed] [Google Scholar]
- 42.Lee CT, Kuo CC, Chen YM, et al. Factors associated with blood concentrations of Indoxyl sulfate and p-Cresol in patients undergoing peritoneal dialysis. Peritoneal Dialysis International . 2010;30(4):456–463. doi: 10.3747/pdi.2009.00092. [DOI] [PubMed] [Google Scholar]
- 43.Vitetta L, Sali A. Probiotics, prebiotics and gastrointestinal health. Medicine Today . 2008;9(9):65–70. [Google Scholar]
- 44.Sutton D, Dumbleton S, Allaway C. Can increased dietary fibre reduce laxative requirement in peritoneal dialysis patients? Journal of Renal Care . 2007;33(4):174–178. doi: 10.1111/j.1755-6686.2007.tb00068.x. [DOI] [PubMed] [Google Scholar]
- 45.Wang HF, Lim PS, Kao MD, Chan EC, Lin LC, Wang NP. Use of isomalto-oligosaccharide in the treatment of lipid profiles and constipation in hemodialysis patients. Journal of Renal Nutrition . 2001;11(2):73–79. doi: 10.1016/s1051-2276(01)92591-9. [DOI] [PubMed] [Google Scholar]
- 46.Den Hond E, Geypens B, Ghoos Y. Effect of high performance chicory inulin on constipation. Nutrition Research . 2000;20(5):731–736. [Google Scholar]
- 47.Hasler CM. Functional foods: their role in disease prevention and health promotion. Food Technology . 1998;52(11):63–70. [Google Scholar]
- 48.Campbell KL, Ash S, Bauer JD, Davies PSW. Evaluation of nutrition assessment tools compared with body cell mass for the assessment of malnutrition in chronic kidney disease. Journal of Renal Nutrition . 2007;17(3):189–195. doi: 10.1053/j.jrn.2006.12.005. [DOI] [PubMed] [Google Scholar]
- 49.Heimbürger O, Qureshi AR, Blaner WS, Berglund L, Stenvinkel P. Hand-grip muscle strength, lean body mass, and plasma proteins as markers of nutritional status in patients with chronic renal failure close to start of dialysis therapy. American Journal of Kidney Diseases . 2000;36(6):1213–1225. doi: 10.1053/ajkd.2000.19837. [DOI] [PubMed] [Google Scholar]
- 50.Campbell K, Campbellm K, MacLaughlin H, et al. Evidence based practice guidelines for the nutritional management of chronic kidney disease. Nutrition & Dietetics . 2007;63(supplement 2):S33–S45. [Google Scholar]
- 51.Mitsubishi Tanabe Pharma Corporation. A Study of AST-120 For Evaluating Prevention of Progression in Chronic Kidney Disease (EPPIC-1) 2011. [Google Scholar]
- 52.Nakamura T, Kawagoe Y, Matsuda T, et al. Oral adsorbent AST-120 decreases carotid intima-media thickness and arterial stiffness in patients with chronic renal failure. Kidney and Blood Pressure Research . 2004;27(2):121–126. doi: 10.1159/000077536. [DOI] [PubMed] [Google Scholar]
- 53.Yu M, Kim YJ, Kang DH. Indoxyl sulfate-induced endothelial dysfunction in patients with chronic kidney disease via an induction of oxidative stress. Clinical Journal of the American Society of Nephrology . 2011;6(1):30–39. doi: 10.2215/CJN.05340610. [DOI] [PMC free article] [PubMed] [Google Scholar]
- 54.Sanaka T, Akizawa T, Koide K, Koshikawa S. Clinical analysis of renoprotective responding patients administrated with oral adsorbent in chronic renal failure secondary to chronic glomerulonephritis. Therapeutic Apheresis . 2003;7(2):269–278. doi: 10.1046/j.1526-0968.2003.00024.x. [DOI] [PubMed] [Google Scholar]
- 55.Ueda H, Shibahara N, Takagi S, Inoue T, Katsuoka Y. AST-120, an oral adsorbent, delays the initiation of dialysis in patients with chronic kidney diseases. Therapeutic Apheresis and Dialysis . 2007;11(3):189–195. doi: 10.1111/j.1744-9987.2007.00430.x. [DOI] [PubMed] [Google Scholar]
- 56.Yorioka N, Ito T, Masaki T, et al. Dose-independent effect of an oral adsorbent, AST-120, in patients with early chronic renal failure. Journal of International Medical Research . 2002;30(5):467–475. doi: 10.1177/147323000203000501. [DOI] [PubMed] [Google Scholar]
- 57.Owada A, Nakao M, Koike J, Ujiie K, Tomita K, Shiigai T. Effects of oral adsorbent AST-120 on the progression of chronic renal failure: a randomized controlled study. Kidney International, Supplement . 1997;51(63):S188–S190. [PubMed] [Google Scholar]