

Abstract
Members of the neuroligin (NL) family of cell-adhesion proteins are found at excitatory and inhibitory synapses and are mutated in some familial forms of autism spectrum disorders. Although they display synaptogenic properties in heterologous systems, a function of NLs in vivo in regulating synapse formation and synapse number has been difficult to establish. Here we show that neuroligin-1 (NL1), which is located at excitatory post-synaptic densities, does regulate activity-dependent synaptogenesis as well as mature synapse number on cortical layer 2/3 pyramidal neurons in vivo. However, synapse number is not sensitive to absolute NL1 levels but rather to transcellular differences in the relative amounts of NL1. These effects are independent of the cell-autonomous regulation of NMDA-type glutamate receptors by absolute levels of NL1. Our data indicate that transcellular competitive processes govern synapse formation and number in developing cortex and that NL1 plays a central function in these processes.
Introduction
Neocortical development progresses through stages of synaptogenesis and synapse refinement that establish cell-to-cell connectivity and network topology1, 2. During early development, intrinsically-generated patterned activity helps establish the correct connectivity between and within brain regions3, 4. During later development, perturbations of sensory experience of the animal alter connectivity within sensory cortices, indicating that the activity-dependent control of synaptogenesis shapes post-natal development5–7. Additionally, molecular cues, including gradients of signaling molecules and intercellular cell-adhesion complexes, regulate many aspects of circuit and cellular development8–11. Thus, post-natal development of cerebral cortex is governed by activity-dependent and independent mechanisms that regulate synaptic connectivity.
Transsynaptic cell-adhesion molecules, which are present at synapses and mediate transcellular and intracellular signals, regulate both activity-dependent and independent synaptic maturation during development9, 10, 12, 13. The Neuroligin family of proteins (NLs), consisting of synaptically-localized cell-adhesion molecules that are expressed in a developmentally regulated manner, have been proposed to regulate many aspects of synaptic transmission and development14, 15. Four NLs have been identified in mice and localization of each family member varies16–18. For example, NL1 is predominantly postsynaptic at excitatory synapses14 and binds to presynaptic neurexins, an interaction that is thought to act after initial synapse formation to regulate synapse maturation19. In contrast, NL2 is found predominantly at inhibitory synaptic terminals15 and regulates assembly of GABAergic synapses20. The importance of NL-dependent signaling to human brain development is highlighted by the finding of mutations in NLs and neurexins in families with genetic forms of autism21–23.
Defining the functions of NL1 in synapse development and separating its transcellular vs. cell-autonomous contributions have been difficult. Up- and down-regulation of NL1 increases and decreases, respectively, synaptic currents mediated by NMDA-type glutamate receptors (NMDARs) 19, 24–26 (but see15). However, whether the number and structure of excitatory synapses are regulated by NL1 is unclear, and results from studies of various preparations are in conflict. NL1 expressed in non-neuronal cells attracts axons and induces formation of rudimentary presynaptic boutons27, suggesting that NL1 is intrinsically synaptogenic. In cultured neurons, the number of glutamatergic synapses increases with overexpression of NL119, 28–34 and decreases with knock-down of NL1 with RNA-interference29. On the other hand, despite a perinatal lethal phenotype and perturbations of synaptic transmission in respiratory nuclei, neurons from triple NL1-3 knockout (KO) mice have normal synapse number and synaptic ultrastructure15. Similarly, widespread or sparse loss of NL1 in hippocampus or amygdala does not alter synapse number15, 24, 25. Thus, studies of cultured neurons whose NL1 levels have been manipulated ex vivo indicate that NL1 regulates synapse number and spine morphology, whereas analyses in vivo or of tissue acutely prepared from KO animals have not supported this conclusion.
A possible explanation for these conflicting results is that differences in activity patterns between neurons in culture and in vivo may reveal or mask effects of NL1 loss, a hypothesis that is consistent with the dependence of the synaptic effects of NL1 overexpression on activity levels in cultured neurons19. Alternatively, differences may arise due to the timing of the manipulation, the brain region examined, or the fraction of neurons that are affected.
To determine if NL1 regulates the formation, morphology, and function of excitatory synapses in vivo, we examined cortical layer 2/3 pyramidal neurons whose levels of NL1 had been up- or down-regulated from the time of neuronal birth. Synapse structure and function in tissue in which all neurons lack NL1 was compared to that in genetically mosaic tissue in which NL1 levels vary from cell to cell. Analysis in acute brain slices revealed that early postnatal defects in NMDARs are triggered by both global and sparse loss of NL1. Conversely, NL1-dependent changes in synapse number and activity-dependent synaptogenesis are revealed only when differences in NL1 levels exist across neurons. For this reason, the effects of NL1 knock-down or overexpression are different in wild-type, NL1 heterozygote, and NL1 null mice. Thus, transcellular differences in NL1 levels during development, but not the absolute levels of NL1 in individual cells, regulate activity-dependent synaptogenesis and determine the mature structure and function of cortical neurons.
RESULTS
Modulation of excitatory synapse number by sparse knock-down of neuroligin-1
To determine if postsynaptic NL1 levels regulate synapse development in vivo, we induced RNA interference (RNAi) to knock-down NL1 in cortical neurons using in utero electroporation. Electroporation at embryonic stage 15.5, when progenitors for layer 2/3 cortical neurons are accessible, results in sparse transfection (up to ~20%) of layer 2/3 pyramidal neurons while allowing neurons to develop in vivo under largely normal network activity and connectivity (Fig. 1a).
Figure 1.
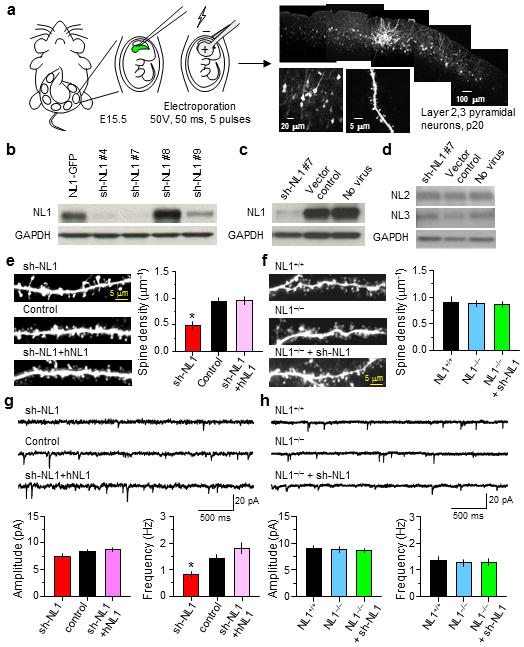
Sparse knock-down of NL1 but not NL1 global knockout reduces synapse number and spine density in cortical layer 2/3 pyramidal neurons
(a) left, Schematic of the in utero electroporation method used to transfect neocortical layer 2/3 pyramidal neurons in vivo. right, Low and high magnification images of an acute slice showing EGFP expression in layer 2/3 pyramidal neurons.
(b) Western blot analysis of knock-down efficiency in shNL1 and NL1-GFP transfected HEK293T cells.
(c–d) Western blot analysis of endogenous NL1-3 expression in dissociated cortical cultures transduced with lentivirus encoding sh-NL1 #7 or lentivirus carrying a control vector compared to that in uninfected controls.
(e) Examples and summary of spine density in layer 2/3 pyramidal neurons in acute brain slices expressing EGFP (control), sh-NL1#7 (sh-NL1), or sh-NL1 and hNL1.
(f) Examples and summary of spine density in acute brain slices of NL1+/+, NL1−/−, and NL1−/− neurons transfected with sh-NL1.
(g–h) Representative mEPSCs (top) and their average amplitude and frequency (bottom) for neurons of each indicated genotype. Error bars: s.e.m. *: p<0.05 vs. control.
Plasmids encoding small-hairpin RNAs (shRNA) with sequence homology to mouse NL1 were designed and purchased (see methods). Constructs were tested in vitro for knock-down of an NL1-EGFP fusion protein in HEK293 cells (Fig. 1b). The most effective construct, sh-NL1 #7, was used for the majority of subsequent experiments and is referred to as sh-NL1 below. This construct was effective in neurons, as transduction of dissociated cortical cultures with lentiviruses encoding the plasmid strongly reduced endogenous NL1 levels (Fig. 1c). Reduction of NL1 expression did not significantly alter levels of the family members NL2 and NL3 (Fig. 1d).
Examination of dendritic spines of sh-NL1 expressing neurons in acute slices prepared from postnatal day 17–21 in utero electroporated mice revealed that spine length and head area were increased and spine density was reduced compared to control EGFP transfected neurons (Supplementary Fig. 1a and Fig. 1e; sh-NL1 and control: 0.50±0.06, 0.91±0.04 spines/μm, 11–17 neurons, 25–27 dendrites, p<0.05). Cotransfection of sh-NL1 and human NL1 (hNL1), which contains sequence alterations in the region targeted by sh-NL1, suppressed the effects of NL1 knockdown (Supplementary Fig. 1a and Fig. 1e; 0.93±0.05 spines/μm, 10 neurons, 22 dendrites, p>0.05 vs. control), indicating that spine changes in sh-NL1-expressing neurons were due to loss of NL1. Similar morphological changes were observed in biolistically transfected hippocampal CA1 pyramidal neurons in organotypic slice cultures (Supplementary Fig. 2).
The frequency of miniature excitatory postsynaptic currents (mEPSCs) in NL1 knock-down neurons measured by whole-cell voltage-clamp was reduced without significant effect on their amplitude (Fig. 1g; sh-NL1 and control: amplitude: 7.40±0.54 pA, n=8, 8.36±0.41 pA, n=10, p>0.05; frequency: 0.82±0.12 Hz, n=8, 1.40±0.17 Hz, n=10, p<0.05). These effects were prevented by cotransfection hNL1 (Fig. 1g; amplitude: 8.71±0.42 pA, frequency: 1.81±0.20 Hz, n=10, p>0.05 vs. control), confirming the NL1-dependence of the effects on synapse number.
Nevertheless, similar effects were not observed in layer 2/3 pyramidal neurons of NL1 knock-out (KO) mice, which had no spine morphology or density changes compared to those in wildtype (WT) animals (Fig. 1f and Supplementary Fig. 1b; NL1+/+: 0.91±0.1 spines/μm, 9 neurons/19 dendrites, NL1−/−: 0.88±0.05 spines/μm, 10 neurons/22 dendrites, p>0.05). Importantly, introduction of sh-NL1 into NL1−/− neurons had no effect on the structure and density of spines (Supplementary Fig. 1b and Fig. 1g; NL1−/−+ sh-NL1: 0.87±0.05 spines/μm, 10 neurons/19 dendrites, p>0.05 for each vs. NL1+/+), confirming that the effects of sh-NL1 in WT animals were due to the loss of NL1 and not to possible off-target effects of the shRNA. Similarly, no changes in mEPSC amplitude and frequency were observed (Fig. 1h; NL1+/+, NL1−/−, and NL1−/−+sh-NL1: frequency: 1.35±0.16 Hz, n=8, 1.28±0.13, n=9, 1.30±0.1, n=8; amplitude: 9.0±1.5 Hz, n=8, 8.8±1.7, n=9, 8.7±1.3, n=9). Thus reduction of NL1 levels in a sparse subset of cortical neurons alters synapse number whereas global knockout of the gene has no effect. Importantly, both sets of experiments were carried out in the same cell type and in the same in vivo context.
Neuroligin-1 modulates NMDAR-mediated currents and Ca2+ transients of individual postsynaptic terminals
A possible mechanism for NL1-dependent modulation of synapse number is by reduction of NMDARs, which regulate synapse structure and function via a variety of mechanisms and whose activation triggers activity-dependent synaptogenesis in developing layer 2/3 pyramidal neurons35. To determine if the functional properties of individual postsynaptic terminals are differentially affected by sparse vs. global manipulations of NL1, we used glutamate uncaging to examine AMPAR- and NMDAR-mediated currents and Ca2+ influx. Whole-cell recordings were obtained from layer 2/3 pyramidal neurons using intracellular solutions containing Alexa Fluor-594 (20 μM) to visualize morphology and a Ca2+ indicator, Fluo-5F (300 μM), to monitor intracellular Ca2+. MNI-glutamate (5 mM) in the extracellular solution was photolysed to release glutamate by 2-photon excitation with 0.5 ms-long 720 nm laser pulses. To improve voltage-clamp and monitor single terminal AMPAR and NMDAR signals, voltage-gated potassium, sodium, and Ca2+ channels were blocked with a cocktail of antagonists (see methods). Uncaging glutamate near a visualized spine elicited uncaging-evoked AMPAR- and NMDAR-EPSCs (AMPAR-uEPSCs and NMDAR-uEPSCs) that were measured by holding cells at −60 and +40 mV, respectively (Fig. 2b). Simultaneous measurement of green fluorescence was used to monitor Ca2+ transients in the active spine and neighboring dendrite (Fig. 2a,b) at −60 mV. Under these conditions Ca2+ enters the spine through NMDARs which are not fully blocked by extracellular Mg2+ 36, 37.
Figure 2.
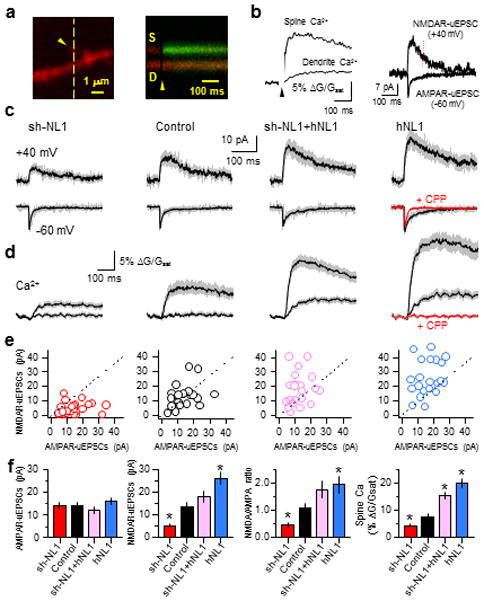
Neuroligin-1 modulates NMDAR-mediated currents and Ca2+ signaling at individual postsynaptic terminals
(a) left, Image of a spine and dendrite filled with 20 μM Alexa-594 and 300 μM Fluo-5F showing the location of the glutamate uncaging spot (arrow head) and the orientation of the line scan (dashed line). right, Time course of fluorescent transients measured in the line scan following glutamate uncaging at the time indicated by the arrow head. Increased green fluorescence indicates Ca2+ entry.
(b) left, Quantification of the green fluorescence transient in the spine and neighboring dendrite at −60 mV. right, AMPAR- and NMDAR-mediated uEPSCs at −60 and +40 mV, respectively. The red dashed line (70 ms after uncaging pulse) indicates the time at which the amplitude of NMDAR-uEPSCs was measured.
(c) Average uEPSCs at −60 mV and +40 mV for neurons of the indicated genotypes and from hNL1 transfected neurons in the presence of CPP (red trace).
(d) Average Ca2+ transients in spines (larger traces) and dendrites (smaller traces) for neurons of the indicated genotypes −60 mV.
(e) Distributions of AMPAR- and NMDAR-uEPSCs amplitudes for each spinein each genotype.
(f) Summary of (left to right) AMPAR-uEPSC amplitude, NMDAR-uEPSC amplitude, NMDAR- to AMPAR-uEPSC amplitude ratio, and spine Ca2+ are shown. Error bars represent s.e.m.
Voltage-clamp recordings from sh-NL1-transfected neurons did not reveal significant differences in AMPAR-uEPSCs compared to control (Fig. 2c,f; sh-NL1 and control: 14.0±1.6 pA, n=25; 14.2±1.7, n=20, p>0.05). However, at these same postsynaptic terminals NMDAR uEPSCs (sh-NL1 and control: 5.0±0.8 pA; n=25, 13.7±1.8 pA, n=20, p<0.05) and Ca2+ transients (sh-NL1 and control ΔG/Gsat: 4.1±0.6%, n=25; 7.6±1.0%, n=20, p<0.05) were smaller in sh-NL1 expressing neurons (Fig. 2c–f), consistent with reduced NMDAR content in individual spines. Both NMDAR-uEPSCs and Ca2+ influx were restored or increased beyond control levels by coexpression of sh-NL1 and hNL1 (Fig. 2c–f, NMDAR-uEPSCs: 18.1±2.4 pA, n=21, p>0.05 vs. control; ΔG/Gsat: 15.3±1.4%, n=21, p<0.05). Similarly, larger NMDAR-uEPSCs and Ca2+ transients were measured from spines of cells transfected with hNL1 alone (Fig. 2c–f; NMDAR-uEPSCs: 26.0±2.7 pA, n=21, p<0.05; ΔG/Gsat: 19.9±1.7%, n=21, p<0.05). This positive correlation between NL1 levels and NMDAR-mediated synaptic signals suggests that NL1 facilitates incorporation or retention of NMDARs in the postsynaptic terminal, consistent with previous studies31, 33, 38.
The peak amplitude of uEPSCs measured at −60 mV was not modulated by NL1 levels, but its decay was slowed in hNL1-transfected neurons (Fig. 2c). To determine if this prolongation resulted from alterations of AMPAR properties or if it represented an unusual contribution of NMDAR currents at resting potentials, we repeated recordings in the presence of the NMDAR antagonist CPP (10 μM). CPP application abolished the spine and dendrite Ca2+ signals as well as the slow component of uEPSC, confirming that all were due to NMDAR activation (Fig. 2d).
Parallel analyses were carried out in NL1−/− mice (Fig. 3), in which NMDAR/AMPAR current ratios have been previously reported to be reduced in hippocampal CA1 pyramidal neurons, amygdala principal neurons, and striatal medium spiny neurons 19, 24, 39. Consistent with these reports, we found that glutamate uncaging evoked AMPAR-uEPSCs measured from individual spines of layer 2/3 pyramidal neurons were not different between NL1−/− and NL1+/+ littermate mice, whereas NMDAR-uEPSCs were significantly smaller in NL1−/−mice (Fig. 3a,d; NL1+/+ and NL1−/−: AMPAR-uEPSCs: 10.7±1.3 pA, n=24, 8.6 ± 1.2 pA, n=25, p>0.05, NMDAR-uEPSCs: 9.9±1.2 pA, n=24, 4.0±0.8 pA, n=25, p<0.05). NMDAR-mediated spine Ca2+ influx was also reduced (Fig. 3b; NL1+/+ and NL1−/−: ΔG/Gsat: 8.8±1.1%, n=24, 5.2±0.6 pA, n=25, p<0.05). Furthermore, introducing sh-NL1 into NL1−/− KO neurons had no effect on NMDAR-uEPSCs and Ca2+ influx, indicating that, as expected for an NL1-dependent phenomenon, sh-NL1-mediated effects were occluded by constitutive loss of NL1 (Fig. 3a–d; NL1−/−+sh-NL1: AMPAR-uEPSCs, NMDAR-uEPSCs, and spine ΔG/Gsat: 11.0±1.3 pA, 5.2±0.6 pA, and 4.9±0.5%, n=20, p>0.05 for each vs. NL1−/−). Thus, the effects of NL1 loss on synaptic NMDARs are similar in the global knock-out and RNAi-induced sparse knock-down, indicating that the level of NL1 in each cell intrinsically regulates NMDAR-signaling but not excitatory synapse number.
Figure 3.
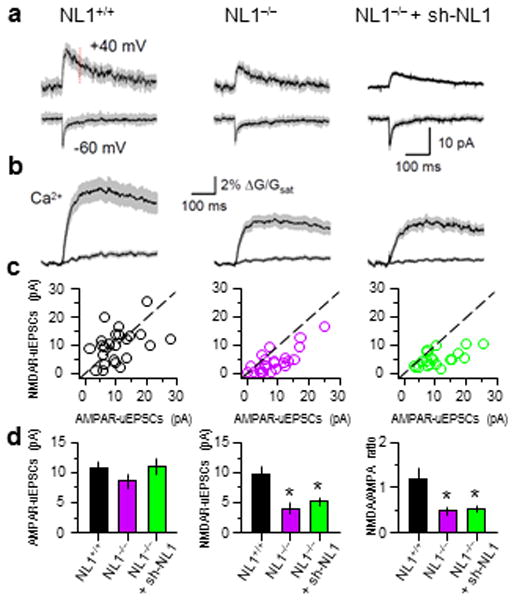
Constitutive NL1 knock-out lowers NMDAR-uEPSCs and Ca2+ transients
(a and b) Average AMPAR- and NMDAR-uEPSCs (a) and spine and dendrite Ca2+ transients at −60 mV (b) for neurons of the indicated genotypes.
(c) Relationship between AMPAR- and NMDAR-uEPSCs measured in the indicated genotypes.
(d) Average amplitudes of AMPAR- (left) and NMDAR- (middle) uEPSCs and NMDAR/AMPAR current ratios (right).
Neuroligin-1 levels modulate glutamate-induced spinogenesis
Overexpression of NL1 in dissociated neuronal cultures influences synapse number in an activity-dependent manner19, suggesting that NL1 regulates the selection of synapses after initial synapse formation. To determine if NL1 also regulates initial synapse formation, we utilized a glutamate uncaging protocol that triggers the rapid and de novo formation of a spine and the establishment of a new synapse (Fig. 4a)35. This process requires activation of dendritic NMDA receptors, which are perturbed by changes in NL1 expression (see below).
Figure 4.
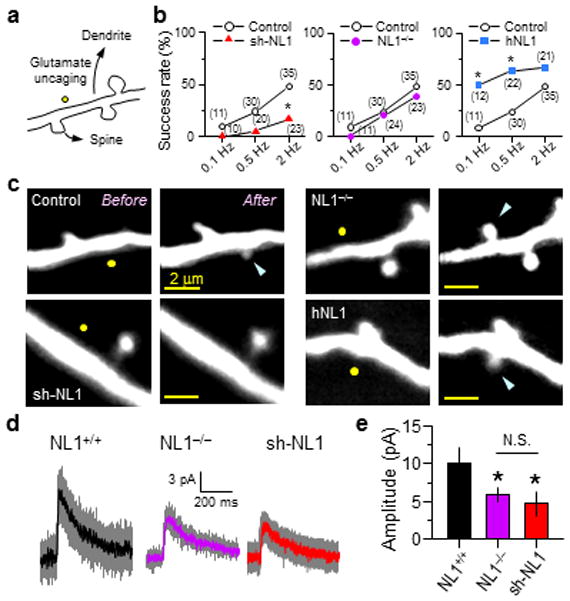
NL1 regulates activity-dependent spinogenesis
(a) Schematic of glutamate-induced spinogenesis. Dendrites of EGFP-expressing cortical layer 2/3 pyramidal neurons in acute slices from P8~12 mice were visualized with 2PLSM, and glutamate (40 pulses) was released by photolysis of caged glutamate near a low-spine density section of dendrite.
(b) Success rate of de novo spine formation in neurons where NL1 level is reduced or increased. The numbers of attempts are shown in parentheses. *:p<0.05 vs. control.
(c) Representative images of attempted spinogenesis experiments from WT neurons transfected with EGFP, sh-NL1, or hNL1, and from an EGFP-transfected NL1−/− neuron. Yellow circles and blue arrows indicate uncaging positions and, when applicable, nascent spines, respectively.
(d–e) Average dendritic NMDAR uEPSCs (d) and amplitudes (e) recorded at +40 mV in the presence of NBQX from P9-11 neurons of the indicated genotypes. Glutamate was released 0.5 μm from the dendritic shaft.
In wild-type animals, sparse knock-down of NL1 in layer 2/3 pyramidal neurons by RNA interference lowered, whereas overexpression of NL1 increased, the success rate of new spine generation (Fig. 4b,c). The magnitude of the effects depended on the frequency of stimulation such that NL1 overexpression enhanced the low probability of spinogenesis seen with low-frequency stimuli whereas down-regulation of NL1 decreased the high success rate triggered by higher frequency stimuli. In contrast, the same class of neurons in NL1 KO mice displayed normal activity-dependent spinogenesis. Furthermore, the normal synaptogenetic potential of neurons in NL1 KO mice occurs despite a ~50% reduction in dendritic NMDAR currents (Fig. 4d,e; NL1+/+ and NL1−/−: NMDAR-uEPSCs: 10.0±2.1 pA, n=15, 5.9±0.9 pA, n=15, p<0.05), which was not different from that seen in shNL1 transfected neurons in WT animals (Fig. 4d,e; 4.7±0.9 pA, n=16, p>0.05). Thus, sparse but not global manipulations of NL1 modulate the threshold of activity-dependent spinogenesis, likely explaining the parallel observations in synapse and spine number at later developmental stages.
Excitatory synapse number is regulated by relative levels of Neuroligin-1
The findings that synapse number and structure are altered in neurons with NL1 knock-down but not in neurons with NL1 KO may be explained by a transcellular competitive mechanism40, 41. In this model, a cell expressing higher levels of NL1 relative to its neighbors has an advantage in forming synapses. For example, each cortical neuron might compete in NL1-dependent manner with surrounding neurons to establish proper connectivity with a limited number of presynaptic boutons. If correct, this mechanism explains why manipulations that eliminate NL1 from all neurons fail to recapitulate the perturbations seen in genetically mosaic tissue.
To test this model, we performed co-culture experiments in which NL1+/+ and NL1−/− neurons were mixed. We used in utero electroporation to transfect EGFP into layer 2/3 pyramidal neurons of NL1 KO mice. Cultures of cortical neurons were prepared by mixing, at specific ratios, cells dissociated from these manipulated NL1 KO mice and age-matched wild-type mice (Fig. 5a). Consistent with the competition hypothesis, neurons in pure cultures of NL1−/− or NL1+/+ cells had similar spine densities (Fig. 5c; NL1+/+ and NL1−/−:1.03±0.03 spines/μm, 37 fields of view, 1.01±0.05 spines/μm, 21 fields of view, p>0.05). However, when NL1−/− cells were mixed 1:1 with NL1+/+ neurons, spine density in the NL1−/− cells was reduced (Fig. 5c; 0.58±0.05 spines/μm, 16 fields of view, p<0.05). Spine density was further reduced when the ratio of NL1−/− to NL1+/+ cells was reduced to 1:5 (Fig. 5c; 0.39±0.04 spines/μm, 18 fields of view, p<0.05). Thus, the spine density of NL1−/− cortical layer 2/3 pyramidal neurons in culture depends on the fraction of co-cultured neurons that express NL1, indicating that transcellular interactions determine synapse number. These results are obtained without use of RNA-interference, demonstrating context-dependent defects in synapse numbers in neurons with constitutive genetic loss of NL1.
Figure 5.
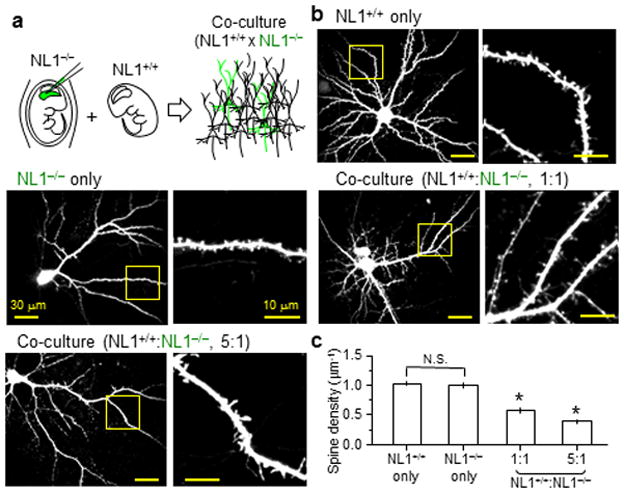
Spine density of NL1−/− neurons in vitro is affected by presence of neighboring NL1+/+ neurons
(a) Schematic of the co-culture experiment. NL1−/− mice were in utero electroporated to label layer 2/3 pyramidal neurons with EGFP. Dissociated cortical cultures were prepared from these mice and mixed with neurons of unlabelled WT mice at varying ratios.
(b) Representative low (left) and high (right) magnification images of neurons and spiny dendrites.
(c) Average spine densities in NL−/− neurons mixed with NL1+/+ neurons at different ratios.
Levels of endogenous neuroligin-1 expression vary across cortical neurons
To understand whether neuron-to-neuron variability in NL1 expression in vivo could support the competitive model presented above, we measured mRNA levels by fluorescence in situ hybridization (ISH) across cortical neurons (Fig. 6). NL1 mRNA was detected throughout all cortical layers without layer-specific expression (Fig. 6a,b). To determine the degree of variation of NL1 expression in cortical layer 2/3, we performed two-color fluorescence ISH of NL1 and GAPDH (Fig. 6c). Levels of endogenous NL1 mRNA expression show large cell-to-cell variation compared to GAPDH (Fig. 6c,d), resulting in a larger coefficient of variation (GAPDH and NL1: 26.1±1.6%, n=10 fields and 37.7±4.3%, n=10, p<0.05).
Figure 6.
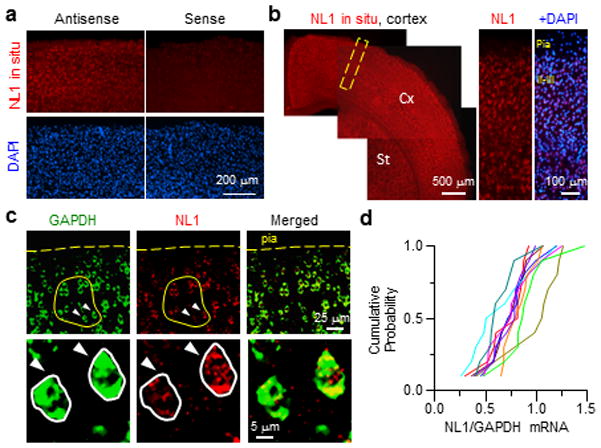
Variable NL1 mRNA in across cortical neurons
(a) Fluorescence ISH using an antisense Neuroligin-1 riboprobe (left) shows NL1 mRNA detection in the cortex compared to control ISH with a sense riboprobe (right).
(b) NL1 mRNA is expressed broadly (left, Cx: cortex, St: striatum). A high magnification image (right) of the cortex (dotted box) shows NL1 mRNA in all cortical layers.
(c) Double ISH shows GAPDH (left) and NL1 (middle) in individual layer 2/3 neurons (top). Representative images of neighboring neurons (arrowheads) showing differential NL1 mRNA expression in spite of relatively consistent GAPDH mRNA levels (bottom).
(d) Cumulative probability distribution of NL1/GAPDH ISH fluorescence ratios from 10 sets (1 per/section, 3 mice) of 10 randomly picked neighboring neurons (yellow circle in (c)).
Gradients of NL1 levels across cortical neurons regulate spine number
To directly test in vivo if transcellular gradients of NL1 expression level regulate synapse number, we examined a variety of conditions where NL1 expression is higher or lower in a cell few relative to neighbors (Supplementary Fig. 4). First, we examined whether spine density is regulated in a dose-dependent manner by NL1. We took advantage of a specific sh-NL1, sh-NL1#9, which partially reduced NL1 levels (Fig. 1a). When transfected into neurons of WT animals, sh-NL1#9 reduced spine density only slightly (0.7±0.03 spines/μm, 27 dendrites, p<0.05 vs. wildtype). In contrast a second very efficient shRNA, sh-NL1#4, greatly reduced spine density (0.4±0.04 spines/μm, 15 dendrites, p<0.05 vs. wildtype).
Second, if the magnitude of transcellular gradients in NL1 levels determines the density of excitatory synapses, then spine density in a sparse subset of neurons that over-express NL1 in NL1−/− mice should be higher than in neurons that over-express NL1 in wild-type mice. Indeed, spine density in hNL1 transfected neurons in NL1−/− mice was very high (Fig. 7a–c; 1.9±0.1 spines/μm, 10 neurons, 17 dendrites, p<0.05 vs. hNL1 in WT, 1.4±0.1 spines/μm, 11 neurons, 22 dendrites). Increased density of spines was accompanied by increased mEPSC frequency, indicating that more functional synapses had been made (Fig. 7a–c; hNL1 in NL1−/−, 3.67±0.35 Hz, n=8, p<0.05 vs. hNL1 in WT, 2.19±0.43 Hz, n=6).
Figure 7.
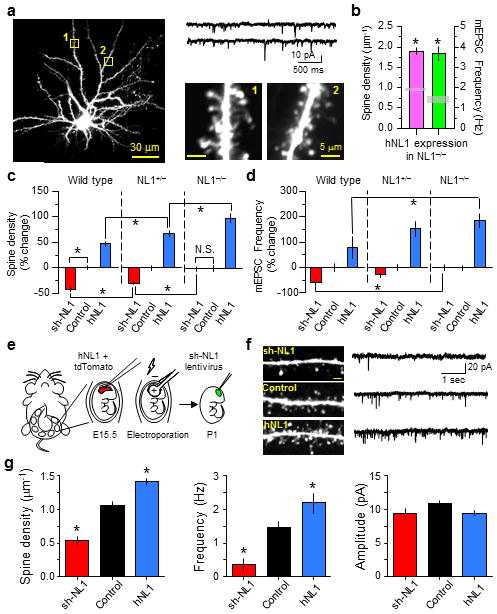
Relative levels of NL1 determine spine number in vivo via intercellular interactions
(a) Representative hNL1-transfected neuron in an NL1−/− mouse showing spines and mEPSCs.
(b) Average spine density and mEPSC frequency from hNL1-expressing neurons in NL1−/− mice. The gray boxes indicate the values in control neurons.
(c–d) Spine density and mEPSC frequency are differently affected by manipulating NL1 levels up (hNL1) or down (shNL1) depending the levels of NL1 in the surrounding neurons.
(e) Schematic of the experimental design. Mice were in utero electroporated with hNL1 + tdTomato, followed by injection of sh-NL1 encoding lentivirus into cortex at P1.
(f) Left, representative images of spines from layer 2/3 pyramidal neurons infected with sh-NL1 lentivirus (top), neighboring controls (middle), or electroporated with hNL1 + tdTomato (bottom). Right, representative mEPSCs for the same 3 neuronal classes. Scale bars, 2 μm, 2 pA and 1s.
(g) Average spine density, mEPSC frequency and amplitude in sh-NL1, control and hNL1 neurons analyzed in the same slices. Error bars: s.e.m. *: p<0.05 on post hoc multiple comparison tests relative to control.
Furthermore, across many manipulations the magnitude of changes in spine density and mEPSC frequency induced by manipulations of NL1 depend on the NL1 content of neighboring neurons. The effects of NL1 knock-down are reduced in the NL1+/− hemizygote mice and completely absent in NL1−/− mice (Fig. 7e,f; sh-NL1 in WT, NL1+/−, and NL1−/−: percent change in spine density: −42±6%, −30±3%, −1±5% compared to the matched background; percent change in mEPSC frequency: −58±12%, n=8, −27±12%, n=8, 1±11%, n=9). Conversely, the effects of overexpression of NL1 are more dramatic when NL1 levels are reduced in neighboring cells (Fig. 7e,f; hNL1 in WT, NL1+/−, and NL1−/−: percent change in spine density: 47±5%, 68±6%, 102±9% compared to the matched background; percent change in mEPSC frequency: 79±43%, n=6, 155±30%, n=10, 187±28%, n=8). The changes in spine density and synapse number seen with perturbation of NL1 levels are not due to variability in these parameters across animals, as they are observed when WT neurons, sh-NL1 expressing, and hNL1 overexpressing neurons in the same slice are compared (Fig. 7f,g) (spine density: sh-NL1, 0.53±0.06 spines/μm, n=12 neurons/22 dendrites; control, 1.06±0.05, n=9/15; hNL1, 1.40±0.05, n=8/19. mEPSC frequency: sh-NL1, 0.37 ± 0.17 Hz, n=5; control, 1.47±0.18, n=7; hNL1, 2.18±0.30, n=5 neurons. mEPSC amplitude: sh-NL1, 9.3±0.8 pA; control, 10.8±0.5; hNL1, 9.4±0.4 pA). Thus, spine density and mEPSC frequency in each cell are determined not by the cell’s absolute level of NL1 but the difference in its levels of NL1 relative to neighboring neurons.
DISCUSSION
The functions of NL1 in vivo in regulating synaptogenesis and the number of excitatory synapses per neuron have been controversial, with some studies concluding direct functions of NL1 in both processes and other studies proposing a later function of NL1 in activity-dependent synapse validation19, 27, 42. To resolve some of these controversies, we examined, in a variety of genetic contexts, synaptic and cellular properties of cortical layer 2/3 pyramidal neurons whose levels of NL1 had been altered. Furthermore, we compared the effects of sparse vs. global manipulations to determine if synapses are sensitive to the absolute levels of NL1 in an individual cell or to relative differences in NL1 compared to neighboring neurons.
Our data reveal that the defects in cellular development depend on the context in which NL1 is perturbed. Loss of NL1 in all cells, and in only a subset of cortical layer 2/3 neuron, equally alter the level of extra-synaptic and synaptic NMDARs, consistent with previous results 19, 24–26. However, when NL1 levels are decreased or increased in one cell relative to its neighbors, additional functions of NL1 in regulating activity-dependent spinogenesis and synapse number are revealed. Thus, neurons that have relatively high levels of NL1 grow new spines more readily, leading to increased spine density and functional synapse number. In contrast, neurons with relatively low levels of NL1 are deficient in the same parameters.
Regulation of synapse number, spine density, and synaptogenesis by transcellular gradients in NL1
NLs have been proposed to act in the initial stages of synapse formation to promote synaptogenesis27. This hypothesis was supported by the demonstration that the number of synapses or spine density decreased with reduction of NL and increased with enhanced expression19, 28–34. Recently, it was alternatively proposed that NLs function in synapse specification and validation such that synapses initially form in an NL-independent manner but their stabilization or maintenance require validation by NLs19. However, each hypothesis has been tested in different systems and supported differentially by in vitro and in vivo data. Furthermore, often the effects of NL1 on synapse number were seen following RNA-interference mediated knock-down, which is susceptible to difficult to exclude off-target effects43.
To directly examine the role of NL1 in vivo in synapse formation, we manipulated NL1 expression levels in either a subset of neurons or in all neurons and examined the effects on de novo activity-dependent spinogenesis and mature synapse number. All of our analyses are performed in cortical layer 2/3 pyramidal neurons. We conclude that relative differences in NL1 across neurons determine the potential for initial synapse formation, which likely underlies the changes in excitatory synapse density observed in more mature neurons. Importantly, we demonstrated that the effects of RNA-interference against NL1 are due specifically to loss of NL1 as they were prevented by co-expression of human NL1, recapitulated by several shRNA sequences, and, most importantly, not seen when the shRNA was expressed in NL1 KO mice. This last control should be considered the gold-standard for off-target effects in RNA-interference based studies.
Thus, in vivo analyses indicate that NL1 levels in one cell that are high relative to its neighbors put it at advantage in the process of synapse formation, resulting in higher density of excitatory synapses. These results were confirmed in vitro since cultured GFP-labeled NL1−/− layer 2/3 pyramidal neurons only display defects in spine density when mixed with NL+/+ neurons. The intercellular or intersynapse processes that determine spine number and growth may include competition for binding to presynaptic neurexins and displacement by NL1 of other neurexin binding partners such as LRRTMs (Leucine-rich repeat transmembrane neuronal proteins)44, 45.
Regulation of individual synapses by NL1
Our study also reveals that the absolute and relative levels of NL1 regulate individual synapses. Loss of NL1 in all contexts decreases NMDAR-evoked currents and calcium influx by ~50% and spine morphology is altered by sparse manipulation of NL1 (Supplementary Fig. 1), consistent with previous reports19, 29. These morphological changes are likely to have a functional impact, as spines with a large head and long neck trap signaling molecules for longer periods 46, 47. Indeed we found altered Ca2+ signaling in spines and dendrites of neurons with altered NL1 expression as well as perturbations of diffusion of activated fluorophores across the neck. This impacts the temporal and spatial profiles of signaling pathways involved in synaptic formation, maturation, and plasticity. For example, PKA is anchored in the dendrite at rest, but when activated the catalytic subunit moves into the spine and facilitates induction of long-term potentiation48, a process that may be hampered by narrow and long spine necks.
Conclusion
This study resolves previous conflicts in the literature by demonstrating that the effects of NL1 on synaptogenesis and synapse number are highly context dependent. Combined in vitro and in vivo results demonstrate that defects in synaptogenesis and synapse number are revealed in NL1 lacking neurons if neighboring neurons express NL1. Similarly, the degree of perturbation of synapse number is graded depending on the relative differences in NL1 across neurons.
EXPERIMENTAL PROCEDURES
Plasmids
Mouse neuroligin-1 tagged with GFP on its C-terminal end49 was a gift of Dr. Nils Brose in Max-Planck-Institute, Germany. Human NL1 cDNA was purchased from OriGene (Cat #. SC127261). Four different target sequences for shRNA directed against mouse NL1 (sh-NL1 #1~4) were designed using the online utilities of the Whitehead Institute for Biomedical Research. 19~21 bp coding, loop, and reverse complementary sequence nucleotides were synthesized (Integrated DNA Technologies) and ligated into pGUR, a vector that produces shRNA under an U6 promoter and EGFP under a CMV promoter50. Four additional sh-NL1 constructs (sh-NL1 #6~9) from Sigma were tested (Cat #. NM_138666). Western blot analysis showed that sh-NL1 #4 and #7 efficiently reduced NL1 levels. The nucleotide sequences for sh-NL1 #4 and #7 are:
sh-NL#4: GGGGGAAGGGTTGAAGTTTGTTTCAAGAGAACAAACTTCAACCCTTCCCCC CTTTTTG and AATTCAAAAAGGGGGGAAGGGTTGAAGTTTGTTCTCTTGAAACAAACTTCAA CCCTTCCCCC
sh-NL1 #7: GGGCAGACCTTCACTCGAACTTTCTCGAGAAAGTTCGAGTGAAGGTCTGCC CCTTTTTG and AATTCAAAAAGGGGCAGACCTTCACTCGAACTTTCTCGAGAAAGTTCGAGTG AAGGTCTGCCC
Cell culture, transfection and viral infection
For the experiments to validate the efficiency of sh-NL1, 1×10⁵ HEK293 cells were plated and 1 μg of NL1-GFP and 4 μg of sh-NL1. DNA was transfected using a Calcium phosphate transfection kit (Cat # 44-0052, Invitrogen). Cells were harvested two days later and the lysate was used for the Western blotting.
Organotypic hippocampal slice cultures were prepared from 7~8 day old Spraque Dawley rats51. The brain was taken out and immediately placed in chilled dissection media. Transverse hippocampal slices were chopped with 400~500 μm thickness and 4~6 slices were placed in a sterile culture plate insert (Millicell-CM, Millipore) in 6-well plates containing prewarmed media. DNA was biolistically transfected with a Helios Gene Gun (Biorad) 2 days after culturing. Bullets were made with 60 μg of DNA or, for the rescue experiments, 40 μg each of sh-NL1 and hNL1. For the viral infection experiments, dissociated hippocampal cultures were prepared from 1 day old rats. 1×10⁵ neurons were plated in poly-d-lysine coated 24-well plates. Two days later, 3 infectious units of viruses per cell were added to the culture media and cells were harvested at 7~8 days after infection. Lentiviruses expressing sh-NL1 and control virus were purchased from Sigma (MISSION Lentiviral Transduction Particles, for sh-NL1 #7: Cat # TRCN0000032021, for control: Cat #: SHC001V). Antibodies for Western blots were: Neuroligin-1, 2, and 3 from Synaptic Systems (Gottingen, Germany); GAPDH from Cell Signaling Technology.
In utero electroporation
All procedures for animal surgery and maintenance were performed following protocols approved by the Harvard Standing Committee on Animal Care and in accordance with National Institutes of Health guidelines. To target neocortical layer 2/3 pyramidal neurons, E15.5 timed-pregnant female C57BL/6 mice (Charles River, Massachusetts, United States) were deeply anesthetized by intraperitoneal injection of 2.5% Avertin (2, 2, 2-Tribromoethanol) or 2% isoflurane. Uterine horns were carefully exposed and 1~2 μl of DNA (1 μg/μl) were injected into one lateral ventricle. To visualize the injection, 0.005% fast green was mixed with the DNA. Glass micropipettes for the injection were pulled, the tip broken to be ~50 μm in diameter, and beveled at 18° (NARISHIGE, Japan). After injection, the embryo head was held with a tweezer with round plate electrodes (0.5 mm diameter) and electric pulses were delivered five times per second (50 V, 50 ms) (CUY21 electroporator, NEPA GENE, Japan). Warm PBS was dropped onto embryos periodically to prevent drying. The uterus was placed back into the pregnant mouse, and the anterior muscle and the skin were sutured separately. Pups were housed with the dam until they were needed. For the experiments shown in Fig. 7e–g, pups in utero electroporated with hNL1 and tdTomato were intracranially injected at post-natal day 1 with 250 nl of ~109 titer lentivirus encoding shNL1 and GFP (Sigma MISSION Lentiviral Transduction Particles TRCN0000032021-CMV-tGFP), using a protocol analogous to that described previously for adeno-associated viruses54.
In situ hybridization and image analysis
Double fluorescence in situ hybridization (ISH) was performed using a tyramide signal amplification method according to the manufacturer’s instructions (NEL753001KT, PerkinElmer). Briefly, brains of 1 month old mice were dissected and immediately frozen in liquid nitrogen. The brains were cut into 25 μm sections with a cryostat (Leica), postfixed in 4% PFA, acetylated in 1% triethanolamine and 0.25% acetic anhydride, prehybridized, and hybridized at 65°C using the following anti-sense probes: Nlgn1 (RP_050607_01_G08, Allen Institute for Brain Science), Gapdh (RP_050531_01_D11, Allen Institute for Brain Science), and EGFP (U55761, nt159-754). For in vitro transcription, NL1 cDNA was synthesized from Genscript and GAPDH cDNA was cloned out from a mouse cDNA library. Two fluorescein-or digoxigenin-labeled riboprobes generated by an in vitro transcription method (Promega) were hybridized simultaneously and stained by fluorescein or Cy3 chromogens, respectively. After staining, sections were mounted with Prolong Gold antifade reagent (P36934, Invitrogen). Images were collected by fluorescence microscopy using a Nikon Eclipse 80i microscope equipped with a Nikon DS-2 digital camera. For mRNA expression analysis, images were collected by confocal laser scanning microscopy using a Zeiss LSM 510 META and processed using Image J (National Institutes of Health). Images from wild-type brain sections were taken at 40X magnification and ten cells clustered in the layer 2/3 area were randomly selected per image for analysis. To quantify the NL1 and GAPDH mRNA expression level, areas with positive in situ signal for each gene in the same cell were measured using Image J and the coefficient of variation for NL1 and GAPDH mRNA levels were calculated from each image. The quantitative data from ten images were compiled and analyzed.
Spine analysis
Spine head area and length were analyzed using a MATLAB program described previously52. For each spine, one line was drawn along the length of spine (major axis) and the other line was drawn to cross the first line at the middle of spine head where the fluorescent intensity is maximum (minor axis). Head area was calculated by counting the number of pixels inside the area where fluorescent intensity remains to 30% of the maximal value. Spine length was designated as the distance to the point along the major axis where fluorescence dropped to 30% of the peak.
Acute slice preparation
C57BL/6 mice (17~25 days old) were deeply anesthetized with isoflurane and decapitated. The brain was rapidly removed and placed in chilled choline-based cutting solution containing (in mM) 25 NaHCO3, 1.25 NaH2PO4, 2.5 KCl, 7 MgCl2, 25 glucose, 1 CaCl2, 110 choline chloride, 11.6 ascorbic acid, and 3.1 pyruvic acid. Coronal sections of the brain were cut at 300μm thickness using a Leica VT1000S vibratome (Leica Instruments, Nussloch, Germany) in cold cutting solution. Slices were transferred to ACSF containing (in mM) 127 NaCl, 2.5 KCl, 25 NaHCO3, 1.25 NaH2PO4, 2 CaCl2, 1 MgCl2, and 25 glucose. Both cutting and ACSF solution were saturated with 95% O2 and 5% CO2 (pH 7.4). The slices were incubated at room temperature for at least 1 hour before recording.
Electrophysiology
A slice was transferred to a recording chamber perfused with ACSF. All voltage-clamp recordings were performed at room temperature, and current-clamp recordings at 32°C. For voltage-clamp recordings, the electrode was filled with an internal solution containing (in mM) 120 CsMeSO3, 8 NaCl, 15 CsCl2, 10 TEA·Cl, 10 HEPES, 2 QX-314, 4 MgATP, and 0.3 Na2GTP (pH 7.3). The pipette resistance was 3–4 MΩ. For current clamping recording, the patch electrode was filled with 120 KMeSO4, 5 KCl, 5 HEPES, 4 MgATP, and 0.3 Na2GTP, and 10 phosphocreatine (pH 7.3). Patch pipettes were pulled with a micropipette puller (P-97, Sutter instrument). Whole-cell recordings were made from cortical layer 2/3 pyramidal neurons. For Ca2+ imaging experiments, at least 10 minutes were allowed to pass after breaking the cell membrane before searching for a spine for analysis. For mEPSC recordings, cells were clamped at −60 mV in the presence of 10 μM CPP and 10 μM bicuculine. To measure AMPAR- and NMDAR-uEPSCs, uEPSCs were measured first at −60 mV and then at +40 mV. Glutamate uncaging-evoked EPSCs were measured in the presence of 10 μM d-serine, 1 μM TTX, 1 μM ω-conotoxin-MVIIC, 20 μM nimodipine, and 3 μM mibefradil. All recordings were made with a MultiClamp 700A (Axon Instruments Inc., Union City, CA, USA).
Two-photon microscope and uncaging
Uncaging of MNI-glutamate and Ca2+ imaging was achieved using a custom-built microscope combining two-photon laser-scanning microscopy (2PLSM) and two-photon laser photoactivation (2PLP) as previously described53. Two mode-locked Ti:Sapphire lasers (Chameleon, Coherent, Santa Clara, CA) were used for imaging and uncaging at wavelengths of 840 nm and 720 nm, respectively. Alexa-594 (20 μM) and Fluo-5F (300 μM) were loaded in the cell through the recording patch pipette. 5 mM MNI-glutamate was perfused in the recirculating bath and a 500 μs duration laser pulse at 720 nm was delivered to the target spot to release glutamate. Ca2+ transients shown in Figure 2, 3, and 4 are plotted in units of ΔG/Gsat which was calculated by dividing ΔG/R by Gsat/R. Gsat/R was measured in a 1:1 mixture of 1 M CaCl2 and internal solution, which saturates the Ca2+ indicator. At least five consecutive responses (AMPAR-, NMDAR-uEPSCs, and Ca2+ transients) were averaged from each spine. To deliver a constant stimulus to each spine, laser power was set to bleach red fluorescence in each spine head by ~40% 36.
Animals
B6;129 NL1+/− (heterozygous) mice were kindly provided from Dr. Nils Brose lab (Max-Planck-Institute, Germany). Genotyping was accomplished by PCR of genomic DNA from the mouse tail. The primers used for genotyping are:
428, GAGCGCGCGCGGCGGAGTTGTTGAC;
430, GTGAGCTGAATCTTATGGTTAGATGGG;
561, CGGTCAACAAACCTACTCAGAATCAGG. All data shown in Figure 1, 3 and 7 were obtained from NL1−/− and littermate control NL1+/+ resulting from heterozygous mating. Both male and female mice were used for the experiments.
Statistics
The Kolmogorov-Smirnov test was used to determine significance of differences in spine morphology. To determine significant differences of success rate of spinogenesis, Fisher’s exact test was used. For all other experiments, statistical significance was judged using a student t-test (two-sided) or one way analysis of variance followed by Newman-Keuls multiple comparison post hoc tests. P < 0.05 was judged as significant.
Supplementary Material
Supplementary Figure 1 Cumulative plots of spine head area and length
(a) Cumulative plots of spine head area and length from neurons transfected with the sh-NL1 #7 (sh-NL1), GFP (control), sh-NL1#7 and human NL1 (hNL1),
(b) Cumulative plots of spine head area and length from neurons of indicated genotypes.
Supplementary Figure 2 Postsynaptic expression of NL1 regulates spine morphology and density in CA1 pyramidal neurons in organotypic hippocampal slices
(a) Representative images of dendritic spines of hippocampal CA1 pyramidal neurons transfected with the sh-NL1, GFP (control), sh-NL1#7 and hNL1, or hNL1 alone. The areas indicated by the white boxes are shown at higher magnification below.
(b) Cumulative distributions of apparent spine head areas (left), lengths (middle), and average spine density (right) measured from hippocampal CA1 neurons transfected as in panel C. Error bars represent s.e.m.
Supplementary Figure 3 Relative Ca2+ accumulation in the dendrite is increased by hNL1 overexpression
(a) Glutamate was photoreleased near the spine head and the Ca2+ transient peaks from the spine head and neighboring dendrite shaft were measured as described in Figure 2. Measurements from individual spines are plotted as open circles. Note that dendritic Ca2+ increased more steeply than spine Ca2+ when hNL1 was transfected (rescued and hNL1 groups).
(b) Average ratios of Ca2+ transient amplitudes in the dendrite to that in the spine, showing increased relative dendritic Ca2+ in rescued and hNL1 transfected neurons. Error bars represent s.e.m.
Supplementary Figure 4 Schematics of absolute or relative regulation of synapse number by NL1 expression. In the top, cell-autonomous model, changes in the level of expression of NL1 (red tone) in the center cell influences its own synapse number independent of the NL1 levels in the surrounding neurons. In the bottom, transcellular model, the synapse number in the center cell is affected by the changes in NL1 levels of neighboring ells.
Supplementary Figure 5 Full images of western blots shown in the main figures. Bands within dashed line boxes were used in the main figures.
Acknowledgments
We thank members of the Sabatini lab for their constructive comments on the manuscript. We also thank Andrew Giessel, James Fitzhugh Sturgill, and Brenda Bloodgood for helping us with data analysis. We are grateful to Dr. Frederique Varoqueaux for providing mouse neuroligin-1 expression vector and NL1 heterozygous mice. This work was supported by a NIH grant R01NS064583 (to C.G.) and a SFARI grant from the Simons Foundation (to B.L.S.)
References
- 1.Katz LC, Shatz CJ. Synaptic activity and the construction of cortical circuits. Science. 1996;274:1133–8. doi: 10.1126/science.274.5290.1133. [DOI] [PubMed] [Google Scholar]
- 2.Sanes JR, Yamagata M. Many paths to synaptic specificity. Annu Rev Cell Dev Biol. 2009;25:161–95. doi: 10.1146/annurev.cellbio.24.110707.175402. [DOI] [PubMed] [Google Scholar]
- 3.Huberman AD, Feller MB, Chapman B. Mechanisms underlying development of visual maps and receptive fields. Annu Rev Neurosci. 2008;31:479–509. doi: 10.1146/annurev.neuro.31.060407.125533. [DOI] [PMC free article] [PubMed] [Google Scholar]
- 4.Moody WJ, Bosma MM. Ion channel development, spontaneous activity, and activity-dependent development in nerve and muscle cells. Physiol Rev. 2005;85:883–941. doi: 10.1152/physrev.00017.2004. [DOI] [PubMed] [Google Scholar]
- 5.Grutzendler J, Kasthuri N, Gan WB. Long-term dendritic spine stability in the adult cortex. Nature. 2002;420:812–6. doi: 10.1038/nature01276. [DOI] [PubMed] [Google Scholar]
- 6.Hofer SB, Mrsic-Flogel TD, Bonhoeffer T, Hubener M. Experience leaves a lasting structural trace in cortical circuits. Nature. 2009;457:313–7. doi: 10.1038/nature07487. [DOI] [PMC free article] [PubMed] [Google Scholar]
- 7.Trachtenberg JT, et al. Long-term in vivo imaging of experience-dependent synaptic plasticity in adult cortex. Nature. 2002;420:788–94. doi: 10.1038/nature01273. [DOI] [PubMed] [Google Scholar]
- 8.Alvarez VA, Sabatini BL. Anatomical and physiological plasticity of dendritic spines. Annu Rev Neurosci. 2007;30:79–97. doi: 10.1146/annurev.neuro.30.051606.094222. [DOI] [PubMed] [Google Scholar]
- 9.Dalva MB, McClelland AC, Kayser MS. Cell adhesion molecules: signalling functions at the synapse. Nat Rev Neurosci. 2007;8:206–20. doi: 10.1038/nrn2075. [DOI] [PMC free article] [PubMed] [Google Scholar]
- 10.Scheiffele P. Cell-cell signaling during synapse formation in the CNS. Annu Rev Neurosci. 2003;26:485–508. doi: 10.1146/annurev.neuro.26.043002.094940. [DOI] [PubMed] [Google Scholar]
- 11.Sudhof TC. Neuroligins and neurexins link synaptic function to cognitive disease. Nature. 2008;455:903–11. doi: 10.1038/nature07456. [DOI] [PMC free article] [PubMed] [Google Scholar]
- 12.Contractor A, et al. Trans-synaptic Eph receptor-ephrin signaling in hippocampal mossy fiber LTP. Science. 2002;296:1864–9. doi: 10.1126/science.1069081. [DOI] [PubMed] [Google Scholar]
- 13.Yamagata M, Sanes JR, Weiner JA. Synaptic adhesion molecules. Curr Opin Cell Biol. 2003;15:621–32. doi: 10.1016/s0955-0674(03)00107-8. [DOI] [PubMed] [Google Scholar]
- 14.Song JY, Ichtchenko K, Sudhof TC, Brose N. Neuroligin 1 is a postsynaptic cell-adhesion molecule of excitatory synapses. Proc Natl Acad Sci U S A. 1999;96:1100–5. doi: 10.1073/pnas.96.3.1100. [DOI] [PMC free article] [PubMed] [Google Scholar]
- 15.Varoqueaux F, et al. Neuroligins determine synapse maturation and function. Neuron. 2006;51:741–54. doi: 10.1016/j.neuron.2006.09.003. [DOI] [PubMed] [Google Scholar]
- 16.Ichtchenko K, et al. Neuroligin 1: a splice site-specific ligand for beta-neurexins. Cell. 1995;81:435–43. doi: 10.1016/0092-8674(95)90396-8. [DOI] [PubMed] [Google Scholar]
- 17.Ichtchenko K, Nguyen T, Sudhof TC. Structures, alternative splicing, and neurexin binding of multiple neuroligins. J Biol Chem. 1996;271:2676–82. doi: 10.1074/jbc.271.5.2676. [DOI] [PubMed] [Google Scholar]
- 18.Jamain S, et al. Reduced social interaction and ultrasonic communication in a mouse model of monogenic heritable autism. Proc Natl Acad Sci U S A. 2008;105:1710–5. doi: 10.1073/pnas.0711555105. [DOI] [PMC free article] [PubMed] [Google Scholar]
- 19.Chubykin AA, et al. Activity-dependent validation of excitatory versus inhibitory synapses by neuroligin-1 versus neuroligin-2. Neuron. 2007;54:919–31. doi: 10.1016/j.neuron.2007.05.029. [DOI] [PMC free article] [PubMed] [Google Scholar]
- 20.Poulopoulos A, et al. Neuroligin 2 drives postsynaptic assembly at perisomatic inhibitory synapses through gephyrin and collybistin. Neuron. 2009;63:628–42. doi: 10.1016/j.neuron.2009.08.023. [DOI] [PubMed] [Google Scholar]
- 21.Durand CM, et al. Mutations in the gene encoding the synaptic scaffolding protein SHANK3 are associated with autism spectrum disorders. Nat Genet. 2007;39:25–7. doi: 10.1038/ng1933. [DOI] [PMC free article] [PubMed] [Google Scholar]
- 22.Feng J, et al. High frequency of neurexin 1beta signal peptide structural variants in patients with autism. Neurosci Lett. 2006;409:10–3. doi: 10.1016/j.neulet.2006.08.017. [DOI] [PubMed] [Google Scholar]
- 23.Jamain S, et al. Mutations of the X-linked genes encoding neuroligins NLGN3 and NLGN4 are associated with autism. Nat Genet. 2003;34:27–9. doi: 10.1038/ng1136. [DOI] [PMC free article] [PubMed] [Google Scholar]
- 24.Blundell J, et al. Neuroligin-1 deletion results in impaired spatial memory and increased repetitive behavior. J Neurosci. 2010;30:2115–29. doi: 10.1523/JNEUROSCI.4517-09.2010. [DOI] [PMC free article] [PubMed] [Google Scholar]
- 25.Kim J, et al. Neuroligin-1 is required for normal expression of LTP and associative fear memory in the amygdala of adult animals. Proc Natl Acad Sci U S A. 2008;105:9087–92. doi: 10.1073/pnas.0803448105. [DOI] [PMC free article] [PubMed] [Google Scholar]
- 26.Soler-Llavina GJ, Fuccillo MV, Ko J, Sudhof TC, Malenka RC. The neurexin ligands, neuroligins and leucine-rich repeat transmembrane proteins, perform convergent and divergent synaptic functions in vivo. Proc Natl Acad Sci U S A. 2011;108:16502–9. doi: 10.1073/pnas.1114028108. [DOI] [PMC free article] [PubMed] [Google Scholar]
- 27.Scheiffele P, Fan J, Choih J, Fetter R, Serafini T. Neuroligin expressed in nonneuronal cells triggers presynaptic development in contacting axons. Cell. 2000;101:657–69. doi: 10.1016/s0092-8674(00)80877-6. [DOI] [PubMed] [Google Scholar]
- 28.Boucard AA, Chubykin AA, Comoletti D, Taylor P, Sudhof TC. A splice code for trans-synaptic cell adhesion mediated by binding of neuroligin 1 to alpha- and beta-neurexins. Neuron. 2005;48:229–36. doi: 10.1016/j.neuron.2005.08.026. [DOI] [PubMed] [Google Scholar]
- 29.Chih B, Engelman H, Scheiffele P. Control of excitatory and inhibitory synapse formation by neuroligins. Science. 2005;307:1324–8. doi: 10.1126/science.1107470. [DOI] [PubMed] [Google Scholar]
- 30.Dean C, et al. Neurexin mediates the assembly of presynaptic terminals. Nat Neurosci. 2003;6:708–16. doi: 10.1038/nn1074. [DOI] [PMC free article] [PubMed] [Google Scholar]
- 31.Graf ER, Zhang X, Jin SX, Linhoff MW, Craig AM. Neurexins induce differentiation of GABA and glutamate postsynaptic specializations via neuroligins. Cell. 2004;119:1013–26. doi: 10.1016/j.cell.2004.11.035. [DOI] [PMC free article] [PubMed] [Google Scholar]
- 32.Levinson JN, El-Husseini A. Building excitatory and inhibitory synapses: balancing neuroligin partnerships. Neuron. 2005;48:171–4. doi: 10.1016/j.neuron.2005.09.017. [DOI] [PubMed] [Google Scholar]
- 33.Nam CI, Chen L. Postsynaptic assembly induced by neurexin-neuroligin interaction and neurotransmitter. Proc Natl Acad Sci U S A. 2005;102:6137–42. doi: 10.1073/pnas.0502038102. [DOI] [PMC free article] [PubMed] [Google Scholar]
- 34.Prange O, Wong TP, Gerrow K, Wang YT, El-Husseini A. A balance between excitatory and inhibitory synapses is controlled by PSD-95 and neuroligin. Proc Natl Acad Sci U S A. 2004;101:13915–20. doi: 10.1073/pnas.0405939101. [DOI] [PMC free article] [PubMed] [Google Scholar]
- 35.Kwon HB, Sabatini BL. Glutamate induces de novo growth of functional spines in developing cortex. Nature. 2011;474:100–4. doi: 10.1038/nature09986. [DOI] [PMC free article] [PubMed] [Google Scholar]
- 36.Bloodgood BL, Sabatini BL. Nonlinear regulation of unitary synaptic signals by CaV(2.3) voltage-sensitive calcium channels located in dendritic spines. Neuron. 2007;53:249–60. doi: 10.1016/j.neuron.2006.12.017. [DOI] [PubMed] [Google Scholar]
- 37.Sabatini BL, Oertner TG, Svoboda K. The life cycle of Ca(2+) ions in dendritic spines. Neuron. 2002;33:439–52. doi: 10.1016/s0896-6273(02)00573-1. [DOI] [PubMed] [Google Scholar]
- 38.Barrow SL, et al. Neuroligin1: a cell adhesion molecule that recruits PSD-95 and NMDA receptors by distinct mechanisms during synaptogenesis. Neural Dev. 2009;4:17. doi: 10.1186/1749-8104-4-17. [DOI] [PMC free article] [PubMed] [Google Scholar]
- 39.Jung SY, et al. Input-specific synaptic plasticity in the amygdala is regulated by neuroligin-1 via postsynaptic NMDA receptors. Proc Natl Acad Sci U S A. 2010;107:4710–5. doi: 10.1073/pnas.1001084107. [DOI] [PMC free article] [PubMed] [Google Scholar]
- 40.Buffelli M, et al. Genetic evidence that relative synaptic efficacy biases the outcome of synaptic competition. Nature. 2003;424:430–4. doi: 10.1038/nature01844. [DOI] [PubMed] [Google Scholar]
- 41.McClelland AC, Hruska M, Coenen AJ, Henkemeyer M, Dalva MB. Trans-synaptic EphB2-ephrin-B3 interaction regulates excitatory synapse density by inhibition of postsynaptic MAPK signaling. Proc Natl Acad Sci U S A. 2010;107:8830–5. doi: 10.1073/pnas.0910644107. [DOI] [PMC free article] [PubMed] [Google Scholar]
- 42.Chubykin AA, et al. Dissection of synapse induction by neuroligins: effect of a neuroligin mutation associated with autism. J Biol Chem. 2005;280:22365–74. doi: 10.1074/jbc.M410723200. [DOI] [PubMed] [Google Scholar]
- 43.Alvarez VA, Ridenour DA, Sabatini BL. Retraction of synapses and dendritic spines induced by off-target effects of RNA interference. J Neurosci. 2006;26:7820–5. doi: 10.1523/JNEUROSCI.1957-06.2006. [DOI] [PMC free article] [PubMed] [Google Scholar]
- 44.de Wit J, et al. LRRTM2 interacts with Neurexin1 and regulates excitatory synapse formation. Neuron. 2009;64:799–806. doi: 10.1016/j.neuron.2009.12.019. [DOI] [PMC free article] [PubMed] [Google Scholar]
- 45.Ko J, Fuccillo MV, Malenka RC, Sudhof TC. LRRTM2 functions as a neurexin ligand in promoting excitatory synapse formation. Neuron. 2009;64:791–8. doi: 10.1016/j.neuron.2009.12.012. [DOI] [PMC free article] [PubMed] [Google Scholar]
- 46.Santamaria F, Wils S, De Schutter E, Augustine GJ. Anomalous diffusion in Purkinje cell dendrites caused by spines. Neuron. 2006;52:635–48. doi: 10.1016/j.neuron.2006.10.025. [DOI] [PMC free article] [PubMed] [Google Scholar]
- 47.Svoboda K, Tank DW, Denk W. Direct measurement of coupling between dendritic spines and shafts. Science. 1996;272:716–9. doi: 10.1126/science.272.5262.716. [DOI] [PubMed] [Google Scholar]
- 48.Zhong H, et al. Subcellular dynamics of type II PKA in neurons. Neuron. 2009;62:363–74. doi: 10.1016/j.neuron.2009.03.013. [DOI] [PMC free article] [PubMed] [Google Scholar]
- 49.Dresbach T, Neeb A, Meyer G, Gundelfinger ED, Brose N. Synaptic targeting of neuroligin is independent of neurexin and SAP90/PSD95 binding. Mol Cell Neurosci. 2004;27:227–35. doi: 10.1016/j.mcn.2004.06.013. [DOI] [PubMed] [Google Scholar]
- 50.Tavazoie SF, Alvarez VA, Ridenour DA, Kwiatkowski DJ, Sabatini BL. Regulation of neuronal morphology and function by the tumor suppressors Tsc1 and Tsc2. Nat Neurosci. 2005;8:1727–34. doi: 10.1038/nn1566. [DOI] [PubMed] [Google Scholar]
- 51.Stoppini L, Buchs PA, Muller D. A simple method for organotypic cultures of nervous tissue. J Neurosci Methods. 1991;37:173–82. doi: 10.1016/0165-0270(91)90128-m. [DOI] [PubMed] [Google Scholar]
- 52.Sturgill JF, Steiner P, Czervionke BL, Sabatini BL. Distinct domains within PSD-95 mediate synaptic incorporation, stabilization, and activity-dependent trafficking. J Neurosci. 2009;29:12845–54. doi: 10.1523/JNEUROSCI.1841-09.2009. [DOI] [PMC free article] [PubMed] [Google Scholar]
- 53.Carter AG, Sabatini BL. State-dependent calcium signaling in dendritic spines of striatal medium spiny neurons. Neuron. 2004;44:483–93. doi: 10.1016/j.neuron.2004.10.013. [DOI] [PubMed] [Google Scholar]
- 54.Kozorovitskiy Y, Saunders A, Johnson CA, Lowell BB, Sabatini BL. Nature. 2012;485:646–50. doi: 10.1038/nature11052. [DOI] [PMC free article] [PubMed] [Google Scholar]
Associated Data
This section collects any data citations, data availability statements, or supplementary materials included in this article.
Supplementary Materials
Supplementary Figure 1 Cumulative plots of spine head area and length
(a) Cumulative plots of spine head area and length from neurons transfected with the sh-NL1 #7 (sh-NL1), GFP (control), sh-NL1#7 and human NL1 (hNL1),
(b) Cumulative plots of spine head area and length from neurons of indicated genotypes.
Supplementary Figure 2 Postsynaptic expression of NL1 regulates spine morphology and density in CA1 pyramidal neurons in organotypic hippocampal slices
(a) Representative images of dendritic spines of hippocampal CA1 pyramidal neurons transfected with the sh-NL1, GFP (control), sh-NL1#7 and hNL1, or hNL1 alone. The areas indicated by the white boxes are shown at higher magnification below.
(b) Cumulative distributions of apparent spine head areas (left), lengths (middle), and average spine density (right) measured from hippocampal CA1 neurons transfected as in panel C. Error bars represent s.e.m.
Supplementary Figure 3 Relative Ca2+ accumulation in the dendrite is increased by hNL1 overexpression
(a) Glutamate was photoreleased near the spine head and the Ca2+ transient peaks from the spine head and neighboring dendrite shaft were measured as described in Figure 2. Measurements from individual spines are plotted as open circles. Note that dendritic Ca2+ increased more steeply than spine Ca2+ when hNL1 was transfected (rescued and hNL1 groups).
(b) Average ratios of Ca2+ transient amplitudes in the dendrite to that in the spine, showing increased relative dendritic Ca2+ in rescued and hNL1 transfected neurons. Error bars represent s.e.m.
Supplementary Figure 4 Schematics of absolute or relative regulation of synapse number by NL1 expression. In the top, cell-autonomous model, changes in the level of expression of NL1 (red tone) in the center cell influences its own synapse number independent of the NL1 levels in the surrounding neurons. In the bottom, transcellular model, the synapse number in the center cell is affected by the changes in NL1 levels of neighboring ells.
Supplementary Figure 5 Full images of western blots shown in the main figures. Bands within dashed line boxes were used in the main figures.