

Abstract
MDM2 is a ubiquitin ligase that is best known for its essential function in the negative regulation of p53. In addition, MDM2 expression is associated with tumor progression in a number of common cancers, and in some cases, this has been shown to be independent of p53 status. MDM2 has been shown to promote the degradation of a number of other proteins involved in the regulation of normal cell growth and proliferation, including MDM4 and RB1. Here, we describe the identification of a novel substrate for the MDM2 ubiquitin ligase: dihydrofolate reductase (DHFR). MDM2 binds directly to DHFR and catalyses its monoubiquitination and not its polyubiquitination. In addition, MDM2 expression reduces DHFR activity in a p53-independent manner, but has no effect upon the steady-state level of expression of DHFR. We show that changes in MDM2 expression alter folate metabolism in cells as evidenced by MDM2-dependent alteration in the sensitivity of cells to the antifolate drug methotrexate. Furthermore, we show that the ability of MDM2 to inhibit DHFR activity depends upon an intact MDM2 RING finger. Our studies provide for the first time a link between MDM2, an oncogene with a critical ubiquitin ligase activity and a vital one-carbon donor pathway involved in epigenetic regulation, and DNA metabolism, which has wide ranging implications for both cell biology and tumor development.
Introduction
The MDM2 gene was originally identified as one of three genes found to be amplified in tumorigenic mouse cells derived from the NIH3T3 cell line (see ref. 1 for review of MDM2). Subsequent studies showed that increased expression of the MDM2 gene conferred oncogenicity upon these cells. The oncogenic consequences of up-regulation of MDM2 have since been extensively documented. MDM2 interacts with p53, and there is compelling evidence from a broad range of experimental systems and from clinical studies that a major target of MDM2 oncogenic activity is focused upon the p53 tumor suppressor protein. For example, up-regulation of MDM2 often results from gene amplification and studies of soft tissue sarcomas have found that tumors that display MDM2 gene amplification rarely harbor p53 mutations. Studies in cultured cells have shown that p53 levels and activity are regulated by MDM2, and it is increasingly clear that this is substantially due to the ability of MDM2 to act as a ubiquitin ligase with specificity for, inter alia, p53. MDM2 targets p53 for ubiquitination, leading to export of p53 from the nucleus and/or degradation by proteasomes. MDM2 has also been shown to inhibit p53 directly via binding the p53 transactivation domain and indirectly, for example, by regulating histone acetyl transferases, which acetylate both histones and p53. Nevertheless, there is also considerable evidence that MDM2 can exert effects on cells that are independent of p53 and, moreover, that some of these effects are also oncogenic (reviewed in ref. 2).
Examples of evidence for these p53-independent oncogenic effects include studies in NIH3T3 cells, in which it has been shown that naturally occurring splice variants of MDM2 that lack the ability to bind to p53 retain transforming activity (3). Further support comes from studies of transgenic mice. Mice transgenic for an MDM2 gene expressed from a β-lactoglobulin promoter exhibited abnormal mammary development, with cells becoming polyploid, with a multinucleate morphology suggestive of DNA synthesis in the absence of mitosis (4). Similar results were obtained in both p53 wild-type animals and in animals with homozygous deletion of p53. Studies using a different transgenic system to generate mice that overexpress MDM2 from the MDM2 promoter have shown that these animals develop a different spectrum of tumors versus p53 null mice (5). This effect of MDM2 overexpression was similar in mice with wild-type or deleted p53. MDM2 expression has also been shown to abrogate the growth inhibitory activities of transforming growth factor-β1 in a p53-independent manner in cells in culture (6, 7).
Not only is up-regulation of MDM2 capable of having p53-independent oncogenic effects, but up-regulation of MDM2, regardless of p53 status, has been shown to be a significant factor in a range of common cancers. Increased MDM2 expression has been found to be associated with poor outcome in studies of prostate, bladder, esophageal, and renal cancers (8-11). Up-regulation of MDM2 frequently occurs in combination with high levels of p53. Such coexpression of p53 and MDM2 cannot be simply explained by our current understanding of the mechanisms underlying the regulation of p53 or MDM2 levels in cancer cells. Further complicating this picture, there are tumor specific differences to bear in mind, such as the strong positive association between MDM2 and p53 expression seen in renal cancer that is absent in bladder (8, 10). Taken together, these results are compatible with overexpression of MDM2, acting to promote cancer not only by regulating p53, but also by acting upon additional pathways.
Most of the activities of MDM2 have been ascribed to protein-protein interactions (for a recent summary, see the excellent review on p53 regulation; ref. 12), although there is evidence that MDM2 also interacts with RNAs (13). To try to define the p53-independent activities of MDM2, we have therefore sought to identify proteins that interact with MDM2. To accomplish this, we developed a system that uses affinity chromatography of proteins that interact with immobilized recombinant MDM2 protein to purify MDM2 interacting proteins from human cells in culture, which are then identified by mass spectrometry (MS). Using this strategy, we have identified the enzyme dihydrofolate reductase (DHFR; EC 1.5.1.3) as a novel MDM2 binding protein, and this finding has been confirmed in a yeast two-hybrid screen, similar to those we have used previously (14, 15). We have discovered that, as a consequence of this interaction, altering MDM2 expression has effects upon DHFR activity in cultured cells and that MDM2 can modify DHFR in vitro. Our results show that MDM2 catalyses monoubiquitination of DHFR and that MDM2 alters DHFR activity in cells in a RING finger–dependent manner. Thus, increased expression of MDM2, which occurs frequently in a range of cancers, may have consequences not only for folate antagonism, which is of importance in cancer treatment, but also, and perhaps, more significantly for folate metabolism, which is intimately connected with the methylation of nucleic acids and protein, as well as DNA metabolism.
Materials and Methods
Plasmids and antibodies
The human MDM2 expression plasmid hMDM2:pCMVneobam and the human RING finger mutant Cys464A-la:pCMVneobam3 were kind gifts from B. Vogelstein and D. Xirodimas, respectively. The human DHFR cDNA was excised from pGem7Zf hDHFR plasmid (a kind gift from N. Tai) and inserted into the pFlagCMV vector (Sigma-Aldrich) using BamHI and ClaI restriction endonucleases. The control plasmid for the in vitro binding assay, pTBc601c containing the apical domain of Mycobacterium tubeculosis Cpn60.1 was a kind gift from P. Tormay. For in vitro binding assays, the p53 cDNA expression vector was constructed by excising a BamHI and XhoI fragment from pCEP4-p53 (16) and subcloning this into the BamHI and SalI sites of pQE31 (Qiagen). The DHFR cDNA (murine) was expressed from pQE40 (Qiagen). MDM2 (murine) was in vitro translated from pBBV-MDM2 essentially as we have previously (15). For yeast two-hybrid assays, the pGADT7-Rec-LargeT AD control vector was constructed by homologous recombination in yeast according to the manufacturer’s instructions for the Matchmaker III system (Clontech). The pGAD-DHFR AD vector was constructed by cutting out the DHFR cDNA from pFLAG-CMV-6b described above using EcoRV and ClaI restriction endonucleases, and this was then ligated into the ClaI and blunt NdeI sites of pGADT7-AD. pGBKT7-MDM2 was prepared by subcloning a blunt ended NcoI fragment from pBlueBac-His2 (Invitrogen) into the blunted SalI site of pGBKT7. For in vitro ubiquitination assays, the glutathione S-transferase (GST)–MDM2 expression vector was constructed by excising a BamHI fragment from hMDM2:pCMVneobam and subcloning this into pGEX2TK (Amersham Pharmacia Biotech). The mouse monoclonal antibody for MDM2, (SMP-14), monoclonal antibody for β-actin (C-2), goat polyclonal antibody E-18, rabbit polyclonal Fl-187 for DHFR, and rabbit polyclonal antibody for S-probe (K-14) were purchased from Santa Cruz Biotechnology. The mouse monoclonal antibody for the FLAG epitope (M2) was obtained from Sigma-Aldrich. The rabbit polyclonal for DHFR (ab49880) was obtained from Abcam. The mouse monoclonal antibodies for MDM2 (IF2) and β-galactosidase (Ab-1) were purchased from Oncogene. The mouse monoclonal for the HA tag (16B12) was obtained from Covance Research Products. The anti-CD20 (Leu16) antibody was purchased from Becton Dickinson. Secondary antibodies used were antimouse used at a dilution of 1:2,500, antirabbit used at a dilution of 1:5,000 (both from Amersham Pharmacia Biotech), and antigoat used at 1:20,000 dilution (Jackson Immunochemicals).
Cell culture and transfection
H1299 (p53 null, non–small cell lung carcinoma) and H1299-9 (overexpressing MDM2) were maintained in RPMI 1640 supplemented with 10% FCS. MCF-7 and HEK 293 cells were maintained in DMEM HEPES modification supplemented with 10% FCS and 2 mmol/L l-glutamine (Sigma-Aldrich).
Cells were routinely transfected using Genejuice (Novagen) at 3 μL/μg of DNA with empty vectors added to ensure equal DNA content in transfections. In some experiments, Lipofectamine 2000 (Invitrogen) was used instead as a delivery agent at 2.5 μL/μg of DNA. When indicated, MG115 (10 μmol/L) was added 3 h before harvesting. Small interfering RNA (siRNA) was delivered to cells using Lipofectamine 2000 according to the manufacturer’s instructions: siRNAs (Dharmacon) for MDM2; MDM2#1 (5′GCCACAAAUCUGAUAGUA), MDM2#2 (Smartpool, L003279), p53 (5′GCAUGAACCGGAGGCCCA), scrambled siRNA (5′GGACGCAUCCUUCUUAAU), nontarget siRNA (D001810-01), RISC-free siRNA#1 (D001220-01).
The response of H1299 and H1299-9 cells to methotrexate was determined by seeding the cells at 15% confluency and then treating with either carrier (3 μmol/L NaOH) or 30 nmol/L methotrexate in carrier 24 h later. Cells were harvested every 24 h and counted using a Beckman Coulter Z2 counter.
Preparation of columns
We used an Amersham Biosciences AKTAPrime fast protein liquid chromatography with a 1-mL HiTrap chelating column at a flow rate of 0.5 mL/min maintained at 4°C. His6-rMDM2 was prepared as described previously (15), except that it was purified using a HiTrap chelating column eluted into buffer E [8 mol/L urea, 0.1 mol/L NaH2PO4, 0.01mol/L Tris-HCl (pH 4.5)], and pH was then adjusted to 9.0 for use. The column used for isolating MDM2 interacting proteins was primed by adding 5 mL of 100 μmol/L NiSO4, and the excess was removed by washing with 10 column volumes (CV) of SLIP buffer [50 mmol/L HEPES (pH 7.5), 10% glycerol, 0.1% Triton-X100, 150 mmol/L NaCl]. His6-rMDM2 (0.5 mg/mL) in 10 mL SLIP buffer was then applied to the column by continuous recirculation for 16 h. The column was washed with 20 CV SLIP buffer and blocked with 1 mg/mL bovine serum albumin (BSA) in 12 mL SLIP buffer for 16 h before application of 15 mg of filtered HEK 293 cell cleared lysate also for 16 h. The column was washed with 50 CVs SLIP buffer and exposed to a 0 to 1mol/L imidazole gradient, and the eluate was collected in 3-mL fractions. A control column was set up using BSA as both binding and blocking agent. Column samples were matched for imidazole concentration, and protein sample buffer [final concentration, 50 mmol/L Tris-HCl (pH 6.8), 2% SDS, 10% glycerol, 0.25% β-mercaptoethanol, bromophenol blue (1 mg/mL)] was added before analysis by Western blotting and/or mass spectroscopy.
Mass spectroscopy
Eluted proteins from MDM2 column fractions 5 and 6 were separated by SDS-PAGE and stained using brilliant blue G colloidal stain. Protein bands were excised, the band was chopped into small pieces, and manual in-gel tryptic digests were performed as described elsewhere (17). The tryptic digest was delivered into a QSTAR Pulsar i hybrid mass spectrometer (Applied Biosystems) by automated in-line RP-LC (integrated LC Packings System, 5 mm C18 μ-precolumn cartridge, and 75 μm × 15 cm C18 column, Dionex) via a nanoelectrospray source head and a 10-μm id PicoTip (New Objective). A gradient from 5% acetonitrile:0.05% trifluoroacetic acid v/v to 48% ACN:0.05% trifluoroacetic acid v/v in 60 min was applied at a rate of 200 nL/min, and MS and MS/MS spectra were acquired for 3 s in positive ion mode using information-dependent acquisition (Analyst software, Applied Biosystems). Data was submitted to MASCOT, and the National Center for Biotechnology Information database was searched with the MS tolerance set at 1.2 Da and the MS/MS tolerance at 0.6 Da with no modifications allowed.
Western blot analysis
Column fractions were analyzed as follows: samples in 1× protein sample buffer were separated by SDS-PAGE and transferred to Hybond enhanced chemiluminescence nitrocellulose membrane. Membranes were blocked in PBS-Tween 20 (0.1% v/v) containing nonfat dry milk (5% w/v) for 1 h at room temperature before incubation with primary antibodies (3 μg/mL). Membranes were washed thrice for 15 min in PBS-Tween 20 before addition of horseradish peroxidase–conjugated secondary antibodies for 1 h at room temperature. Membranes were washed as before, and the signal was detected by chemiluminescence and recorded using a Kodak IM4000 image station or autoradiography.
Cell pellets were lysed in SLIP buffer in the presence of the following protease inhibitors: aprotinin (2 μg/mL), leupeptin (0.5 μg/mL), pepstatin A(1 μg/mL), soybean trypsin inhibitor (100 μg/mL), and phenylmethylsulfonyl fluoride (1 mmol/L). After 10-min incubation on ice, lysates were centrifuged at 20,000 × g, and protein concentrations in the supernatant were determined using Bradford reagent. Typically, 50 μg samples were analyzed.
In vitro binding assay
To produce recombinant His-tagged proteins, we used essentially the same procedure we have previously (15). His-tagged protein/NTA agarose (Qiagen) bead complex (20 μL) was diluted into 1 mL of Dignam buffer plus imidazole [20 mmol/L HEPES (pH 7.9), 0.1mol/L KCl, 20% glycerol, 0.5 mmol/L DTT], with 50 mmol/L imidazole plus protease inhibitors, and 10 μL of in vitro translated protein were added and incubated at 25°C for 3 h. The beads were washed five times in 1 mL of Dignam buffer plus imidazole, resuspended in 30 μL 1× protein sample buffer, and analyzed by SDS-PAGE and fluorography.
Yeast two-hybrid screening
Yeast two-hybrid screening was performed essentially as recommended for the Matchmaker III system (Clontech). All pGAD vectors used were transformed into AH109, and all pGBKT7 strains were transformed into Y187 so that combinations could be generated through mating.
Immunopreciptiation
Clarified cellular lysate was precleared by incubating with protein G–Sepharose beads for 1 h at 4°C. Precleared supernatants were then incubated with either 2 μg anti-MDM2 N20, 2 μg anti-Flag M2, or with the same amount of anti–β-actin or anti-CD20 (Leu16), respectively, for 1 h at 4°C. After this, lysates were incubated with protein G–Sepharose beads for 2 h at 4°C, and the bead pellets were washed extensively in SLIP buffer and resuspended in 1× protein sample buffer before analysis by Western blotting.
DHFR activity assay
Cells were harvested by trypsinization, and DHFR activity was measured using the DHFR assay kit (Sigma-Aldrich) as per the manufacturer’s instructions. Typically, 400 μg of total protein were assayed for DHFR activity using a Biochrom Libra S32 spectrophotometer measuring the decrease in absorbance at 340 nm every 15 s over 8 min.
Flow cytometry
Apoptosis was determined by flow cytometry using an Annexin V FITC apoptosis detection kit (Sigma-Aldrich) according to the manufacturer’s instructions. Samples were analyzed using a Beckman Coulter Epics XL flow cytometer using FL1 (FITC) and FL2 (propidium iodide) channels. Data were analyzed using WIN MDI software (Windows multiple document interface for flow cytometry; Scripps Research Institute).
Ubiquitination assay
Ubiquitination reactions (18) were performed in a 100-μL reaction volume containing 50 mmol/L Tris-HCL (pH 7.5), 0.5 mmol/L MgCl2, 2 mmol/L ATP, 2 mmol/L DTT, 20 μmol/L ZnCl2, 100 ng E1, 400 ng UbcH5B, and 10 μg ubiquitin (proteins from Boston Biochem) to which 200 ng GST-MDM2 or GST were added. GST and GST-MDM2 proteins were purified from Escherichia coli using reduced glutathione sepharose 4B beads and eluted into SLIP buffer containing 20 mmol/L glutathione essentially as described by the manufacturers (Amersham). Recombinant DHFR (Sigma) was dialyzed into SLIP buffer before addition to the reaction. Reactions were performed with freshly prepared GST-MDM2 or GST at 30°C overnight, and proteins were subsequently analyzed by Western blotting as described.
Results
DHFR is an MDM2 binding protein
To identify MDM2 interacting proteins, we have expressed His6-tagged recombinant human MDM2 (His6-rMDM2) in E. coli and then used the purified protein to generate a column for affinity chromatography. HEK 293 cells were selected for this study as not being derived from a tumor, and possessing wild-type p53, they are relatively normal immortal cells. His6-rMDM2 was applied to a nickel-charged column and washed extensively, and a clarified HEK 293 cell lysate was then passed over the column. The column was washed extensively to remove low affinity/nonspecifically associated/retained proteins. Proteins bound to MDM2 were then eluted with an imidazole gradient, resolved by SDS-PAGE, and visualized by staining with brilliant blue G colloidal protein stain. In Fig. 1A, the majority of MDM2 elutes in fractions corresponding to 168 to 252 mmol/L imidazole. There is relatively little protein detectable in this region of the control column fractions (compare Fig. 1A with B) and no detectable MDM2 in the equivalent fractions. Selected prominent bands obtained from fractions 5 and 6 from the MDM2 column were excised and subjected to nano-LC-ESI (electrospray ionization)-MS/MS analysis, and as indicated in Fig. 1C, one of these bands was identified as DHFR (EC 1.5.1.3 gi:47939629, REFSEQ gi:4503323, Mascot: MOWSE score 120, 18% peptide coverage and ProteinPilot, 8 peptides 55.6% coverage). Having obtained identification for DHFR, we subsequently performed Western blot analysis of column fractions from the MDM2 and control columns with an antibody for DHFR, and in Fig. 1A, we found that DHFR coelutes with MDM2 in fractions containing up to 210 to 252 mmol/L imidazole (see also Supplementary Fig. S1, which shows the results with two additional DHFR antibodies). There is no detectable MDM2 or DHFR in the equivalent fractions on the BSA control column (see Fig. 1B and Supplementary Fig. 1). From Fig. 1A, it is apparent that MDM2 is equally abundant in fractions 5 and 6, whereas DHFR is most abundant in fraction 6. These differences between the elution profiles of DHFR and MDM2 may reflect the presence of differing levels of MDM2 containing complexes in these fractions. This notion accords with data presented in Supplementary Fig. S2, wherein we have probed these fractions for a subset of known MDM2 binding proteins. We have found that p53 and MTBP are present predominantly in fraction 6, gankyrin and pRb are present predominantly in fraction 5, whereas MDMX is detected equally in both fractions 5 and 6. To determine whether the interaction between MDM2 and DHFR was the result of direct protein-protein interaction, we performed an in vitro binding assay similar to ones we have previously described (14, 15) using recombinant test protein mixed with in vitro translated MDM2. In Fig. 2A, recombinant DHFR binds to MDM2 to a comparable extent to recombinant p53 under these conditions, whereas an irrelevant peptide from Cpn60 does not bind to MDM2. Thus, we conclude that MDM2 and DHFR can interact directly. We have also found that the interaction between MDM2 and DHFR can be shown using a yeast two-hybrid screen. Figure 2B shows yeast growth and β-galactosidase reporter activity on quadruple dropout plates for both DHFR and MDM2 with empty vector–transfected yeast controls and, for comparison, SV40 large T and murine p53. This heterologous system provides further support for the direct nature of this interaction. Next, we performed immunoprecipitations to determine whether we could detect the presence of MDM2 and DHFR in a complex in cells. H1299 cells were transfected with MDM2 and/or DHFR (Flag tagged), and as illustrated in Fig. 2C, MDM2 protein was precipitated when an anti-Flag antibody was used for immunoprecipitation in a Flag-DHFR–dependent manner. Note that the level of MDM2 is much higher in cells transfected with MDM2; hence, the absence on this short exposure of an endogenous MDM2 band in cells only transfected with DHFR and immunoprecipitated with an antibody for MDM2. To further investigate the presence of a protein complex containing endogenous MDM2 and DHFR, we performed similar experiments in untransfected HEK 293 cells. Figure 2D shows that MDM2 can be detected after immunoprecipitation with a DHFR antibody (bottom) and the interaction is also detectable after the reciprocal experiment (note that there is 10 times as much DHFR precipitate loaded versus the MDM2 precipitation on the bottom), and thus, <10% of the MDM2 precipitated with an MDM2 antibody coprecipitated with DHFR. Because only a very small proportion of the DHFR present is precipitated with the available antibodies (we have tested four; data not shown), it is noteworthy that a considerable proportion of this is associated with MDM2. Thus, these studies show that MDM2 and DHFR can be coimmunoprecipitated and can exist in a complex in cells.
Figure 1.
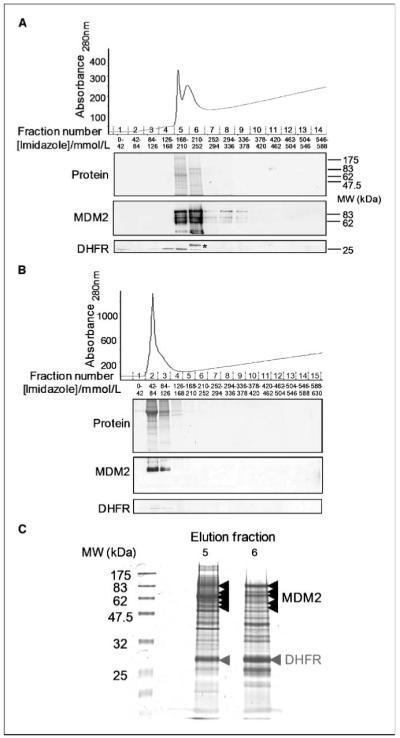
Identification of DHFR as an MDM2 interacting protein. A, elution profile from an MDM2 column. Fifteen milligrams of an HEK 293 clarified cell lysate were passed over a column coated with 4 mg of recombinant His6-MDM2. After extensive washing to remove nonspecific proteins in a 10 mmol/L imidazole buffer, the MDM2 (and interacting proteins) was removed from the column with an increasing concentration of imidazole. Eluted fractions were resolved by SDS-PAGE and analyzed for total protein by staining with brilliant blue G colloidal stain and for MDM2 (and subsequently DHFR) by immunoblotting with IF2 and E-18, respectively. The main DHFR band detected by immunoblotting is indicated with an asterisk (this identification is based upon comparisons between three different DHFR antibodies; see Supplementary Fig. S1 and additional data not shown). B, as for A, except that 10 mg of BSA were applied to a column instead of recombinant MDM2 and an HEK 293 lysate was applied and analyzed essentially as before. C, SDS-PAGE analysis of fractions 5 and 6 from the column in A, stained with brilliant blue G colloidal. Arrows, position of bands identified as MDM2 and DHFR subsequently by mass spectroscopy.
Figure 2.

DHFR binds directly to MDM2 in vitro and coimmunoprecipitates with MDM2. A, top, in vitro binding assay showing that DHFR binds to MDM2 to a comparable extent to p53. ADCpn60.1 is used as a specificity control. Bottom, coomassie staining of the input proteins analyzed by SDS-PAGE. B, yeast two-hybrid screen shows that DHFR interacts with MDM2 in this system. Histogram shows the results of quantitation of the interaction compared with the interaction between mated yeast strains expressing T + p53 (large T antigen from SV40 and murine p53), DHFR, and MDM2 or mated yeast alone (AH109 + Y187). One unit of β-galactosidase hydrolyses 1 μmol of ONPG to o-nitrophenol and d-galactose per minute per cell. Columns, mean of three independent colonies from a single typical experiment; bars, SE. C, immunoblot with anti-MDM2 antibody (IF2) from H1299 cell lysates transfected with the indicated plasmids and immunoprecipitated as follows: MDM2 (SMP-14), isotype control (Leu16), and Flag (M2). H1299 cells grown in a 10-cm dish were transfected with 10 μg each of plasmids expressing MDM2 and/or Flag-DHFR. At 24 h later, cells were harvested and 4 mg of clarified lysates were subjected to immunoprecipitation with the indicated antibodies. Cell lysate (50 μg) is shown as a loading reference. D, immunoblot with the indicated antibody, IF2 for MDM2 and E-18 for DHFR, of immunoprecipitates from 8 mg of HEK 293 cell lysate resolved by SDS-PAGE and Western blotted. Antibodies for immunoprecipitation were SMP-14 for MDM2, 16B12 for isotype control, Fl187 for DHFR, and K14 for specificity control. Bottom, only 5 μg of HEK 293 lysate and 1/10th of the immunoprecipitate for MDM2 and the isotype control were loaded; top, 50 μg lysate were loaded. Experiments have been repeated at least thrice, and the results shown are from a single typical experiment.
MDM2 reduces the activity of DHFR
MDM2 possesses ubiquitin ligase activity, and ubiquitination has been shown to be involved in both the regulation of protein stability and the posttranslational regulation of protein function. Because MDM2 has been shown to regulate the turnover of p53, MDM4, Numb, β2 arrestin, and RB1 (19-24), we first investigated whether MDM2 might regulate the stability of DHFR. However, in Fig. 3A and B, we have found no evidence for this in either plasmid transfection or siRNA knockdown experiments in a range of cell lines. Thus, we conclude that MDM2 does not regulate the stability of DHFR.
Figure 3.
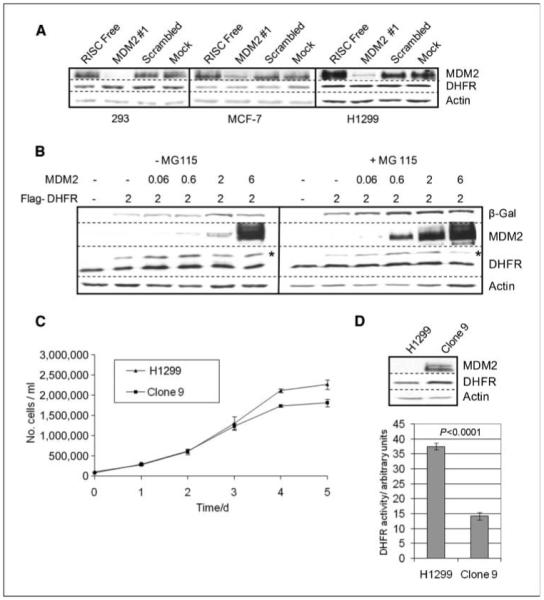
MDM2 does not alter the level of DHFR, but cells with stably overexpressed MDM2 have lower DHFR activity. A, SDS-PAGE and immunoblot analysis of the indicated cell lines transfected with the indicated siRNA molecules. B, H1299 cells were transfected with the indicated plasmids (*, band corresponding to the slower migrating Flag-tagged DHFR) and were either treated with MG115 or mock-treated with diluent to inhibit proteasomal activity. C, H1299 cells and a derivative line that stably expresses high levels of MDM2 (H1299-clone 9) display similar growth characteristics (in the experiment shown, six independent cultures of each cell line were measured; n = 6). D, bottom, spectrophotometric DHFR assay of H1299 and H1299-clone 9 cell lysates. Statistical analysis by Student’s t test, n = 4 (four independent cultures were analyzed for each cell line). Top, levels of the indicated proteins detected by immunoblotting. Columns, mean; bars, SE. The experiments have been repeated on at least three occasions, and the results presented are from a single typical experiment.
We next investigated whether MDM2 could alter the activity of DHFR in cells. To examine this in the absence of potentially confounding effects of p53, we selected a p53 null human cell line (H1299) for these studies. We were fortunate to have previously obtained a derivative of these cells (H1299-clone 9) that stably expresses high levels of MDM2, but which exhibits similar growth characteristics (see Fig. 3C), and thus, we were able to compare the effect of stable expression of MDM2 in isogenic cells. Figure 3D shows that the clone 9 cells expressing higher levels of MDM2 clearly have lower levels of DHFR activity. Note, however, that, in accordance with our results shown in Fig. 3A and B, these cells have comparable steady-state levels of DHFR protein. Our results suggest that increased levels of MDM2 can alter DHFR activity in cells in a p53-independent manner. To examine this further, we used transfection of siRNA for MDM2 to reduce MDM2 levels in cells, so that we could measure the effect of these changes upon DHFR activity. Using siRNA, we could significantly reduce the level of endogenous MDM2 with either a single siRNA (#1) or with a pool of unrelated siRNAs (#2), and concomitantly, we observed a significant increase in DHFR activity as in Fig. 4A. No effect was observed when either a scrambled siRNA (matched to MDM2 siRNA#1) or an siRNA for p53 was used. We also examined another cell line, MCF-7, that harbors wild-type p53, and although we cannot rule out an indirect effect of MDM2 mediated through p53 in these cells, we observed similar effects of MDM2 knockdown upon DHFR activity to those we had observed in p53 null cells, as in Fig. 4C. Taken together, these results show that MDM2 inhibits cellular DHFR activity in a p53-independent manner.
Figure 4.
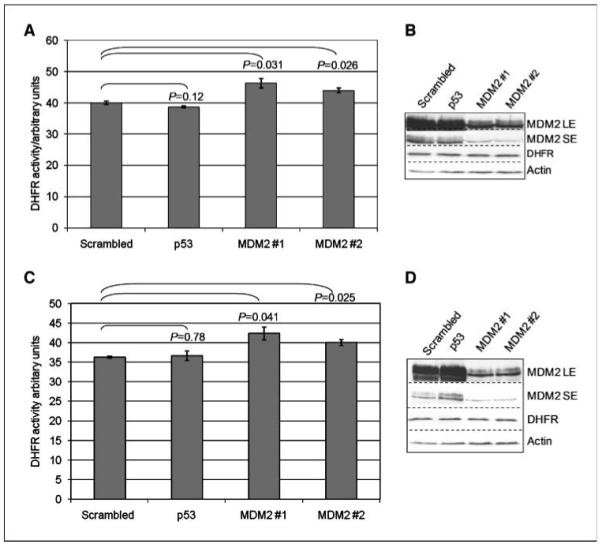
MDM2 expression reduces DHFR activity. A, H1299 cells were transfected with the indicated siRNA, and cell lysates were assayed for DHFR activity. B, immunoblot analysis of the lysates used in A. C, MCF-7 cells were transfected with the indicated siRNA, and the resulting cell lysates were assayed for DHFR activity. D, immunoblot analysis of the lysates used in C. Columns, mean; bars, SE. Statistical analysis by Student’s t test; n = 3. Three independent cultures were measured for each condition. The experiments have been repeated on at least three occasions, and the results presented are from a single typical experiment.
MDM2 expression alters cellular sensitivity to the antifolate drug methotrexate
Because DHFR catalyses the regeneration of tetrahydrofolate as a one-carbon donor for thymidine synthesis, it is an important drug target, and several specific drugs have been developed to inhibit DHFR activity, not least of which is the original antifolate drug methotrexate (reviewed in ref. 25). Antifolates continue to be used as part of treatment regimens for a range of cancers. Indeed, newer compounds have been shown to be useful therapies for patients with previously poor responses to this class of agents, such as those with non–small cell lung carcinomas (26). The classic mechanism by which cancer cells acquire resistance to methotrexate is through gene amplification (27, 28); however, several studies have shown that point mutations in the DHFR gene can reduce the Km for methotrexate by >100-fold, while having almost no effect on the Km for dihydrofolate (29-31). Therefore, measuring cellular sensitivity to methotrexate can be used as an additional surrogate indicator of alterations in DHFR activity in response to changes in MDM2 expression.
H1299 clone 9 cells have comparable levels of DHFR protein to the parental H1299 line, but this protein displays reduced activity in a dihydrofolate reduction assay (as shown in Fig. 3D). As Fig. 5A shows, we observe that H1299 clone 9 cells are significantly more resistant to methotrexate than the parental H1299 cells, and this is apparent across a range of methotrexate concentrations (not shown). We further analyzed these data to determine the growth rates of these cells in the presence and absence of 30 nmol/L methotrexate, and as Fig. 5B shows, there is a statistically significant difference in the effect of methotrexate upon the growth rate of H1299 and H1299 clone 9 cells. To determine whether methotrexate was differentially inducing apoptosis in these cells, we performed flow cytometry to measure Annexin V binding and propidium iodide staining of H1299 and H1299 clone 9 cells treated for 48 hours with either 0, 25, or 30 nmol/L methotrexate. Figure 5C shows that clone 9 cells are more resistant to apoptosis. The results presented are qualitatively similar to results obtained in studies of p14ARF, with decreased DHFR leading, counterintuitively, to increased resistance to methotrexate (32). These data provide additional confirmation that MDM2 alters the regulation of folate metabolism by DHFR.
Figure 5.
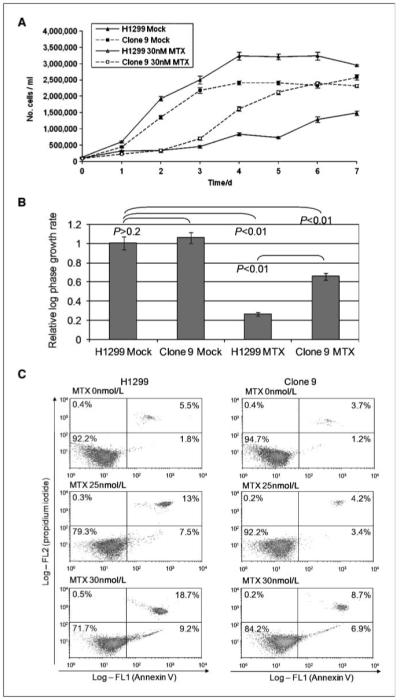
MDM2 expression alters cellular sensitivity to the antifolate drug methotrexate. A, H1299 and H1299 clone 9 (Clone 9) cells were cultured for the indicated times and exposed to 30 nmol/L methotrexate or to mock treatment with the drug vehicle (DMSO). Samples were counted using a Coulter counter. Columns, mean; bars, SE. Six independent cultures were counted at each time point for each condition (n = 6). The experiment has been repeated thrice, and the results shown are from a single typical experiment. B, log phase growth rates (1/time) of cells analyzed in A. Data from the logarithmic portion of the growth curve were fitted to a linear curve on a log-linear plot, and growth rates were calculated as the slopes. The correlation coefficients (H1299 Mock, 0.91; Clone 9 Mock, 0.94; H1299 + MTX, 0.88; Clone 9 + MTX, 0.94) indicate that the time points selected are within a log-growth phase. Columns, growth rates (1/d); bars, SE. Statistical analysis by Student’s t test. C, flow cytometric analysis of H1299 and H1299-clone 9 cells treated with 0, 25, and 30 nmol/L methotrexate and then stained with Annexin V and propidium iodide. Twenty thousand events were collected per condition.
MDM2 monoubiquitinates DHFR
If MDM2 alters the activity of DHFR, and because it has E3 ubiquitin ligase activity but does not promote the degradation of DHFR, then it seemed likely that this was due to MDM2-mediated conjugation of ubiquitin to DHFR. To investigate whether DHFR is a substrate for MDM2-catalysed ubiquitin conjugation, we established an in vitro ubiquitination assay based upon recombinant GST-MDM2 produced in E. coli (18). Figure 6A shows the results of a typical in vitro ubiquitination reaction containing DHFR and GST-MDM2 or GST as indicated, and Fig. 6B shows the purified proteins used for the assay. Transfer of ubiquitin to DHFR is catalysed by GST-MDM2 but not by GST, and the more slowly migrating monoubiquitinated form of DHFR only appeared when both GST-MDM2 and ubiquitin were added to the reaction, thus demonstrating that this is DHFR-ubiquitin. Thus, we conclude that MDM2 catalyses the monoubiquitination of DHFR in vitro. These results are in accordance with those in Figs. 1 to 3 which showed that MDM2 interacts directly with DHFR but does not promote its degradation.
Figure 6.

MDM2 monoubiquitinates DHFR and reduces DHFR activity in a RING finger–dependent manner. A, an in vitro ubiquitination assay was performed using GST-MDM2 or GST as indicated. The panels on the right are from a separate experiment. Indicated amounts of dialyzed DHFR were incubated with 200 ng GST-MDM2 or GST control protein in the presence or absence of ubiquitin. Proteins were resolved by SDS-PAGE, Western blotted, and probed with an anti-DHFR antibody. B, brilliant blue G colloidal stained SDS-PAGE gel indicating the amounts of GST-MDM2 or GST protein used in the ubiquitination reactions. C, H1299 cells were transfected with the indicated plasmids, and cell lysates were assayed for DHFR activity. Three independent transfections were performed for each condition. The right hand panel shows immunoblot analysis of the indicated proteins from the same lysates. D, as for C but with a RING finger mutant of MDM2 included, and transfection was performed with varying amounts of each plasmid DNA as indicated. Note the cutoff of the Y axis in C. Three independent transfections were performed for each condition and for each weight of plasmid DNA used for transfection. Columns, mean; bars, SE. Statistical analysis by Student’s t test. Each experiment has been repeated on at least three occasions, and the results shown are from a single typical experiment.
Regulation of DHFR activity by MDM2 depends upon an intact RING finger domain
Monoubiquitination has been shown to be functionally important in regulating a range of cellular processes, including chromatin remodeling, regulation of DNA metabolism (particularly DNA repair), and receptor endocytosis (reviewed in ref. 33). We wanted to determine whether the inhibitory effect of MDM2 upon DHFR that we had observed depended upon the MDM2 RING finger, because this domain is essential for MDM2 E3 ligase activity that catalyses DHFR monoubiquitination. To accomplish this, we first needed to establish whether transient expression of MDM2 could alter endogenous DHFR activity. Because we had previously observed an effect of MDM2 reducing DHFR activity in cells that stably overexpress MDM2 (see Fig. 3D) and had also observed the reciprocal effect of increasing DHFR activity after knockdown of MDM2 in cells, we anticipated that transient transfection of H1299 cells with a plasmid that expresses MDM2 would also lead to a reduction in DHFR activity. As Fig. 6C shows, we found that under conditions in which >80% of cells have been transfected with an MDM2 expression construct (transfection efficiency determined by cotransfection with a β-galactosidase expression vector and in situ β-galactosidase staining), we observe a significant reduction in DHFR activity. Because MDM2 catalyses the monoubiquitination of DHFR in vitro, we would expect that transient transfection of a RING finger mutant of MDM2 would not affect DHFR activity. Figure 6D shows that this is indeed the case and that the effect of MDM2 upon DHFR is dose dependent. We therefore conclude that MDM2 modulates DHFR activity in cells through direct covalent modification of DHFR with ubiquitin in a dose-dependent manner.
Discussion
MDM2 is an oncogene that has both p53-dependent and p53-independent oncogenic activities. To identify mechanisms through which the observed up-regulation of MDM2 promotes cancer progression, we have focused upon the identification of cellular targets of MDM2. Most of the identified activities of MDM2 depend upon protein-protein interactions, and there are a number of systems that have been used successfully to identify these. The chromatographic approach we have used here isolates proteins that bind to recombinant MDM2 that are likely to be in their native conformation and which are not themselves tagged or fused to heterologous peptides. Confirmation of identified interactions using a yeast two-hybrid screen shows that the interaction (in this case between MDM2 and DHFR) can occur inside viable eukaryotic cells. In both these systems, the potential exists (albeit unlikely in the yeast two-hybrid screen) for the interaction to be mediated by other protein/s, but our in vitro binding data shows that this interaction requires no additional components, and this is further supported by in vitro ubiquitination assays. MDM2 possesses ubiquitin ligase activity, and this is responsible for promoting the proteasomal degradation of a growing list of proteins that includes p53, MDM2, MDM4, Numb, RB1, HipK2, and Tip60 (reviewed in ref. 12). In addition to regulating protein stability through targeting proteins to proteasomes, ubiquitination is a posttranslational modification that plays a key role in a number of important cellular processes, including chromatin remodeling, regulation of DNA metabolism, and receptor endocytosis. MDM2 has also been implicated in such regulation, for example MDM2 has been shown to bind to and to ubiquitinate β-arrestin and through this to contribute to internalization of β2-adrenergic receptor (24). Although MDM2 promotes degradation of a number of proteins, studies of the MDM2-mediated degradation of p53 have found that MDM2 only promotes efficient polyubiquitination in the presence of a cofactor (p300) and in the absence of this MDM2 promotes monoubiquitination (34).
Monoubiquitination has been shown to be a critical regulatory event in several cellular processes, an example being the regulation of DNA repair; after DNA damage, monoubiquitination of proliferating cell nuclear antigen, catalysed by Rad18, plays a role in switching activity from replicative to translesion synthetic DNA polymerases at stalled replication forks (reviewed in ref. 35). We have found that binding of MDM2 to DHFR does not regulate the stability of DHFR; indeed, experiments with inhibitors of proteasomal degradation showed that DHFR stability is not regulated in this way (Fig. 3B).3 Rather, modulating MDM2 levels show that MDM2 has a direct effect upon cellular DHFR activity. This is further supported by our experiments with the antifolate drug methotrexate, in which resistance to the drug acts as a surrogate for MDM2-mediated regulation of DHFR activity. In vitro, we can see that MDM2 directly catalyses the monoubiquitination of DHFR, and in cells in culture, modification of DHFR by MDM2 is shown to be necessary for MDM2-mediated regulation of DHFR because this effect is abolished by a mutation in the RING finger domain of MDM2. Our results with siRNA and overexpression of MDM2 suggest that the latter may have a more profound effect upon DHFR activity. This is compatible with DHFR inhibition being a target of the p53-independent oncogenic effects that result from overexpression of MDM2.
DHFR catalyses the conversion of dihydrofolate to tetrahydrofolate, an essential intermediate carrier of one-carbon groups used ubiquitously in mammalian cells. Methylation is important for both biosynthesis of purine and pyrimidine bases required for DNA synthesis and also for epigenetic regulation via modification of nucleic acids and proteins. Folate metabolism is closely linked with the regulation (and in diseases, such as cancer, of deregulation) of methylation (see ref. 36 for review).
Our discovery that MDM2 regulates DHFR activity through direct monoubiquitination links MDM2 with the regulation of folate metabolism and thus potentially with aspects of methylation and epigenetic regulation. High levels of MDM2 are rarely, if ever, tolerated in normal cells (5), although the reason for this is unknown (it has been suggested that loss of p53 function may render cells more tolerant to the negative effects of increased MDM2 expression; ref. 37). We have shown that MDM2 up-regulation inhibits DHFR and thus would be expected to have a negative effect upon folate metabolism. Changes in dietary folate have been shown to have some surprising consequences; for example, low dietary folate has been linked with increased CDKN2A (p16INK4a) promoter hypermethylation and an increased risk of cancer (38). Similarly, we have observed, as others have, that a reduction in DHFR can lead to an increase in resistance to methotrexate (32). Thus, changes in folate metabolism do not always result in the anticipated consequences. Moreover, experiments using chemicals that have fairly well-defined pharmacologic properties, such as 5-azacytidine, have also produced results that would not be expected a priori. For example, whereas 5-azacytidine has been routinely used to de-methylate a number of genes and to induce global hypomethylation of DNA (39), there are good examples of genes becoming hypermethylated after the addition of this agent (40). It is clear from such observations therefore that it is not trivial to try to anticipate the phenotype of alterations in folate metabolism (25). Nevertheless, we might anticipate that high levels of MDM2 would be linked with a phenotype that resembles low dietary folate. In rats, a chronic reduction in dietary components of methyl-donor pathways (folate, methionine, and choline) leads to global DNA hypomethylation and to cancer with a strong correlation between tissue susceptibility to cancer and induction of global hypomethylation (41). Additionally, in mice with a predisposition to develop colorectal cancer (Apc+/−, Msh2−/−), it has also been shown that diets supplemented with folate significantly suppress early events in colorectal carcinogenesis (42). Thus, if MDM2 has a negative effect upon the availability of tetrahydrofolate, we anticipate that this would contribute to global hypomethylation and/or specific tumor suppressor gene promoter hypermethylation and thus contribute to carcinogenesis.
In addition to regulation of folate metabolism for methylation of DNA, DHFR activity is required to provide one-carbon groups for histone methylation and for the biosynthesis of both purine and pyrimidine bases and thus for DNA replication (for review, see ref. 43). Histone methylation is linked to the regulation of chromatin structure and gene regulation. Whereas the effect of folate deficiency upon this has not been extensively studied, it has been shown that inhibition of specific methyl-transferases leads to promoter hypomethylation with resultant up-regulation of gene expression with concomitant changes in histone methylation (44). Thus, the changes in DNA methylation observed to follow from folate deficiency might well be linked to alterations in histone methylation.
In addition to its ability to negatively regulate p53, MDM2 interacts with several molecules that have a role in the regulation of the G1 checkpoint and S-phase progression (1) and which are thus linked via DNA synthesis and therefore necessarily with folate metabolism. For example, MDM2 has been shown to promote S-phase entry by binding to RB1 promoting its degradation and stimulating E2F1 (45-47). In addition, we have previously identified a direct effect of MDM2 in stimulating DNA polymerase ε (15, 48), an essential molecule with a poorly understood role in DNA synthesis in mammalian cells. This function of MDM2 in promoting cell cycle progression seems to run counter to that we have identified, because this might be anticipated to have an inhibitory effect on DNA synthesis. Given the unpredictable consequences of alterations in folate metabolism described above, it is likely that this simplistic argument cannot be relied upon to withstand further experimental investigation.
In conclusion, folate metabolism plays an important role in a wide range of physiologic and pathophysiologic processes, and thus, the effect of MDM2 upon DHFR that we have identified may have implications for any number of these. MDM2 alters DHFR activity in a p53-independent manner and high levels of MDM2 are associated with poor prognosis in a number of cancers independently of p53 status. Our results identify a novel p53-independent activity for MDM2 in regulating folate metabolism in a manner that has been shown to alter epigenetic regulation and promote cancer.
Supplementary Material
Acknowledgments
Grant support: BBSRC, North West Cancer Research Fund, Mersey Kidney Research and Cancer Research-UK (M. Boyd and N. Vlatković) and MRC Proteomics Initiative (B.K. Park).
We thank Carlos Rubbi for many interesting and helpful discussions and critical review of the manuscript and Dale Haines for H1299 clone 9 cells.
Footnotes
Unpublished data.
Publisher's Disclaimer: The costs of publication of this article were defrayed in part by the payment of page charges. This article must therefore be hereby marked advertisement in accordance with 18 U.S.C. Section 1734 solely to indicate this fact.
References
- 1.Iwakuma T, Lozano G. MDM2, an introduction. Mol Cancer Res. 2003;1:993–1000. [PubMed] [Google Scholar]
- 2.Ganguli G, Wasylyk B. p53-independent functions of MDM2. Mol Cancer Res. 2003;1:1027–35. [PubMed] [Google Scholar]
- 3.Sigalas I, Calvert AH, Anderson JJ, Neal DE, Lunec J. Alternatively spliced mdm2 transcripts with loss of p53 binding domain sequences: transforming ability and frequent detection in human cancer. Nat Med. 1996;2:912–7. doi: 10.1038/nm0896-912. [DOI] [PubMed] [Google Scholar]
- 4.Lundgren K, Montes de Oca Luna R, McNeill YB, et al. Targeted expression of MDM2 uncouples S phase from mitosis and inhibits mammary gland development independent of p53. Genes Dev. 1997;11:714–25. doi: 10.1101/gad.11.6.714. [DOI] [PubMed] [Google Scholar]
- 5.Jones SN, Hancock AR, Vogel H, Donehower LA, Bradley A. Overexpression of Mdm2 in mice reveals a p53-independent role for Mdm2 in tumorigenesis. Proc Natl Acad Sci U S A. 1998;95:15608–12. doi: 10.1073/pnas.95.26.15608. [DOI] [PMC free article] [PubMed] [Google Scholar]
- 6.Kannemeier C, Liao R, Sun P. The RING finger domain of MDM2 is essential for MDM2-mediated TGF-β resistance. Mol Biol Cell. 2007;18:2367–77. doi: 10.1091/mbc.E06-09-0844. [DOI] [PMC free article] [PubMed] [Google Scholar]
- 7.Sun P, Dong P, Dai K, Hannon GJ, Beach D. p53-independent role of MDM2 in TGF-β1 resistance. Science. 1998;282:2270–2. doi: 10.1126/science.282.5397.2270. [DOI] [PubMed] [Google Scholar]
- 8.Haitel A, Wiener HG, Baethge U, Marberger M, Susani M. mdm2 expression as a prognostic indicator in clear cell renal cell carcinoma: comparison with p53 over-expression and clinicopathological parameters. Clin Cancer Res. 2000;6:1840–4. [PubMed] [Google Scholar]
- 9.Ikeguchi M, Ueda T, Fukuda K, Yamaguchi K, Tsujitani S, Kaibara N. Expression of the murine double minute gene 2 oncoprotein in esophageal squamous cell carcinoma as a novel marker for lack of response to chemoradiotreatment. Am J Clin Oncol. 2002;25:454–9. doi: 10.1097/00000421-200210000-00006. [DOI] [PubMed] [Google Scholar]
- 10.Lu ML, Wikman F, Orntoft TF, et al. Impact of alterations affecting the p53 pathway in bladder cancer on clinical outcome, assessed by conventional and array-based methods. Clin Cancer Res. 2002;8:171–9. [PubMed] [Google Scholar]
- 11.Osman I, Drobnjak M, Fazzari M, Ferrara J, Scher HI, Cordon-Cardo C. Inactivation of the p53 pathway in prostate cancer: impact on tumor progression. Clin Cancer Res. 1999;5:2082–8. [PubMed] [Google Scholar]
- 12.Toledo F, Wahl GM. Regulating the p53 pathway: in vitro hypotheses, in vivo veritas. Nat Rev. 2006;6:909–23. doi: 10.1038/nrc2012. [DOI] [PubMed] [Google Scholar]
- 13.Elenbaas B, Dobbelstein M, Roth J, Shenk T, Levine AJ. The MDM2 oncoprotein binds specifically to RNA through its RING finger domain. Mol Med. 1996;2:439–51. [PMC free article] [PubMed] [Google Scholar]
- 14.Boyd MT, Vlatkovic N, Haines DS. A novel cellular protein (MTBP) binds to MDM2 and induces a G1 arrest that is suppressed by MDM2. J Biol Chem. 2000;275:31883–90. doi: 10.1074/jbc.M004252200. [DOI] [PubMed] [Google Scholar]
- 15.Vlatkovic N, Guerrera S, Li Y, Linn S, Haines DS, Boyd MT. MDM2 interacts with the C-terminus of the catalytic subunit of DNA polymerase epsilon. Nucleic Acids Res. 2000;28:3581–6. doi: 10.1093/nar/28.18.3581. [DOI] [PMC free article] [PubMed] [Google Scholar]
- 16.Brady M, Vlatkovic N, Boyd MT. Regulation of p53 and MDM2 activity by MTBP. Mol Cell Biol. 2005;25:545–53. doi: 10.1128/MCB.25.2.545-553.2005. [DOI] [PMC free article] [PubMed] [Google Scholar]
- 17.Charalabous P, Risk JM, Jenkins R, Birss AJ, Hart CA, Smalley JW. Characterization of a bifunctional catalase-peroxidase of Burkholderia cenocepacia. FEMS Immunol Med Microbiol. 2007;50:37–44. doi: 10.1111/j.1574-695X.2007.00224.x. [DOI] [PubMed] [Google Scholar]
- 18.Fang S, Jensen JP, Ludwig RL, Vousden KH, Weissman AM. Mdm2 is a RING finger-dependent ubiquitin protein ligase for itself and p53. J Biol Chem. 2000;275:8945–51. doi: 10.1074/jbc.275.12.8945. [DOI] [PubMed] [Google Scholar]
- 19.Haupt Y, Maya R, Kazaz A, Oren M. Mdm2 promotes the rapid degradation of p53. Nature. 1997;387:296–9. doi: 10.1038/387296a0. [DOI] [PubMed] [Google Scholar]
- 20.Juven-Gershon T, Shifman O, Unger T, Elkeles A, Haupt Y, Oren M. The Mdm2 oncoprotein interacts with the cell fate regulator Numb. Mol Cell Biol. 1998;18:3974–82. doi: 10.1128/mcb.18.7.3974. [DOI] [PMC free article] [PubMed] [Google Scholar]
- 21.Kubbutat MH, Jones SN, Vousden KH. Regulation of p53 stability by Mdm2. Nature. 1997;387:299–303. doi: 10.1038/387299a0. [DOI] [PubMed] [Google Scholar]
- 22.Pan Y, Chen J. MDM2 promotes ubiquitination and degradation of MDMX. Mol Cell Biol. 2003;23:5113–21. doi: 10.1128/MCB.23.15.5113-5121.2003. [DOI] [PMC free article] [PubMed] [Google Scholar]
- 23.Sdek P, Ying H, Chang DL, et al. MDM2 promotes proteasome-dependent ubiquitin-independent degradation of retinoblastoma protein. Mol Cell. 2005;20:699–708. doi: 10.1016/j.molcel.2005.10.017. [DOI] [PubMed] [Google Scholar]
- 24.Shenoy SK, McDonald PH, Kohout TA, Lefkowitz RJ. Regulation of receptor fate by ubiquitination of activated β 2-adrenergic receptor and β-arrestin. Science. 2001;294:1307–13. doi: 10.1126/science.1063866. [DOI] [PubMed] [Google Scholar]
- 25.Assaraf YG. Molecular basis of antifolate resistance. Cancer Metastasis Rev. 2007;26:153–81. doi: 10.1007/s10555-007-9049-z. [DOI] [PubMed] [Google Scholar]
- 26.Hanna N, Shepherd FA, Fossella FV, et al. Randomized phase III trial of pemetrexed versus docetaxel in patients with non-small-cell lung cancer previously treated with chemotherapy. J Clin Oncol. 2004;22:1589–97. doi: 10.1200/JCO.2004.08.163. [DOI] [PubMed] [Google Scholar]
- 27.Alt FW, Kellems RE, Bertino JR, Schimke RT. Selective multiplication of dihydrofolate reductase genes in methotrexate-resistant variants of cultured murine cells. J Biol Chem. 1978;253:1357–70. [PubMed] [Google Scholar]
- 28.Nunberg JH, Kaufman RJ, Schimke RT, Urlaub G, Chasin LA. Amplified dihydrofolate reductase genes are localized to a homogeneously staining region of a single chromosome in a methotrexate-resistant Chinese hamster ovary cell line. Proc Natl Acad Sci U S A. 1978;75:5553–6. doi: 10.1073/pnas.75.11.5553. [DOI] [PMC free article] [PubMed] [Google Scholar]
- 29.Haber DA, Beverley SM, Kiely ML, Schimke RT. Properties of an altered dihydrofolate reductase encoded by amplified genes in cultured mouse fibroblasts. J Biol Chem. 1981;256:9501–10. [PubMed] [Google Scholar]
- 30.Jackson RC, Hart LI, Harrap KR. Intrinsic resistance to methotrexate of cultured mammalian cells in relation to the inhibition kinetics of their dihydrololate reductases. Cancer Res. 1976;36:1991–7. [PubMed] [Google Scholar]
- 31.Simonsen CC, Levinson AD. Isolation and expression of an altered mouse dihydrofolate reductase cDNA. Proc Natl Acad Sci U S A. 1983;80:2495–9. doi: 10.1073/pnas.80.9.2495. [DOI] [PMC free article] [PubMed] [Google Scholar]
- 32.Magro PG, Russo AJ, Li WW, Banerjee D, Bertino JR. p14ARF expression increases dihydrofolate reductase degradation and paradoxically results in resistance to folate antagonists in cells with nonfunctional p53. Cancer Res. 2004;64:4338–45. doi: 10.1158/0008-5472.CAN-03-1045. [DOI] [PubMed] [Google Scholar]
- 33.Hicke L. Protein regulation by monoubiquitin. Nat Rev Mol Cell Biol. 2001;2:195–201. doi: 10.1038/35056583. [DOI] [PubMed] [Google Scholar]
- 34.Grossman SR, Deato ME, Brignone C, et al. Polyubiquitination of p53 by a ubiquitin ligase activity of p300. Science. 2003;300:342–4. doi: 10.1126/science.1080386. [DOI] [PubMed] [Google Scholar]
- 35.Lehmann AR. Translesion synthesis in mammalian cells. Exp Cell Res. 2006;312:2673–6. doi: 10.1016/j.yexcr.2006.06.010. [DOI] [PubMed] [Google Scholar]
- 36.Das PM, Singal R. DNA methylation and cancer. J Clin Oncol. 2004;22:4632–42. doi: 10.1200/JCO.2004.07.151. [DOI] [PubMed] [Google Scholar]
- 37.Brown DR, Thomas CA, Deb SP. The human oncoprotein MDM2 arrests the cell cycle: elimination of its cell-cycle-inhibitory function induces tumorigenesis. EMBO J. 1998;17:2513–25. doi: 10.1093/emboj/17.9.2513. [DOI] [PMC free article] [PubMed] [Google Scholar]
- 38.Kraunz KS, Hsiung D, McClean MD, et al. Dietary folate is associated with p16(INK4A) methylation in head and neck squamous cell carcinoma. Int J Cancer. 2006;119:1553–7. doi: 10.1002/ijc.22013. [DOI] [PubMed] [Google Scholar]
- 39.Cantor JP, Iliopoulos D, Rao AS, et al. Epigenetic modulation of endogenous tumor suppressor expression in lung cancer xenografts suppresses tumorigenicity. Int J Cancer. 2007;120:24–31. doi: 10.1002/ijc.22073. [DOI] [PubMed] [Google Scholar]
- 40.Broday L, Lee YW, Costa M. 5-azacytidine induces transgene silencing by DNA methylation in Chinese hamster cells. Mol Cell Biol. 1999;19:3198–204. doi: 10.1128/mcb.19.4.3198. [DOI] [PMC free article] [PubMed] [Google Scholar]
- 41.Pogribny IP, James SJ, Jernigan S, Pogribna M. Genomic hypomethylation is specific for preneoplastic liver in folate/methyl deficient rats and does not occur in non-target tissues. Mutat Res Fundam Mol Mech Mutagen. 2004;548:53–9. doi: 10.1016/j.mrfmmm.2003.12.014. [DOI] [PubMed] [Google Scholar]
- 42.Song J, Sohn K-J, Medline A, Ash C, Gallinger S, Kim Y-I. Chemopreventive effects of dietary folate on intestinal polyps in Apc+/− Msh2−/− mice. Cancer Res. 2000;60:3191–9. [PubMed] [Google Scholar]
- 43.Davis CD, Uthus EO. DNA methylation, cancer susceptibility, and nutrient interactions. Exp Biol Med (Maywood) 2004;229:988–95. doi: 10.1177/153537020422901002. [DOI] [PubMed] [Google Scholar]
- 44.Fahrner JA, Eguchi S, Herman JG, Baylin SB. Dependence of histone modifications and gene expression on DNA hypermethylation in cancer. Cancer Res. 2002;62:7213–8. [PubMed] [Google Scholar]
- 45.Martin K, Trouche D, Hagemeier C, Sorensen TS, La Thangue NB, Kouzarides T. Stimulation of E2F1/DP1 transcriptional activity by MDM2 oncoprotein. Nature. 1995;375:691–4. doi: 10.1038/375691a0. [DOI] [PubMed] [Google Scholar]
- 46.Uchida C, Miwa S, Kitagawa K, et al. Enhanced Mdm2 activity inhibits pRB function via ubiquitin-dependent degradation. EMBO J. 2005;24:160–9. doi: 10.1038/sj.emboj.7600486. [DOI] [PMC free article] [PubMed] [Google Scholar]
- 47.Xiao ZX, Chen J, Levine AJ, et al. Interaction between the retinoblastoma protein and the oncoprotein MDM2. Nature. 1995;375:694–8. doi: 10.1038/375694a0. [DOI] [PubMed] [Google Scholar]
- 48.Asahara H, Li Y, Fuss J, et al. Stimulation of human DNA polymerase epsilon by MDM2. Nucleic Acids Res. 2003;31:2451–9. doi: 10.1093/nar/gkg342. [DOI] [PMC free article] [PubMed] [Google Scholar]
Associated Data
This section collects any data citations, data availability statements, or supplementary materials included in this article.