Abstract
Long Evans Rats (n=32) were trained for 2 weeks to respond to an auditory conditioned stimulus (CS) which signaled the delivery of a 20% sucrose unconditioned stimulus (US) with varying probabilities. Animals were randomly assigned to 1 of 4 groups. In the control groups, the CS signaled sucrose delivery with equal probabilities across two weeks, at 100% (Group 100–100) and 25% (Group 25–25) respectively. In the experimental groups, (Group 100–25) and (Group 25–100), sucrose probabilities were switched between weeks 1 and 2. Three behavioral measures were recorded; latency to enter the sucrose port upon CS presentation, head entries throughout the session and ultrasonic vocalizations. The results suggest that all groups formed associations between the CS and US, as evidenced by a decrease in latency to respond to the CS across days. The experimental groups were also able to detect when sucrose probability changed, as evidenced by Group 25–100’s increase in head entries, to the level of Group 100–100 in week 2, and Group 100–25’s decrease in head entries, to the level of Group 25–25 in week 2. Group 100–25 also produced an increase in “22 kHz” ultrasonic vocalizations following the downshift on the first day of week 2. The increase in this ultrasonic frequency range, which is associated with negative affect in rats, preceded both the decrease in head entries and the increase in missed trials, consistent with a multistage model of behaviors resulting from US probability reduction.
Keywords: ultrasonic vocalizations, sucrose, affect, pavlovian conditioning
1. Introduction
Animal learning depends on subjects’ ability to produce associations between cues in their environment (conditioned stimuli) and their outcomes (unconditioned stimuli). The factors mediating these associations, including the probability of, frequency of, or delay to US, are well documented ([1] Rescorla & Wagner 1972; [2] Drew, Zupan, Cooke, Couvillon, & Balsam, 2005). When experimenters induce changes in outcome schedules, it can have an impact on animals’ affect and behavior ([3] Knutson, Burgdorf, &Panksepp 1999, [4] Berridge & Robinson 1998, [5] Barker et al. 2010; reviewed in Flaherty, [6] 1982, [7] 1996). Affect in rats has been correlated to their ultrasonic vocalizations (USVs) ([8] Blanchard et al. 1991), which can be divided into two distinct categories representing positive and negative affect. USVs in the “22kHz” range (18–32 kHz) have been correlated with negative stimuli, such as shock, pain or reward omission ([9] Brudzynski 2001, [10] Brudzynski & Holland 2005), while calls in the “50kHz” range (38–80 kHz) have been correlated with positive stimuli, such as food, sex, or drugs of abuse ([5] Barker et al. 2010; [11] Brudzinski & Pniak 2002; [12] Burgdorf, Knutson & Panksepp 2000).
In the present study, the predictive validity of the CS was either a) maintained at a high (100%) level, b) maintained at a low (25%) level, c) increased from low (25%) to high (100%), or d) decreased from high (100%) to low (25%). It was of interest to ask whether positive and/or negative USVs are associated with the absolute level of CS predictive validity or changes in CS predictive validity, or precede, coincide with or follow overt behavioral changes in the CS/CR relationship.
2. Methods and Materials
2.1 Subjects
Adult, male Long-Evans rats (n=32) from multiple litters (Charles River, Wilmington, MA) were singly housed on a 12h:12h, light:darkcycle, with dawn at 11:30 am. Experiments were conducted during the early portion of the light cycle. Animals’ weights were maintained at 310–320g using a food restricted diet. Water was available ad libitum, when subjects were not in experimental sessions. All conditions were maintained in compliance with the Guide for the Care and Use of Laboratory Animals (NIH, Publications 865–23) and approved by the Institutional Animal Care and Use Committee, Rutgers University.
2.2 Apparatus
Experimental sessions were conducted in a custom acrylic chamber (31.0 cm length, 25.5 cm width, 45.0 cm height), enclosed in a larger sound-attenuating chamber (6249C, Med Associates; St. Albans, VT). A halogen bulb shielded by an aluminum plate served as an indirect house-light for the test chamber. A camera (LT Security Inc. # LTCMS608; Houston, TX) recorded the entire experimental session to VHS tape (HR-DD84OU, JVC; McAllen, TX). A video frame-counter (VC-436, Thalner Electronics; Ann Arbor, MI) was synchronized to digitally controlled inputs/outputs for behavioral events (PCI-CTR05, Measurement Computing Corporation; Norton, MA), and was used to timestamp each frame on the VHS (33ms resolution).
A rectangular opening (3.0 cm wide × 14.5 cm high × 3.0cm deep) centered on the right sidewall of the chamber served as the head entry port for a retractable dipper (H1405R, Coulbourn; New York, NY) The dipper was connected to a remote syringe pump (R-E, Razel; Fairfax, VT)to deliver a 20% sucrose solution. A second remote syringe pump was activated during non-US trails, to control for any predictive properties of the pump’s activation (henceforth referred to as “control syringe pump”). White noise was produced through a speaker located centrally in the room, via a white noise generator at ~72 dB (measured outside the chamber), and pumps were located outside the sound-attenuating chamber, under the heavy counter on which the chamber was located, with the intent of making their operation inaudible. A light was positioned inside the dipper port, and was activated each time the dipper was in the “up” position. An infrared photocell (H2093SP01, Coulbourn; New York, NY) was positioned 1cm into the dipper port and 1cm up from the floor, to record head entries into the port. A speaker (40–1354, Realistic) was located on the ceiling above the chamber, and in combination with a custom-built tone generator produced a 3.5 kHz, 74 dB tone.
2.3 Procedure
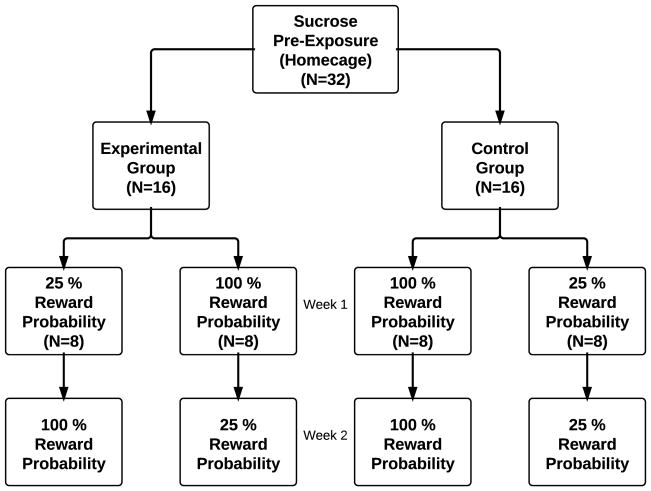
Experimental procedures were modeled after experiments developed by Horvitz and colleagues (e.g. [13] Choi, Balsam, & Horvitz, 2005). Subjects were pre-exposed to 5 ml of liquid sucrose solution (20%) in their home cages for two days prior to the first session. Experimental sessions ran 5 days/week, for 2 weeks. Each week began on Wednesday and ended Tuesday (sessions were not run on weekends). Animals (n=32) were randomly assigned to one of four groups (n=8 per group). Experimental groups (100–25) and (25–100) received sucrose on 25% or 100% of trials during the first week, and the reverse during the second week. Subjects in the control groups (25–25) and (100–100) received sucrose at the same probability (25% or 100%) across both weeks (Figure 1).
Figure 1.
Flow chart depicting sucrose probability group assignments and experimental timeline. Weekly sessions ran Wednesday through Tuesday, excluding weekends.
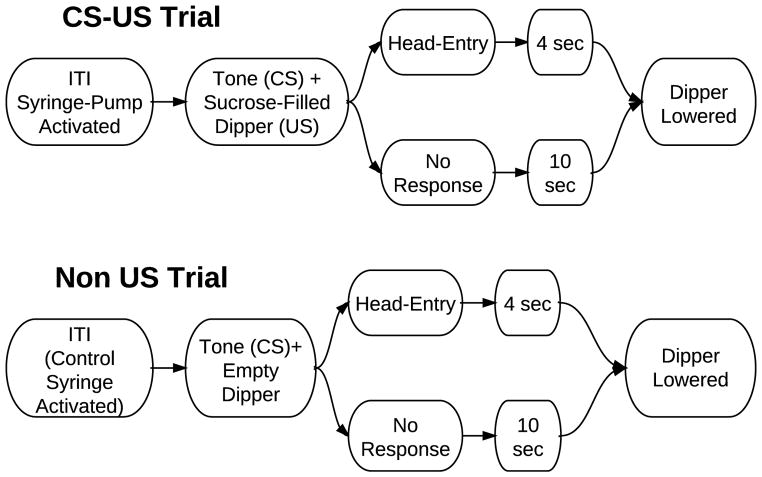
Daily sessions began with the initiation of a variable time (VT) 54 second schedule. Intervals for the VT were selected from a 30 item Fleshler-Hoffman distribution (Fleshler & Hoffman, 1962). Each session ran for a total of 28 trials. During each ITI, either the sucrose or control syringe pump activated. On US trials the sucrose syringe pump activated for 1.0 s, to deliver ~25 μL of 20% liquid sucrose to the dipper. On non-US trials the control syringe pump was activated for 1.0 s, to deliver water to a beaker located outside the chamber. At the end of each ITI a 74 dB, 3.5 kHz, tone activated for 500ms. 250ms after the initiation of the tone, the port-light activated and the dipper ascended. Once an animal made a head entry, a 4s consumption period began, after which the dipper would descend, the port light would extinguish and the next ITI would begin (Figure 2). If the animal did not enter the dipper port within 10 s, the dipper would descend, the port light would extinguish and the next ITI would begin.
Figure 2.
Diagram depicting the temporal arrangement of a single session. Sessions last 28 trials. The syringe activates concurrently with the end of the previous ITI.
2.4 USV Recording
A condenser microphone (CM16/CMPA, Avisoft Bioacoustics, Berlin Germany) was inserted into the sound-attenuating chamber prior to the start of the session. The microphone was suspended ~2.5 cm from a set of small holes in the top of the chamber, above the quadrant proximal to the dipper port. Sonorous activity was recorded for the entire session at a 192-kHz sampling frequency (16-bits) using Avisoft Recorder software and hardware (Ultrasound Gate 116H, Avisoft Bioacoustics). Following each session recordings were saved as WAV files and stored for offline analysis. Recorded WAV files were then analyzed using Avisoft SAS Lab Pro.
2.5 Characterization of USVs
USV recordings were transformed into spectrograms, indicating frequency, amplitude, and duration of single calls. Spectrograms were visually inspected for patterns indicative of USVs. Once a plausible USV was identified, it was transposed to 5% of its normal frequency, to allow experimenters to perform a secondary, auditory confirmation of its characteristics. Only calls that were both visually and audibly confirmed were included in analysis. USVs were separated into 3 call types, Fixed Frequency (FF), Frequency Modulated (FM), and Trills. FF USVs maintain a stable median frequency for the duration of the call. FM USVs were defined as calls that exhibit a 3kHz or greater modulation in median frequency. Calls that exhibit more than one modulation of 3kHz or more were sorted as Trills. Proximal calls were considered to be separate only if there was a silence greater than 100ms between them (Barker et al, 2010).
2.6 Video Analysis
Three subjects were randomly selected from each experimental group for video analysis (n=12). Time-stamped recordings of USVs and behavior were used to control for movement related effects on USV production. The starting point was to generate a list of timestamps of all USVs. Behavior was then analyzed in 1s bins centered on individual USVs (all other 1 sec bins that contained no USV were excluded from this analysis). Behavior was categorized into 8 discrete categories. (1) Grooming; (2) Rearing; (3) Locomotion; (4) Non-movement; (5) Dipper approach; (6) Dipper retreat; (7) Head entries while the dipper is up; (8) Head entries while the dipper is down. Behaviors were scored by individuals who were blind to USV type, and treatment group.
2.7 Behavioral Analysis
Behavioral variables, including “Head Entries”, “Missed Trials” and “CS Latency” were analyzed using Repeated Measures ANOVAs (SPSS, IBM; Armonk, NY). The number of head entries was scored without respect to whether the dipper apparatus was in the up or down position. A missed trial was defined as a trial in which no head entry occurred during the dipper presentation. CS latency was defined as the latency to make the first head entry following the CS onset. This measure was compared to a “Control Latency”, defined as the latency to make the first head entry following a control node (syringe activation). Head entries preformed more than 10 seconds after either the CS or the control node were excluded from the latency analysis. This comparison served two purposes: to ensure that changes in CS latency were specific to learning about the CS, and to show that animals did not learn to predict US trials based on the syringe activation. The data were analyzed using 2 × 4 × 5 Repeated Measures ANOVAs which included 2 levels of “Week”, 4 levels of “Group”, and 5 levels of “Day”. Treatment group refers to the four US probability groups to which animals were assigned (Figure 1). The level of “Week” represented the change in US probability in the experimental groups. The level of “Day” was nested within week, to asses learning across sessions. For all tests, Greenhouse-Geisser corrections were applied when necessary. Post-hoc tests compared differences between groups on certain days. Groups of the same outcome probability were combined in the first week, while the four groups were analyzed individually in the second week. Post-hoc tests compared differences between groups on days 3–5, because behavior in this task was previously shown to asymptote by day 3, and has been used as a pharmacological test day for the same reason ([13] Choi, Balsam & Horvitz 2005). This allows comparisons of stable responding between groups, without influence from the rapid learning period. All Post-hoc comparisons were made using Bonferroni corrected pairwise comparisons.
2.8 CR Profile Analysis
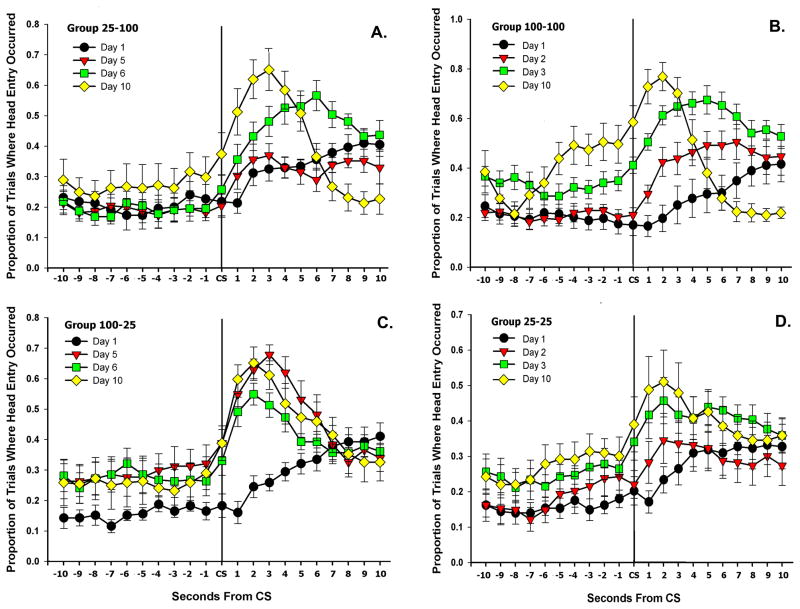
For each group, conditioned responding was examined in close detail in the time surrounding the CS. The proportion of trials in which the animal’s head was in the sucrose port during ten 1-second bins before and after each CS was calculated. That is, for each of the 10 seconds surrounding the CS, if the animal’s head was in the sucrose port, that second was deemed to contain a head entry. A single head entry could extend through multiple time bins, with each bin being considered to contain a head entry. Only select days (1, 2, 3 & 10 for control groups and 1, 5, 6, & 10 for experimental groups) are represented in the figure (6). All data were included in the analysis.
Figure 6.
The proportion of trials when animals’ heads were in the sucrose port during ten 1-sec bins on either side of the CS for A.) Group 100–100, B.) Group 25–100, C.) Group 25–25 and D.) Group 100–25.
Repeated measures ANOVAs were run to examine the peak proportion of trials that contained head entries after the CS across training. Also, within groups contrasts of the peak proportion of trials with head entries were made between week 1 (days 3–5), and week 2 (days 8–10), to assess whether changes in US predictability affected response likelihood for experimental groups (100–25 & 25–100).
2.9 USV Analysis
USVs were analyzed in three distinct categories: 22kHz USVs (18–33 kHz), 50kHz USVs (38–80 kHz), and 33kHz USVs (33–38). The full range of USVs that animals emit form a bimodal distribution consisting of the 22 and 50 kHz ranges, with 22 kHz calls being correlated to negative stimuli and 50 kHz calls being correlated to positive stimuli. The tails of these distributions overlap between ~33–38-kHz, making USVs in this range difficult to interpret. Thus, we have separated these data as “un-categorizable” for the sake of analysis. Samples for vocalization analysis were taken from session 1, 3, and 5 each week. Samples from week one are labeled as 1.1, 1.2, and 1.3, while samples from week two are labeled as 2.1, 2.2, and 2.3. The number of USVs emitted for each call category was analyzed using the same Repeated Measures ANOVA used for behavioral variables.
3. Results
3.1 Head Entries
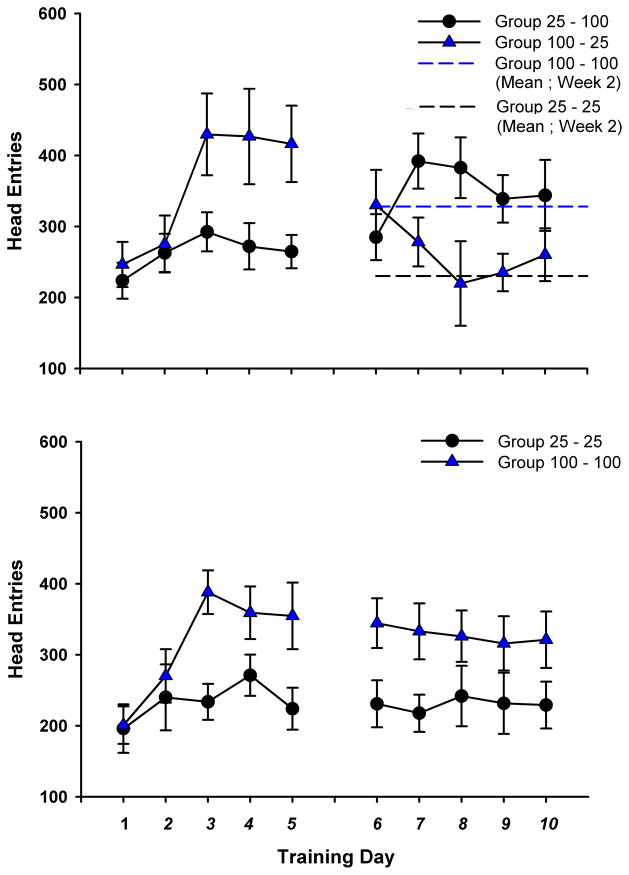
All groups increased the number of head entries emitted over week 1. A Repeated Measures ANOVA for head entries revealed a significant effect of day, F(4,27) = 11.079, p < .001 (Figure 3). In accordance with US probability, a between groups contrast showed that animals in both 25% probability groups exhibited significantly fewer head entries than both 100% probability groups in week 1 (days 3–5), t(90) = −5.824, p < .001 (Figure 3).
Figure 3.
(Top) Average number of head entries ± SEM for the experimental groups. Average week 2 head entries from the control groups are shown as reference lines. (Bottom) Average number of head entries ± SEM for the control groups.
To determine if animals modulated head entries in accordance with changes in US predictability, within subjects contrasts were performed between the final 3 days of both weeks. Group 100–100 and Group 25–25 exhibited stable rates of head entries, with no significant difference between week 1 (days 3–5) and week 2 (days 8–10) (Figure 3, bottom). Group 25–100 exhibited significantly more head entries during week 2 than in week 1, t(70) = 2.81, p = .006 (Figure 3, top). Group 100–25 exhibited significantly fewer head entries in week 2 than in week 1, t(70) = −4.93, p < .001(Figure 3, top). There were no significant differences between groups experiencing the same probability in the last 3 days of week 2. These tests demonstrate that control animals learned to respond proportionately with US predictability, and that experimental animals were capable of modulating their head entry behavior appropriately when US probability changed.
3.2 Missed Trials
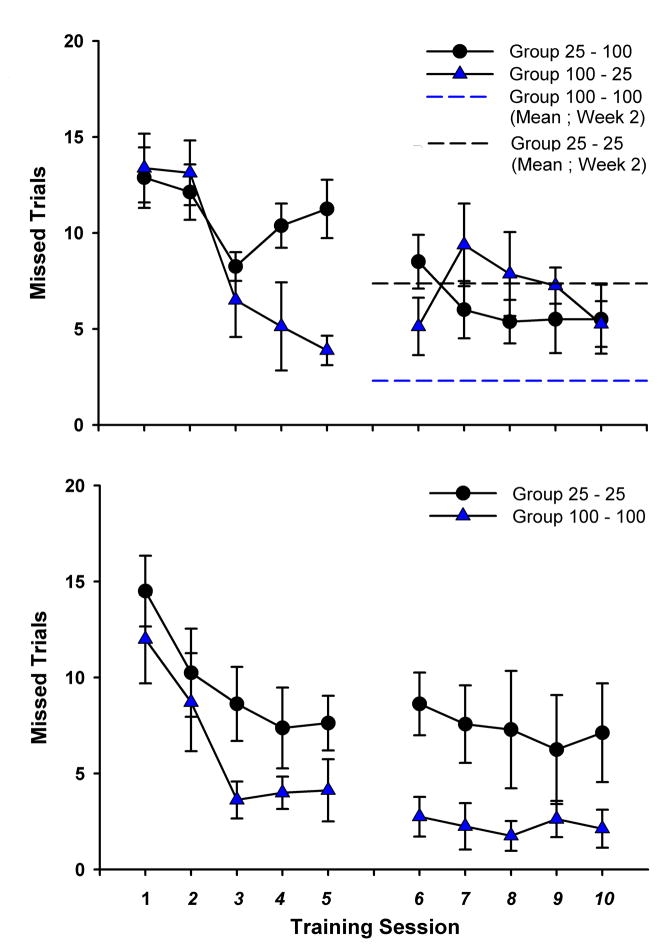
A repeated measures ANOVA revealed a significant effect of week for missed trials, F(1,28) = 15.14, p = .001, as all groups reduced missed trials between week 1 and 2 (Figure 4). In accordance with reward probability, Group 100–100 missed the fewest trials over all ten sessions (Figure 4, bottom), and Group 100–25 showed the smallest reduction in missed trials (Figure 4, top). A between groups comparison of missed trials showed that the two groups receiving sucrose at 25% probability exhibited a greater number of missed trials than the 100% sucrose probability groups in week 1 (days 3–5), t(86.17) = 4.92, p < .001 (Figure 4).
Figure 4.
(Top) Average number of missed trials ± SEM for the experimental groups. Average number of missed trials in week 2 from the control groups are shown as reference lines. (Bottom) Average number of missed trials ± SEM for the control groups.
To determine if animals modulated missed trials in accordance with changes in US predictability, within subjects contrasts were performed between the final 3 days of both weeks. The control groups (100–100 & 25–25) exhibited stable rates of missed trials, with no significant difference between week 1 (days 3–5) and week 2 (days 8–10) (Figure 4, bottom). Group 25–100 missed significantly fewer trials during week 2 than in week 1, t(33.56) = 3.93, p < .001 (Figure 4, top). However, Group 100–25 did not miss significantly more trials in week 2, than in week 1 (Figure 4, top). Control animals responded proportionately with US predictability, but only Group 25–100 modulated their missed trials in accordance with US probability change. This may be because animals couldn’t afford to miss US delivery when it’s being delivered so infrequently.
3.3 CR Latency
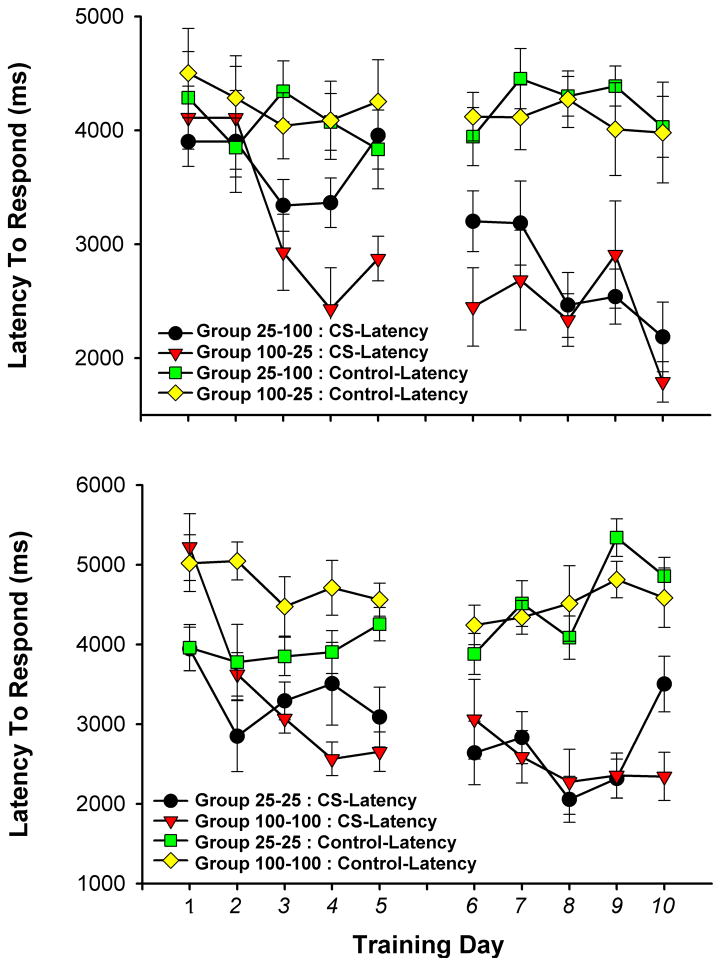
A repeated measures ANOVA revealed a significant effect of day, F(4,28) = 5.44, p < .001 and week, F(1,28) = 21.25, p < .001 for response latency, as all four groups exhibited a decrease in latency to head entry following the onset of the CS with training (Figures 5). However, analysis of latency to head entry after syringe activation (Control Latency) revealed no change over days, or weeks, indicating that animals did not predict trial onset from syringe activation (Figure 5).
Figure 5.
Average latency to first head entry after (CS ± SEM) for the control groups and the experimental. The average latency to first head entry after syringe activation (Control Latency ± SEM) is also plotted for all groups.
3.4 CR Profile
A repeated measures ANOVA revealed a significant effect of day, F(4,28) = 6.98, p < .001 and week, F(1,28) = 17.71, p < .001 for the peak proportion of head entries after the onset of the CS, as all groups increased head entry likelihood with training (Figure 6). A within groups contrast showed that Group 25–100 exhibited a significantly higher peak proportion of trials with head entries in week 2(days 8–10) than in week 1, (days 3–5) t(35.99) = 4.507, p < .001 (Figure 6, B.). Group 100–25 exhibited a significantly lower peak proportion of trials with head entries in week 2 than in week 1 t(31.59) = −2.463, p = .019 (Figure 6, D.).
3.5 Video Analysis of USV behaviors
The total number of USVs included in the video analysis was 1,895. Of the total number of calls, there were relatively few calls (256; 13.5%) during which the subject’s behavior was unable to be categorized (e.g., transitioning between categories). Of the total calls, the majority (1,095; 57%) occurred during non-movement. However, un-cued head entries into the dipper port, when the dipper was inactive, also coincided with a substantial portion (327;17.2%) of USVs. The remaining calls took place during vertical movements (93; 4.9%), horizontal movement (84; 4.4%), cued head entries with the dipper up (16; 0.84%), dipper approaches (15; 0.79%), or grooming (9; 0.47%)(Table 1).
A Chi-square analysis revealed no differences between 50-kHz and 22-kHz calls during motor behaviors. However, 22 kHz calls were found to be more common during non-movement, x2(1) = 157.529, p < .001. A high percentage of short 22-kHz frequency calls were observed during all behaviors, across all groups, regardless of sucrose probability or week. At no time did 50 kHz calls differ significantly across days, weeks, or between groups.
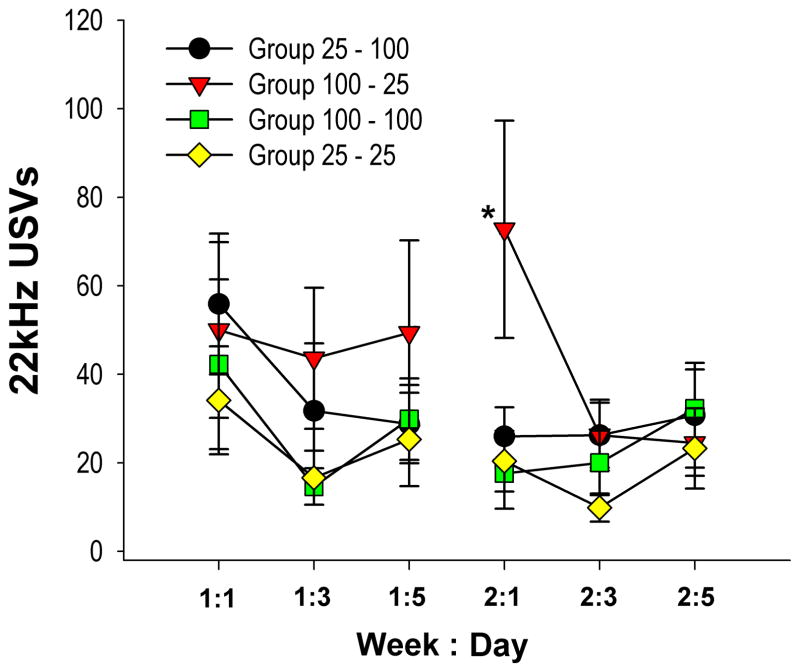
The number of 22-kHz frequency calls decreased for all groups over the two weeks of training (Figure 7). Group 25–100 emitted on average 38.79±13.34, 22-khz calls per day during week 1, with a decrease to 27.67 ± 8.9 during week 2. Group 100–25 emitted 47.67 ± 18.89 22-kHz calls during week 1, and 41.17 ± 13.10 during week 2, while Group 100–100 calls decreased from 28.92 ± 10.84 to 23.29±8.05. Finally, Group 25–25 calls decreased from 25.35 ± 9.63 during week 1 to 17.83 ± 6.38 during week 2.
Figure 7.
Average number of 22kHz vocalizations ± SEM for all four groups. Group (100–25) produced significantly more 22kHz USVs on day 1 of week 2, than any other group (* p < .01).
While all groups tended to reduce the number of 22 kHz USVs across training, the pattern exhibited by the downshifted group, Group 100–25, did not parallel that of the other groups. Group 100–25 produced more, although not significantly more, 22 kHz USVs on week 2, day 1 than it did on week 1, day 5. Nevertheless, a between groups comparison for week 2, day 1, revealed that Group 100–25 produced an acute, relative increase in 22 kHz calls, evidenced by a significant simple effect for recording session 4 (week 2, day 1), immediately following the probability change (p=.033). A Tukey corrected post-hoc comparison for group within this session revealed that subjects in Group 100–25 emitted significantly more 22 kHz USVs than subjects in each of the other groups [all |t(30) >2.36|, all p <0.01] (Figure 7).
To determine if 22kHz calling was directly linked to non-US head entries, week 2 day 1 data were examined in more detail for Group 100–25. The rate of 22kHz calling was calculated for the period of time between the first head entry after CS presentation and the subsequent head entry during CS/US trials and CS alone trials. There was no significant difference between rates of 22kHz calling following CS/Sucrose versus CS alone trials, t(5) = −.735, p = .495 (Figure 8). This suggests that in this paradigm, 22kHz USVs do not appear to be a direct or acute response to reward omission, but may reflect a more tonic, negative mood state.
Figure 8.
Average ± SEM “22kHz” calls per minute, for Group (100–25) on week 2, day 1. “Post Consumption” calls occur between each US head entry and the subsequent head entry. “Post Prediction Error” calls occur between each non-US head entry and the subsequent head entry.
4.1 Discussion
In the present task, the sucrose US was delivered 0.25 sec after CS activation. Accordingly, all rats learned to respond quickly to the CS predicting sucrose delivery. This effect was shown to be specific to the CS, and not just a function of increased head entry density (Figure 6). Latency to respond to a control stimulus (remote syringe activation assumed to be inaudible) did not change over days, and proportion of trials containing head entries was greater in the 10 seconds following the CS than the 10 seconds preceding it (Figure 6). This provides evidence that animals could not predict US trials based on syringe activation. In week 1, in accordance with US probability, the low probability groups (25–100 & 25–25) exhibited longer reaction times than the high probability groups (100–25 & 100–100), suggesting that the 100% groups utilized the highly predictable CS-US relationship to guide efficient responding. More over, the low probability control group (25–25) was significantly slower to produce the CR than Group 100–25 during both weeks. And, although group 100–25 exhibited the same latency to peak proportion of trials with head entries on week 1, day 5 as the rest of week 2, they exhibited a significantly lower peak proportion of trials with head entries on week 2, day 2 than week 1, days 3–5. Together, these results are consistent with the idea that temporal association between the CS and US was not affected by the downward probability shift.
In contrast, US probability exerted a large effect on the number of head entries animals emitted. Under conditions of low US probability, rats emitted significantly fewer head entries than during sessions with high US probability. Animals also altered their head entry frequency when a change in US probability occurred. If an animal’s sucrose probability was lowered, he responded less; if it was raised, he responded more relative to his pre-shift rate (Figure 3). By days 8–10, head entries for Group 100–25 were not significantly different from Group 25–25, and head entries for Group 25–100 were not significantly different from Group 100–100. Thus, the rate of conditioned responding was flexible, in that it could change based on the probability of the US.
Sucrose predictability also produced a large effect on the number of trials animals missed. The low probability control animals (Group 25–25) missed significantly more trials than high probability controls (Group 100–100). The number of trials animals missed changed when a change in US probability occurred. When Group 100–25 was downshifted to 25% US probability, they initially missed no more trials on Week 2 Day 1, than on Week 1 Days (3–5). However, by week 2, day 2 the number of missed trials for Group 100–25 was significantly higher than on week 1, days 3–5 (Figure 4). It is interesting to note that changes in average head entries and missed trials did not occur until the second day after a US probability shift (Figure 3 & 4).
An animal’s internal affective state can be difficult to derive. Traditional studies have relied on biological markers, such as cortocosterone release or responsiveness to anxiolytic drugs (Flaherty, [6] 1982, [7] 1996). Our experiment utilized ultrasonic vocalizations, which are highly correlated with affect in rats, to explore the relationship between affect and alterations of the probability of sucrose delivery following the CS. Although the present study elicited too few calls to draw a wealth of conclusions, one striking result stood out. When US probability following the CS was lowered from 100% to 25%, animals produced a transient bout of short 22-kHz USVs (Figure 7). This is consistent with previous reports of an emotional response that occurs after altering the learned relationship between a CS and US (reviewed in Flaherty, [6] 1982, [7] 1996).
22 kHz calling was examined in detail on the day of the shift, to determine if calling was temporally related to prediction errors generated by non-US trials. However, there was no significant difference between rates of 22kHz calling following “CS/Reward” versus “CS/Reward Omission” trials (Figure 8). This suggests that 22kHz calling may represent a tonic negative mood state, produced by prediction errors, as opposed to being a phasic response to CS alone trials. Most importantly, this result indicates that animals were emotionally affected by the downshift in US probability, which ultimately resulted in stabilizing behavior at levels indicative of learning about the less predictable relationship of the CS to the US
4.2 Conclusion
Animals have a flexible system for determining the importance of a particular cue, and its temporal relationship to other stimuli. A cue’s ability to produce a CR is weighted by US magnitude and the current predictive ability of the CS. The present findings add to substantial evidence indicating that shifts in CS-US relationships produce prediction errors, which alter emotional processes that may presage behavioral changes ([6] Flaherty, 1982; [14] Papini, 2003; [15] Pecoraro et al, 2009). The change in vocalizations observed in this study may be among the earliest indicators that an animal has detected a difference between current outcomes and expected outcomes. We also found that USVs are rarely produced during movements, making them a useful event for physiological analyses free of motor confounds. And, in behavioral experiments, they can provide information that cannot be derived from recording response-related behaviors alone. In combination with traditional behavioral measures (e.g. response rate or latency), ultrasonic vocalizations have helped to elucidate early stages of the CS-US learning progression, in particular when examining shifts in the predictability of the CS-US relationship.
Highlights.
Animals produce behavioral evidence of learning, when US probability is modulated.
Animals increase 22kHz (negative affective) USVs when US probability is downshifted
Most USVs occur during non-movement.
USVs are an ideal behavioral measure for movement sensitive experiments.
Acknowledgments
This study was supported by the National Institute on Drug Abuse Grants DA 029873, DA 023641 and DA 006886. The funders had no role in study design, data collection and analysis, decision to publish, or preparation of the manuscript.
We thank Patricia S Grigson for helpful comments, and Anthony Pawlak, Thomas Grace Sr., and Jacqueline D. Thomas for technical assistance.
Abbreviations
- USV
ultrasonic vocalization
- FM
frequency modulated
- FF
fixed frequency
- CS
conditioned stimulus
- US
unconditioned stimulus
- CR
conditioned response
A. Appendices
Table 1.
Eight behaviors were scored from three animals in each group. Table includes the total calls for all four groups.
| Vocalizations Emitted During Observed Behaviors | ||
|---|---|---|
| Behavior | Call Frequency | Total |
| Dipper Approach | 22-kHz | 5 |
| 50-kHz | 10 | |
| Grooming | 22-kHz | 4 |
| 50-kHz | 5 | |
| Head entry (dipper down) | 22-kHz | 301 |
| Midrange | 6 | |
| 50-kHz | 20 | |
| Horizontal Movement | 22-kHz | 17 |
| 50-kHz | 67 | |
| Head Entry (dipper up) | 22-kHz | 13 |
| Midrange | 2 | |
| 50-kHz | 1 | |
| Non-Movement | 22-kHz | 1022 |
| Midrange | 10 | |
| 50-kHz | 63 | |
| Vertical Movement | 22-kHz | 43 |
| Midrange | 2 | |
| 50-kHz | 48 | |
| Other/ unable to score | 22-kHz | 219 |
| Midrange | 4 | |
| 50-kHz | 33 | |
| TOTAL | 1895 | |
Footnotes
All coauthors have seen and approve of the contents of the manuscript. There are no financial interests to be disclosed nor is this article currently under review by another journal.
Publisher's Disclaimer: This is a PDF file of an unedited manuscript that has been accepted for publication. As a service to our customers we are providing this early version of the manuscript. The manuscript will undergo copyediting, typesetting, and review of the resulting proof before it is published in its final citable form. Please note that during the production process errors may be discovered which could affect the content, and all legal disclaimers that apply to the journal pertain.
References
- 1.Rescorla R, Wagner A. A theory of pavlovian conditioning: Variations in the effectiveness of reinforcement and non-reinforcement. Classical Conditioning II: Current Research and Theory. 1972:64–99. [Google Scholar]
- 2.Drew M, Zupan B, Cooke A, Couvillon P, Balsam P. Temporal control of conditioned responding in goldfish. Journal of Experimental Psychology: Animal Behavior Proccesses. 2005;31(1):31–39. doi: 10.1037/0097-7403.31.1.31. [DOI] [PubMed] [Google Scholar]
- 3.Knutson B, Burgdorf J, Panksepp J. High-frequency ultrasonic vocalizations index conditioned pharmacological reward in rats. Physiology and Behavior. 1999;66(4):639–643. doi: 10.1016/s0031-9384(98)00337-0. [DOI] [PubMed] [Google Scholar]
- 4.Berridge KC, Robinson TE. What is the role of dopamine in reward: hedonic impact, reward learning, or incentive salience? Brain Research Reviews. 1998;28(3):309–369. doi: 10.1016/s0165-0173(98)00019-8. [DOI] [PubMed] [Google Scholar]
- 5.Barker DJ, Root DH, Ma S, Jha S, Megehee L, Pawlak A, West MO. Dose-dependent differences in short ultrasonic vocalization emitted by rats during cocaine self-administration. Psychopharmacology. 2010;211(4):435–442. doi: 10.1007/s00213-010-1913-9. [DOI] [PMC free article] [PubMed] [Google Scholar]
- 6.Flaherty CF. Incentive contrast: a review of behavioral changes following shifts in reward. Animal Learning & Behavior. 1982;10:409–440. [Google Scholar]
- 7.Flaherty CF. Incentive Relativity. New York: Cambridge; 1996. [Google Scholar]
- 8.Blanchard RJ, Blanchard DC, Agullana R, Weiss SM. Twenty- two kHz alarm cries in presentation of a predator, by laboratory rats living in visible burrow systems. Physiology of Behavior. 1991;50:967–972. doi: 10.1016/0031-9384(91)90423-l. [DOI] [PubMed] [Google Scholar]
- 9.Brudzynski S. Pharmacological and behavioral characteristics of 22 khz alarm calls in rats. Neuroscience & Biobehavioral Reviews. 2001;25(7–8):611–617. doi: 10.1016/s0149-7634(01)00058-6. [DOI] [PubMed] [Google Scholar]
- 10.Brudzynski SM, Holland G. Acoustic characteristics of air-puff-induced 22kHz alarm calls in direct recordings. Neuroscience and Behavioral Reviews. 2005;29:1169–1180. doi: 10.1016/j.neubiorev.2005.04.007. [DOI] [PubMed] [Google Scholar]
- 11.Brudzynski SM, Pniak A. Social contacts and production of 50-kHz short ultrasonic calls in adult rats. Journal of Comparative Literature. 2002;116(1):73–82. doi: 10.1037/0735-7036.116.1.73. [DOI] [PubMed] [Google Scholar]
- 12.Burgdorf J, Knutson B, Panksepp J. Anticipation of rewarding electrical brain stimulation evokes ultrasonic vocalizations in rats. Behavioral Neuroscience. 2000;114(2):320–32. [PubMed] [Google Scholar]
- 13.Choi WY, Balsam PD, Horvitz JC. Extended habit training reduces dopamine mediation of appetitive response expression. J Neurosci. 2005;25(29):6729–33. doi: 10.1523/JNEUROSCI.1498-05.2005. [DOI] [PMC free article] [PubMed] [Google Scholar]
- 14.Papini MR. Comparative psychology of surprising nonreward. Brain, behavior, and evolution. 2003;62:83–95. doi: 10.1159/000072439. [DOI] [PubMed] [Google Scholar]
- 15.Pecoraro N, de Jong H, Dallman MF. An unexpected reduction in sucrose concentration activates the HPA axis onsuccessive post shift days without attenuation by discriminative contextual stimuli. Physiol Behav. 2009;96:651–661. doi: 10.1016/j.physbeh.2008.12.018. [DOI] [PubMed] [Google Scholar]


