

Abstract
SIRT1 (mammalian ortholog of the yeast silent information regulator 2) is a nicotinamide adenine dinucleotide (NAD)-dependent histone deacetylase belonging to the multigene family of sirtuins. Anecdotal and epidemiological observations provide evidence for beneficial effects of the calorie restriction mimetic resveratrol (RES), a SIRT1 activator in preventing cardiovascular diseases and cancer. Although SIRT1 possesses both tumorigenic and anti-tumorigenic potential, the molecular mechanisms underlying SIRT1-mediated tumor progression or inhibition are poorly understood. In this study, we investigated the role of SIRT1 in multiple human prostate cancer cell lines and prostate-specific PTEN knockout mouse model using RES. Androgen-independent prostate cancer cell lines (C42B, PC3, and DU145) express higher levels of SIRT1 than androgen-responsive (LNCaP) and non-tumorigenic prostate cells (RWPE-1). RES enhanced this expression without any significant effect on SIRT1 enzymatic activity. Inhibition of SIRT1 expression using shRNA enhanced cell proliferation and inhibited autophagy by repressing phosphorylation of S6K and 4E-BP1. These biological correlates were reversed in the presence of RES. Analysis of prostates from dietary intervention with RES showed a significant reduction in prostate weight and reduction in the incidence of high grade prostatic intraepithelial neoplastic (HGPIN) lesions by ~54% with no significant change in body weight. Consistent with the in vitro findings RES intervention in the PTEN knockout mouse model was associated with reduction in the prostatic levels of mTOR Complex 1 (mTORC1) activity and increased expression of SIRT1. These data suggest that SIRT1/S6K-mediated inhibition of autophagy drives prostate tumorigenesis. Therefore, modulation of SIRT1/S6K signaling represents an effective strategy for prostate cancer prevention.
Keywords: Prostate cancer, SIRT1, resveratrol, PIN, autophagy
Introduction
SIRT1 (mammalian ortholog of the yeast silent information regulator 2) is a nicotinamide adenine dinucleotide (NAD)-dependent histone deacetylase belonging to a multigene family of sirtuins that contains seven members with distinct and diverse functions. There is increasing evidence that SIRT1 is a longevity protein that mediates the process of aging (1). SIRT1 has been shown to be involved in: (i) mediating cellular metabolism and energy production through regulation of PGC-1α (peroxisome proliferator-activated receptor gamma coactivator 1-α), FOXO1 (Forkhead box protein O1) activity, and insulin sensitivity; (ii) modulation of inflammatory responses through deacetylation of NFκB subunit p65 and modulation of T cell tolerance in response to various stimuli; (iii) regulation of cell growth through inhibition of mTOR (mammalian target of rapamycin) activity; and (iv) protection from apoptosis in response to genotoxic stresses (1–5). Collectively these data suggest that SIRT1 regulates a wide variety of cellular processes including cell growth, survival, proliferation, apoptosis, and autophagy. Consistent with these findings, elevated expression of SIRT1 has been observed in a number of cancers and higher levels of SIRT1 are associated with poor prognosis (6–11). Overexpression of SIRT1 has been shown to be oncogenic in cell culture models (12). On the other hand, some preclinical data indicate that SIRT1 possesses strong tumor suppressor activity (13–18): (i) increased SIRT1 expression delays development of sarcoma and lymphoma in p53-heterozygous mice; (ii) SIRT1 transgenic mice are protected from metabolic syndrome-driven liver carcinogenesis; (iii) whole body or tissue-specific expression of SIRT1 in genetically engineered animal models established protection from various abnormalities including cancer, cardiovascular, and metabolic syndrome-associated diseases; and (iv) disruption of SIRT1 in the prostate results in the formation of prostatic intraepithelial neoplastic (PIN) lesions. Interestingly, although SIRT1 expression has been reported to be elevated in prostate tumors, it is not entirely clear whether SIRT1 is functionally active in this situation. Overall, these data suggest that SIRT1 could function to either promote or suppress tumorigenesis and indicate a strong need for clarification of its role in tumor development.
Resveratrol (3,4’-trihydroxystilbene; RES), a natural product from grapes that is present in significant concentrations in red wine, has the ability to inhibit growth and induce apoptosis in wide variety of tumor cell lines and has been reported to activate SIRT1 (19). The potential efficacy of RES as a chemopreventive agent for cancer has attracted considerable interest because of studies demonstrating its antitumorigenic activity both in vitro and in vivo in various tumor models, including prostate. Using the transgenic adenocarcinoma of a mouse prostate (TRAMP) model that develops spontaneous prostate tumors, dietary administration of 625 mg/kg RES for 7 and 23 weeks was shown to reduce the incidence of adenocarcinoma 7.7-fold (20). Another study examined the efficacy of liposomal encapsulated RES (50 mg/kg) in a limited number of PTEN knockout mice (n=3) and showed reduction of adenocarcinoma (21). However, the rationale for using encapsulated RES is not clear and none of these studies addressed the ability of RES to prevent the development or progression of high-grade prostatic intraepithelial neoplastic (HGPIN) lesions. Given the high frequency of HGPIN lesions in men in their 6th and 7th decades (41% and 61%, respectively), a better strategy may be the use of RES to prevent the progression of HGPIN lesions, which are putative precursors of prostate cancer. (22). However, to the best of our knowledge no studies have explored the efficacy of RES for preventing or delaying the development of PIN lesions. Given the preponderance of PTEN mutations in both primary (~30%) and advanced metastatic prostate tumors (~60–70%), we explored the efficacy of RES intervention using a prostate-specific PTEN knockout mouse model that develops PIN and prostate cancer (23). We provide the first demonstration that RES intervention reduces the incidence of HGPIN lesions and prostate weight with no significant change in body weight, suggesting that SIRT1 might be a novel therapeutic target for prostate cancer management. In addition, we show that RES inhibits proliferation of both androgen-responsive and androgen-independent prostate cancer cells, primarily through induction of SIRT1-mediated autophagy via inhibition of the phosphorylation of S6K and 4E-BP1, thus implicating the Akt/mTOR signaling pathway in the function of SIRT1 as a tumor suppressor.
Materials and methods
Chemicals
Resveratrol was purchased from Sigma-Aldrich (St. Louis, MO), dissolved in DMSO as 10 mmol/L stock, and stored in aliquots at −20°C. Resveratrol purchased from Lalilab, Inc. (Durham, NC) was used in the preparation of diet for animal studies.
Cell culture studies
Human prostate cell lines RWPE-1, LNCaP, PC3, and DU145 were purchased from American Type Culture Collection (ATCC). RWPE-1 cells were cultured in keratinocytes serum-free media (K-SFM) supplemented with 0.05 mg/mL bovine pituitary extract and 5 ng/mL epidermal growth factor, plus 100 units penicillin and 100 µg streptomycin (hereafter referred to as antibiotics); LNCaP and DU145 cells were grown in RPMI 1640 media containing 10% FBS and antibiotics; PC3 cells were grown in F12-K media containing 10% FBS plus antibiotics; C42B cells obtained from Dr. Thambi Dorai (Department of Biochemistry and Molecular Biology, New York Medical College, NY) were grown in T-media containing 5% heat inactivated FBS plus antibiotics. Cells were treated with the indicated reagents when they were approximately 80% confluent as described previously (24). The authors did not authenticate RWPE-1, LNCaP, PC3, and DU145 cells obtained from ATCC and C42B from Dr Dorai.
q-PCR analysis
Total cellular RNA was isolated using Trizol reagent (Invitrogen, Carlsbad, CA) according to the manufacturer’s recommendations. A two-step RT-PCR method was used to synthesize single stranded cDNA with a superscript VILO cDNA synthesis kit (Invitrogen). Target genes were analyzed using 7300 Applied Biosystems (Foster City, CA) with SYBR Green 1 dye. The primers used were as follows: SIRT1 (NM_012238), forward ACCCAGAACATAGACACGCTGGAA and reverse TCTCCTCGTACAGCTTCACAGTCA; β-actin (NM_001101), forward GGCACCCAGCACAATGAAGATCAA and reverse TAGAAGCATTTGCGGTGGACGATG. PCR reactions were performed in triplicate and relative mRNA expression was normalized to β-actin and control sample mRNA levels respectively. The specific amplification of target genes was validated using a dissociation curve. q-PCR was performed three independent times.
Establishment of stable DU145 and PC3 SIRT1 knockdown cells
Puromycin and lentiviruses expressing control or SIRT1 shRNA pool were purchased from Santa Cruz Biotechnology (Santa Cruz, CA). The optimal concentration of puromycin for selection and maintenance of SIRT1 knockdown cells was titrated before use following the manufacturer’s instructions. The procedures for lentivirus transduction were as follows: On day 1, 2.5 × 10⁴ DU145 or PC3 cells and 1 mL of growth media were plated in 12 well plates and incubated overnight. On day 2 the cells were gently washed with 1× Dulbecco’s phosphate buffered saline (DPBS). Lentiviruses diluted in 0.5 mL of growth media (MOI 10) plus 5 µg/mL polybrene were added to the monolayer of cells. After 24 h infection the viruses were removed and the cells were washed twice with 1× DPBS and incubated with fresh growth media for another 24 h, followed by addition of 1 µg/mL puromycin for SIRT1 knockdown cell selection and maintenance. In every 3 days the media was replaced with fresh media containing 1 µg/mL puromycin. The efficiency of SIRT1 knockdown was verified using western blotting and q-PCR.
SIRT1 activity assay
Cell lysates were prepared as described previously (23). Briefly, the cells were lysed with lysis buffer (50 mmol/L Tris-HCl [pH 7.4], 0.5% Triton X-100 and 150 mmol/L NaCl) containing 1% protease inhibitor cocktail on ice and centrifuged at 12000 g for 15 min. The supernatants were taken as cell lysates. Ten micrograms of the cell lysate was used for the SIRT1 activity assay with the SIRT1 fluorimetric drug discovery kit (AK-555) according to the vendor’s protocol (Enzo Life Science Inc., Farmingdale, NY). SIRT1 enzyme activity was calculated after subtracting the background in the presence of suramin, an inhibitor of sirtuin activity.
Immunoblot analysis and Akt kinase activity assay
Whole cell lysates were prepared and immunoblot analysis was performed as described previously (24). Primary antibodies against phospho-PDK1, phospho-Akt (S473), phospho-Akt (T308), phospho-mTOR, phospho-S6K, total Akt (pan), total mTOR, phospho-GSK3α/β, phospho-FOXO3α, phospho-4E-BP1 (Ser65), total FOXO3α, and LC3 were obtained from Cell Signaling Technology (Beverly, MA) and used at a dilution of 1:500. Monoclonal antibody against β-actin was purchased from Sigma-Aldrich and used at a dilution of 1:5000. Antibody against SIRT1 was obtained from ABCAM Inc. (Cambridge, MA) and used at a dilution of 1:1000. An ECL method was used for detection of specific proteins and the images were processed and analyzed by SYNGENE gel imaging system (SYNGENE Inc., Frederick, MD).
Colony formation and MTT assay
For colony formation, PC3 and DU145 cells stably expressing scrambled or SIRT1 shRNA were seeded in 12-well plates at a density of 200 cells per well in 2 ml of growth media and incubated for 12 days. On day 12, the colonies were stained with crystal violet and the visible colony numbers were counted. MTT assay was performed as follows: PCA cells were seeded in triplicate in 96-well plates at a density of 4 × 10³ cells/well in 100 µL growth media and incubated overnight. The cells were treated with increasing doses of RES for different time periods and cell proliferation was measured as previously described (24).
Cell survival and growth analyses
Cells were plated in 6-well plates at a density of 5 × 10⁴ cells/well in triplicate and the cell number was counted at 24, 48, 72, and 96 h using the trypan blue exclusion method. Apoptosis (measured using Annexin V staining and TUNEL assay), DNA fragmentation, and cell cycle distribution changes were determined as described previously (24).
Autophagy analysis
Autophagy was measured by fluorescence microscopy with the Cyto-ID™ autophagy detection kit (Enzo Life Science Inc., Farmingdale, NY) following the manufacturer’s instructions. Briefly, cells were plated in 24-well plates. After treatment the medium was carefully removed, 100 µL dual detection reagent was added, and the cells were incubated at 37°C for 30 min in the dark. The cells were then carefully washed twice with 1× assay buffer and stained cells were imaged under a Nikon fluorescence microscope installed with NIS element software.
Animal Studies
Animal care and handling was conducted in accordance with established humane guidelines and protocols approved by the Institutional Animal Care and Use Committee University of Texas Health Science Center at San Antonio. Homozygous male prostate-specific PTEN knockout mice were generated by custom breeding and obtained from Jackson Laboratories (The Jackson Laboratories, Bar Harbor, ME). All mice were maintained in a climate-controlled environment with a 12-h light/dark cycle. Diet and water were supplied ad libitum. For in vivo experiments, a pelleted AIN 76A diet containing different doses of RES (0.1% and 2%) was prepared at Dyets, Inc. (Bethlehem, PA) and administrated to 4- to 5-week-old animals. Standard AIN 76A without RES was used as the control diet. Animals were monitored for body weight changes weekly and food consumption was measured. After 14 weeks of treatment the animals were euthanized and necropsy was conducted. At necropsy, animals were examined for gross organ abnormalities. Prostate tissue or tumors were harvested, weighed, and fixed in 10% neutral buffered formalin. Tumors were paraffin-embedded, sectioned, placed on poly-lysine slides and stained with H&E to visualize cell nuclei and cytoplasm. Prostate lesions were scored using an established grading system based on Park et al. and Shappell et al. (25–26). The slides were reviewed using a light microscope in a blinded fashion.
Immunohistochemical analysis
Immunohistochemical analysis was performed according to established protocols. Briefly, sections from paraffin-embedded tissues were deparaffinized and rehydrated. For antigen retrieval we used sodium citrate pH 6 buffers with heat under pressure. The sections were blocked with 3% hydrogen peroxide TBS buffer and 10% BSA TBS buffer. Antibodies used for staining were: pStat3 monoclonal rabbit, pS6Kinase monoclonal rabbit (Cell Signaling Technology); SIRT1 polyclonal rabbit (Santa Cruz Biotechnology); Ki67 monoclonal rabbit (Abcam). Negative control slides were incubated in Rabbit Universal Negative Control (DAKO Corp Carpenteria, CA). Slides were developed using a polymer detection system (Biocare Medical Concord, CA) and a DAB Chromogen System (DAKO).
Immunohistochemical evaluation
We evaluated the immunohistochemical staining using a semiquantitative scoring method based on proportion (assessment based on number of cells staining none to 100% positive) and intensity of staining (negative to strong) as described by us before (24).
Statistical analysis
All numerical results are expressed as means ± SD derived from three independent experiments, unless otherwise stated. Statistical analyses were performed using one-way ANOVA and statistically significant differences were established as p < 0.05.
Results
Expression of SIRT1 in human prostate cancer cell lines
To investigate the role of SIRT1 in prostate cancer, we investigated SIRT1 expression in the human prostate cancer cell lines RWPE-1, LNCaP, C42B, PC3, and DU145. Comparison of SIRT1 mRNA expression among these cell lines showed that SIRT1 mRNA levels were higher in both androgen-responsive LNCaP and androgen-independent PC3 and DU145 cells than in the non-tumorigenic RWPE-1 cell line (figure 1A). Following treatment with RES, the expression of SIRT1 mRNA significantly increased as a function of time up to 48 h in all cell lines, with DU145 cells showing the greatest level of induction (10-fold; figure 1B). Consistent with this observation, androgen-independent PC3 and DU145 cells also showed higher expression levels of SIRT1 protein (more than 20-fold compared with RWPE-1; figure 1C). However, RES treatment decreased the protein levels of SIRT1 selectively in PC3 and DU145 cells with no significant change in LNCaP, RWPE-1, and C42B cell lines (figure 1D and data not shown). Interestingly although we did not observe any significant change in the levels of SIRT1 protein in DU145 cells at 48 h, we saw an increase at 24 h time point under these experimental conditions. On the other hand RES treatment resulted in decreased levels of SIRT1 protein in PC3 cells both at 24 and 48 h time points. The precise reasons for the observed discrepancy between RNA expression and protein levels is not clear; however we speculate that this could be due to increased mRNA stability or reduced translation efficiency, for example through a block in the protein translation machinery. Next, we investigated whether the observed alterations in SIRT1 expression are reflected by changes in SIRT1 enzymatic activity using PC3 and DU145 cells, which showed the highest expression of SIRT1. Although previous studies had shown that RES is an activator of SIRT1 we found that RES did not activate SIRT1 activity under our experimental conditions (figure 1E). A recent study indicates that RES may not be a direct SIRT1 activator (27). Taken together, our data show that: (i) expression levels of SIRT1 mRNA are elevated in androgen-independent prostate cancer cell lines; (ii) RES further enhances SIRT1 mRNA expression; (iii) RES selectively influences SIRT1 protein expression in PC3 cells; and (iv) RES had no effect on SIRT1 enzymatic activity.
Figure 1.
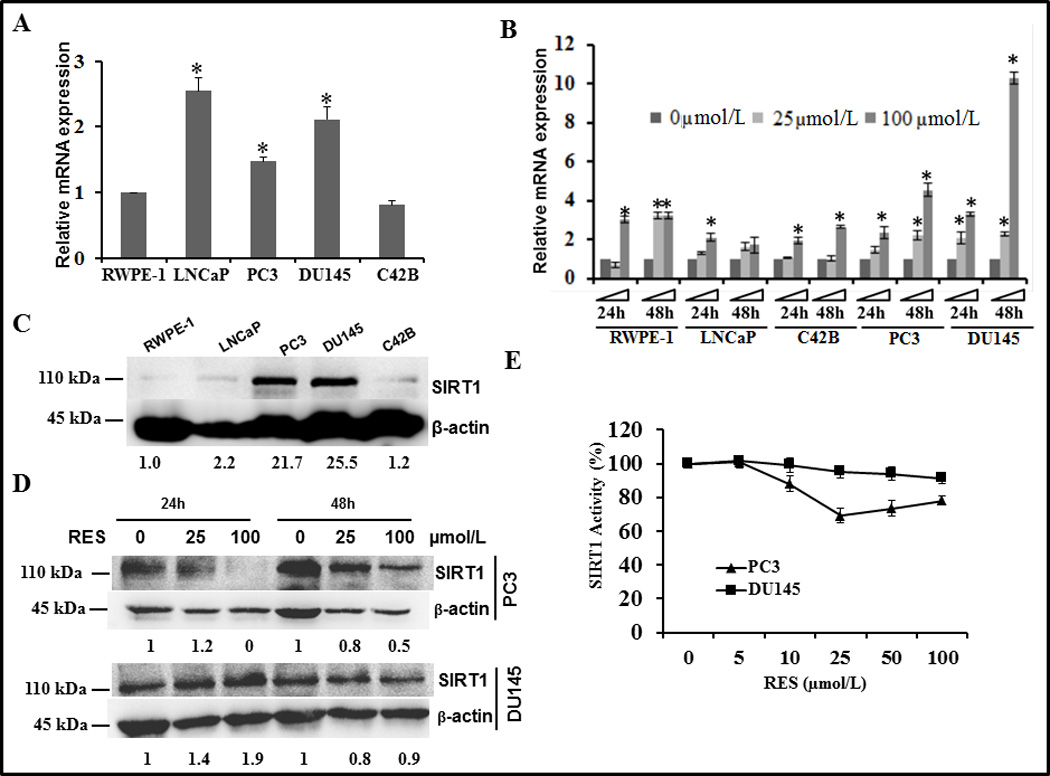
SIRT1 expression and activity in human prostate cancer cell lines and cellular response to resveratrol (RES). Total cellular RNA was isolated from the indicated prostate cancer cell lines following treatment without or with 25 and 100 µmol/L RES for 24 and 48 h to investigate changes in the expression of SIRT1 mRNA by q-PCR. Under identical experimental conditions, whole cell protein extracts were prepared from cells treated with solvent control (C) or with RES (D) to determine the levels of SIRT1 protein by immunoblotting. Data presented here are mean ± SD of three independent experiments with respect to non-tumorigenic RWPE-1 cells. Statistically significant differences are indicated by an asterisk. (E) SIRT1 enzymatic activity was measured in lysates prepared from PC3 and DU145 cells treated with the indicated concentrations of RES for 24 h using a SIRT1 fluorimetric drug discovery kit. SIRT1 enzyme activity was calculated after subtracting the background level in the presence of suramin to inhibit sirtuin activity.
Effect of RES on prostate cancer cell proliferation
Given the different expression levels of SIRT1 in various prostate cancer cell lines, we tested whether the antiproliferative effects of RES depend on SIRT1 status. Non-tumorigenic RWPE-1 cells were the most sensitive to RES, followed by DU145 and PC3 (figure 2A–C). Among the cell lines tested, androgen-responsive LNCaP cells and an androgen-independent sub line C42B were relatively resistant, requiring RES treatment for 72 h to achieve an antiproliferative effect (figure 2D&E). However, 50% growth inhibition could not be achieved in LNCaP cells even with RES concentrations as high as 100 µmol/L. Interestingly, RES showed a biphasic effect in that lower concentrations (<5 µmol/L) induced proliferation while higher concentrations had an inhibitory effect. Specifically, proliferation of RWPE-1 cells was increased approximately 30% by 5 µmol/L RES (figure 2A) and DU145 and PC3 cells displayed a 30% and 80% increase in cell proliferation respectively after 72 h RES treatment compared with no treatment (figure 2B and C). At concentrations higher than 50 µmol/L, RES induced 40–60% inhibition of cell proliferation. However, LNCaP cells exhibited resistance and even showed a marginal increase in cell proliferation (figure 2D) at all concentrations tested. RES had no effects on proliferation of C42B cells up to 48 h but showed significant inhibition at 72 h (figure 2E). It is noteworthy that cell lines that express higher basal levels of SIRT1 (PC3, DU145, and LNCaP) were either resistant to RES or required higher concentrations (up to 100 µmol/L) to inhibit cell proliferation. On the other hand, in cell lines with low levels of SIRT1 (RWPE-1), RES showed significant dose-dependent inhibition of cell proliferation at concentrations less than 25 µmol/L. It is noteworthy that low concentrations of RES (<10 µmol/L) have been shown to activate AMPK without decreasing the AMP/ATP ratio whereas higher concentrations of RES activate AMPK by decreasing energy and increasing the AMP/ATP ratio. Therefore the observed concentration-dependent bi-phasic effects of RES under our experimental conditions could be due to alteration in the AMP/ATP ratio (28).
Figure 2.
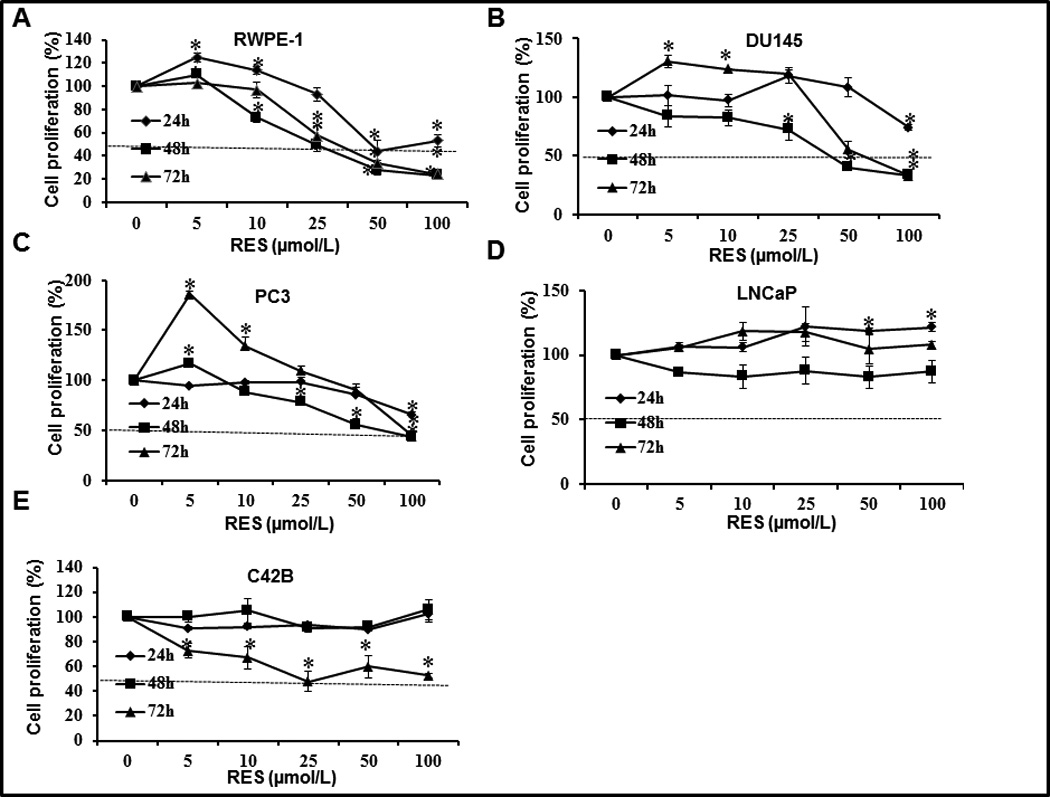
Effect of RES on proliferation of human prostate cancer cell lines. The indicated prostate cancer cells were plated in 96-well plates at a density of 4 × 10³ cells/well. Following overnight incubation at 37°C, cells were treated with the indicated concentrations of RES. Cell proliferation was measured after 24, 48, and 72 h using the Cell Titer Non-radioactive cell proliferation assay. The horizontal line indicates the concentration required to achieve 50% inhibition of proliferation under the experimental conditions.
RES inhibits prostate cancer cell growth through activation of SIRT1
To gain insight into the relationship between SIRT1 and RES-mediated inhibition of cell proliferation we used pharmacological (nicotinamide) and genetic approaches (shRNA) to inhibit SIRT1. As shown in (supplementary figure SF1) nicotinamide treatment alone had no significant effect on proliferation of PC3 cells; however it caused a significant reduction of 15% in DU145 cells. RES alone inhibited proliferation at concentrations of 50 µmol/L and higher (figure 3A). However, after pretreatment with 300 µmol/L nicotinamide, a similar level of inhibition was achieved with lower concentrations of RES (10 µmol/L) suggesting that inhibition of SIRT1 sensitized these cells. shRNA efficiently and consistently knocked-down the expression of SIRT1 by more than 50% and 90% in PC3 and DU145 cells, respectively (figure 3B&C). Cell viability assays showed that the growth rate of SIRT1 knockdown cells was enhanced and RES treatment had no effect on growth inhibition, compared with control cells transfected with scrambled shRNA (figure 3D). Cells transfected with control-scrambled shRNA showed inhibition of proliferation in response to RES treatment (figure 3E), consistent with data presented in figure 2. However, SIRT1 knockdown resulted in a higher proliferation rate in both PC3 and DU145 cells, and RES had an inhibitory effect in the knockdown cells (figure 3E). Interestingly using the anchorage-independent growth assay, we did not observe any significant difference in the number of colonies between scrambled and SIRT1 shRNA transfected cells. However the important observation was that there was an increase in the size of colonies formed in SIRT1 knockdown PC3 and DU145 cells compared with cells transfected with scrambled shRNA (figure 3F), although DU145 SIRT1 knockdown cells formed larger colonies than PC3 cells. RES treatment (50 µmol/L) completely abolished colony formation in both cell lines independent of SIRT1 status (data not shown).
Figure 3.
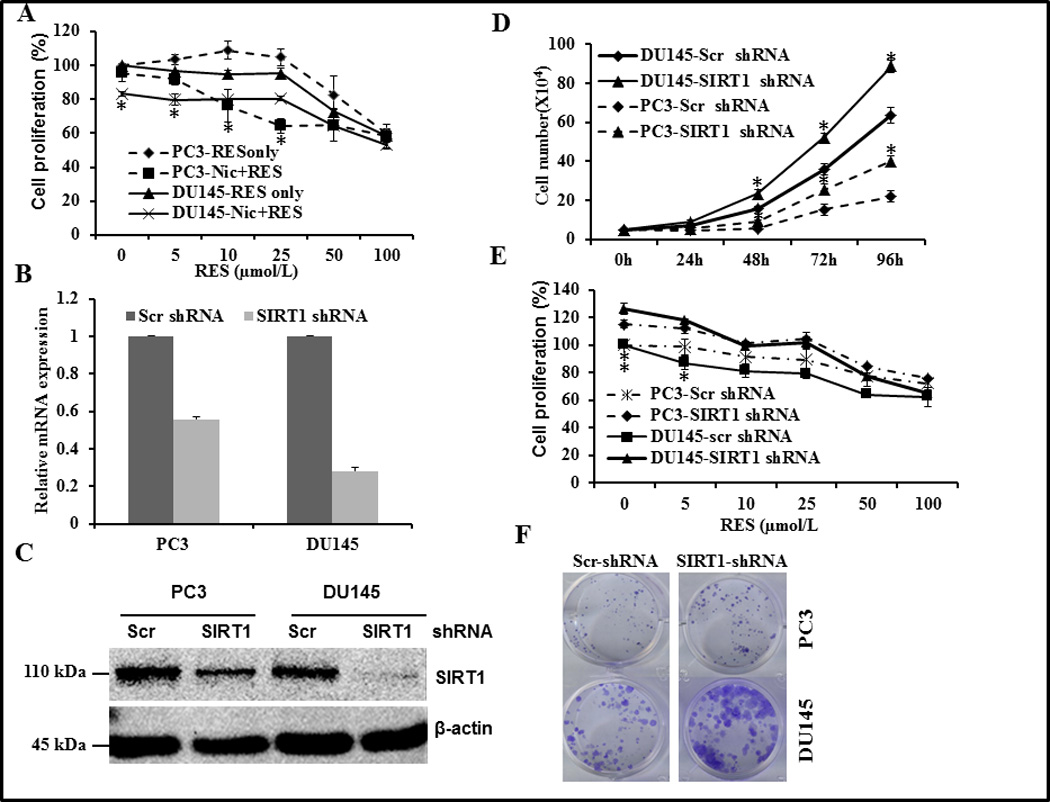
Effect of pharmacological and genetic inhibition of SIRT1 on proliferation of PC3 and DU145 cells. (A) Androgen-independent PC3 and DU145 prostate cancer cells were plated in 96-well plates at a density of 4 × 10³ cells/well. Following overnight incubation at 37°C, cells were pre-treated with 300 µmol/L nicotinamide for 24 h followed by treatment with the indicated concentrations of RES. Cell proliferation was measured after an additional 24 h as described in figure 2. Asterisk represents statistically significance difference between nicotinamide plus RES and RES alone. (B–E) Stable clones were generated using a scrambled or SIRT1 shRNA pool as described in Methods. The efficiency of SIRT1 knockdown was verified using q-PCR (B) and western blotting (C). PC3 (A) and DU145 (B) cells stably expressing scrambled or SIRT1 shRNA were plated into 6-well plates at a density of 5 × 10⁴ cells per well and incubated for the indicated time. Cell numbers were counted using the trypan blue exclusion method (D). Cell proliferation was measured as in figure 2 (E). PC3 and DU145 cells stably expressing scrambled or SIRT1 shRNA were plated on12-well plates at a density of 200 cells/well and incubated for 12 days with media changes every 48–72 h. Colonies were visualized by crystal violet staining (F). Data shown are representative of three independent experiments (mean ± SD).
These data suggest that RES-induced growth inhibitory effects are mediated both by SIRT1-dependent and independent pathways. The observed increase in RES-induced inhibition of proliferation in the presence of nicotinamide could be due to synergistic or additive inhibitory activity of RES and nicotinamide. However, the role of other SIRT family members in mediating RES-induced growth inhibitory effects cannot be ruled out. Taken together, our results and published findings on the prostate model indicate a tumor-suppressive role for SIRT1 and suggest that activation of SIRT1 could be a therapeutic strategy for treatment of prostate cancer.
RES induces autophagy in prostate cancer cells
Numerous mechanisms have been shown to mediate the antiproliferative effects of RES in various cell types (29–32). RES has been shown to modulate the expression of genes involved in various processes including apoptosis, survival, and inflammation (including survivin, Akt, NFκB, and mitogen activated protein kinase (MAPK)). Despite numerous studies, the precise mechanism of RES-mediated growth inhibition and the role of SIRT1 remain unclear. We first investigated whether the observed growth inhibitory effects of RES are associated with induction of apoptosis, autophagy, or both. DU145 cells that were stably transfected with SIRT1shRNA or scrambled control were treated with different doses of RES for 24 h. RES treatment resulted in a marginal increase in apoptosis (3% to 8%) irrespective of the presence or absence of SIRT1, suggesting that RES-induced apoptosis is independent of SIRT1 (supplementary figure SF2). Similar results were obtained using independent approaches including DNA fragmentation and TUNEL assay (data not shown). In addition to apoptosis, cancer cells can die through the process of autophagy. Since we observed only a marginal increase in apoptosis, we investigated whether RES inhibits prostate cancer cell proliferation through induction of autophagy using a CytoID autophagy detection kit. Autophagosome formation was observed under the fluorescence microscope as dot-like structures distributed within the cytoplasm and in the perinuclear region (figure 4A). The number of these structures increased in the presence of RES, indicating induction of autophagy. RES-induced autophagosome formation was higher in DU145 cells than in any other cell line tested. In addition, we analyzed the expression levels of LC3 II and I using immunoblotting. As shown in figure 4B, RWPE-1 and C42B cells contained only the cleaved faster-migrating form of LC3 II, indicating high basal levels of autophagy. We observed increased formation of cleaved LC3II in LNCaP cells in response to RES treatment, indicating induction of autophagy. On the other hand, DU145 cells expressed only LC3 I, the intensity of which decreased following treatment with RES (figure 4B). It is, however, possible that we did not detect cleaved LC3 II in these cells despite autophagosome formation because of conjugation of LC3 to the autophagosome membrane, which in turn could be targeted for degradation. Knockdown of SIRT1 in DU145 cells significantly attenuated RES-induced autophagy as evidenced by decreased autophagosome formation (figure 4C). These data suggest that SIRT1 plays an important role in RES-induced autophagy in prostate cancer cells.
Figure 4.
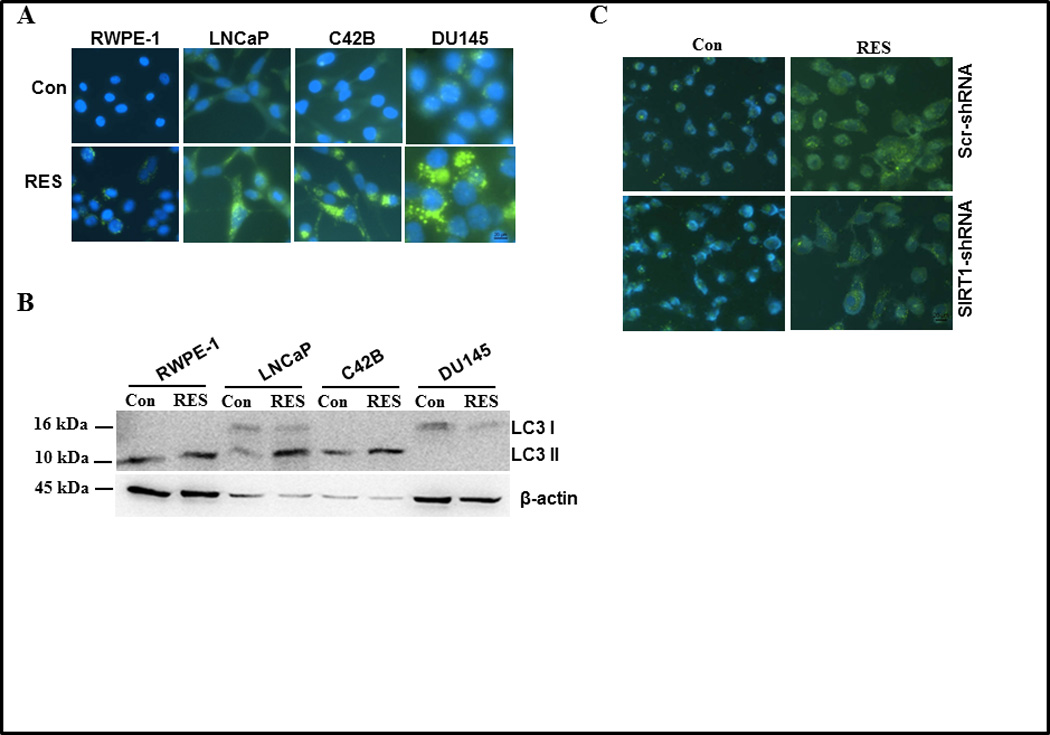
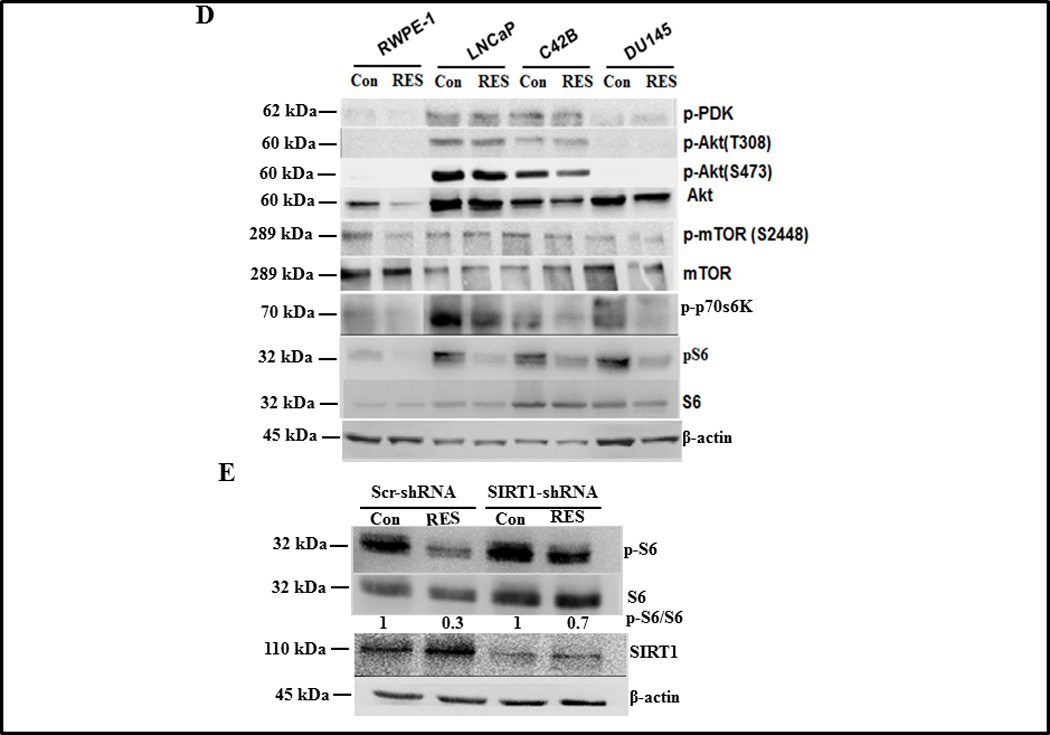
Effect of RES on autophagy of prostate cells. Autophagy was measured in the indicated prostate cell lines following treatment with either solvent control or 50 µmol/L RES for 24 h using a Cyto-ID™ autophagy detection kit (A) or by western blot analysis of LC3 cleavage on 16% SDS-PAGE (B). DU145 cells expressing scrambled or SIRT1 shRNA were treated with 50 µmol/L RES for 24 h. Autophagic cells were detected with Cyto-ID™ autophagy detection kit (C) and Akt/mTOR signaling components were analyzed using western blotting (D). DU145 cells expressing scrambled or SIRT1 shRNA were treated with 50 µmol/L RES for 24 h and SIRT1 and pS6K levels were measured using immunoblotting (E).
RES induces autophagy through SIRT1/S6K
Given the known roles of Akt/mTOR signaling in mediating autophagy (33–36), we examined the impact of RES on Akt/mTOR signaling by analyzing the levels and activity of Akt/mTOR signaling components in prostate cancer cells. RES treatment had no effect on Akt phosphorylation (T308 or S473) in LNCaP and C42B cells. Consistent with the wild type status of PTEN we did not detect phosphorylated Akt in RWPE-1 or DU145 cells (figure 4D). Most significantly, we observed inhibition of phosphorylated S6K in response to RES treatment in all cell lines tested (figure 4D). We next explored whether knockdown of SIRT1 expression in DU145 cells enhanced the level of phosphorylated S6K. To test the relationship between SIRT1 and pS6K, we analyzed levels of S6K and pS6K in DU145 cells in which SIRT1 was silenced. As shown in figure 4E, RES treatment decreased the level of pS6K in control scrambled knockdown cells and SIRT1 knockdown partially (~43% inhibition) rescued the RES-induced down-regulation of pS6K. These data demonstrate that the reduced production of pS6K in response to RES treatment is mediated by SIRT1 and implicate pS6K as a key player in RES-mediated growth inhibitory effects. It is not clear how the deacetylase SIRT1 reduces pS6K expression, although S6K can be regulated by acetylation/deacetylation (37). Moreover, inhibition of SIRT1 by nicotinamide enhances S6K acetylation, suggesting a potential role for SIRT1 in mediating S6K deacetylation. RES has also been demonstrated to function as acetylation inhibitor (38). Although we have not directly demonstrated that S6K can undergo acetylation under our experimental conditions, we speculate that SIRT1-mediated deacetylation could trigger dephosphorylation of S6K. These observations suggest that RES inhibits prostate cancer cell growth through induction of programmed cell death (a combination of apoptosis and autophagy) via SIRT1-mediated inhibition of S6K phosphorylation. We also detected phosphorylated 4E-BP1, GSK3α/β and FOXO3α in LNCaP and C42B cells, levels of which were not altered in response to RES treatment (supplementary figure SF 3). Inactivated (phosphorylated) FOXO3α and GSK3α/β promote cell survival by preventing the up-regulation of genes involved in apoptosis and autophagy. This could explain why LNCaP and C42B cells were resistant to RES-mediated inhibition of cell proliferation.
RES intervention prevents development or progression of HGPIN lesions in prostate-specific PTEN knockout mice
The PI3K signaling pathway that mediates cell survival plays a central role in tumorigenesis. The levels of PI-3 phosphates in a cell are regulated through the activity of dual specificity tyrosine-threonine/PI-3 phosphatase MMAC/PTEN (mutated in multiple advanced cancers/phosphatase and tensin homologue detected in chromosome ten). PTEN prevents accumulation of PI-3 phosphates and thus attenuates PI-3 kinase signaling. Studies have shown that PTEN is an important tumor suppressor protein that is lost in a large number of human cancers including prostate; for example, approximately 40% of primary and 70% of metastatic prostate tumors have genetic alterations in PI3K signaling pathway through loss of PTEN. Given the connection between Akt/NFκB and SIRT1, we tested the efficacy of RES in inhibiting prostate cancer development using the prostate-specific PTEN knockout mouse model (23). PTEN knockout mice were generated by deleting PTEN specifically in the prostate epithelium and develop prostate tumors akin to human prostate carcinogenesis (23). These mice develop murine PIN (mPIN) lesions by 6 weeks of age that progress to invasive cancer by 9–29 weeks and metastatic cancer by 12–29 weeks (23). Treatment of 4- to 5-week-old PTEN knockout mice with RES for 14 weeks resulted in significant histopathological alterations in the prostate (figure 5A). Specifically, prostate from 11 out of 15 (73%) animals receiving the control diet showed abnormal histological features including: (i) enlarged and dilated acini lined by multilayered nuclei of variable size; (ii) mild to moderate nuclear pleomorphism and increased mitotic activity; (iii) presence of cribriform areas; (iv) thinned stroma with scattered inflammatory cells. These characteristics are consistent with high-grade mPIN lesions (26). In contrast, only 6 out of 15 mice receiving low-dose RES and 5 out of 12 mice receiving high-dose RES showed such lesions (Table 1). Prostate from these animals showed dilated acinar, often lined by a single layer of cells with bland nuclei with small nucleoli. In addition, mitotic, necrotic, and apoptotic activity was absent in these lesions. Cribriform patterns were present in some areas and the adjacent stroma was loosely cellular. These features are consistent with low-grade mPIN lesions. Cumulative analysis of these data indicated that RES intervention resulted in a decreased incidence (~54%) of grade III HGPIN lesions irrespective of the dose (Table 1). In addition, RES intervention resulted in a significant decrease in the weight of the genitourinary complex at the high dose (2%), but not at the low dose (0. 1%) despite pathological changes at both doses (figure 5B). Importantly, RES intervention had no toxic effects on these mice, as evidenced through negligible changes in body weight (supplementary figure SF4). Further we did not observe any significant differences in their food consumption (supplementary figure SF4). This is the first demonstration that RES can inhibit PIN lesions in an animal model that is highly relevant to human pathogenesis.
Figure 5.
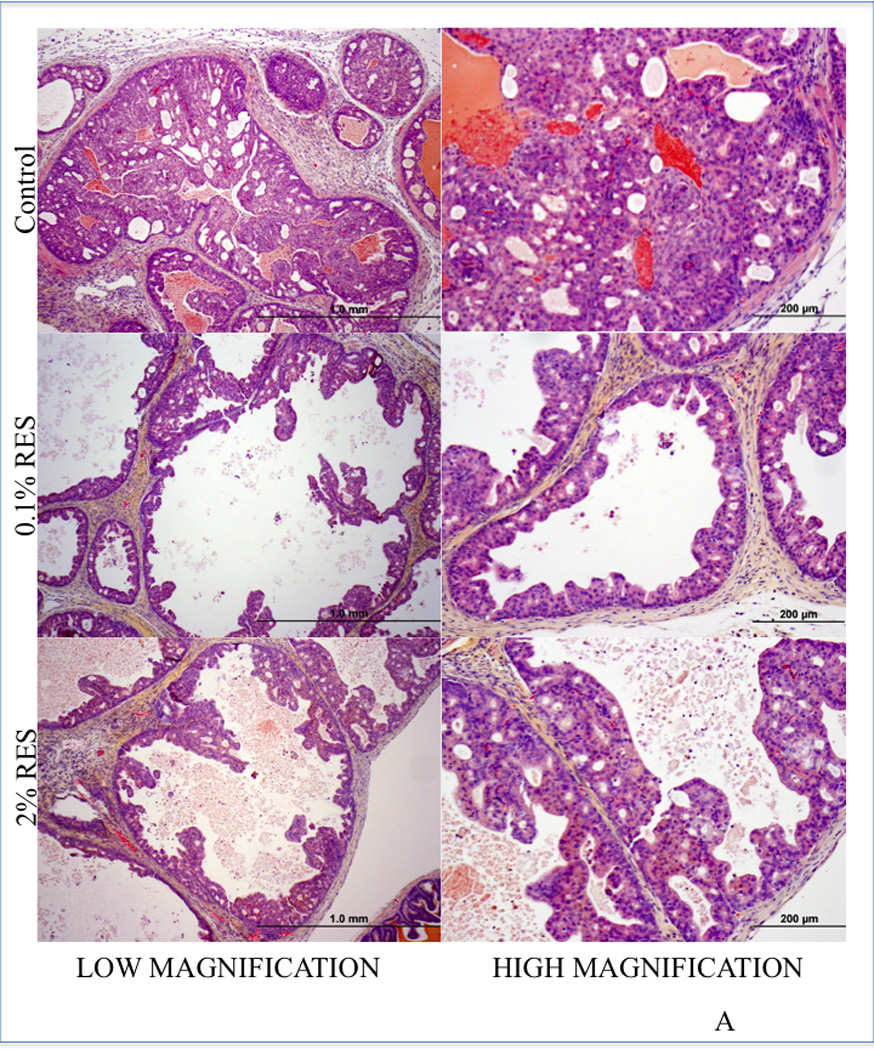
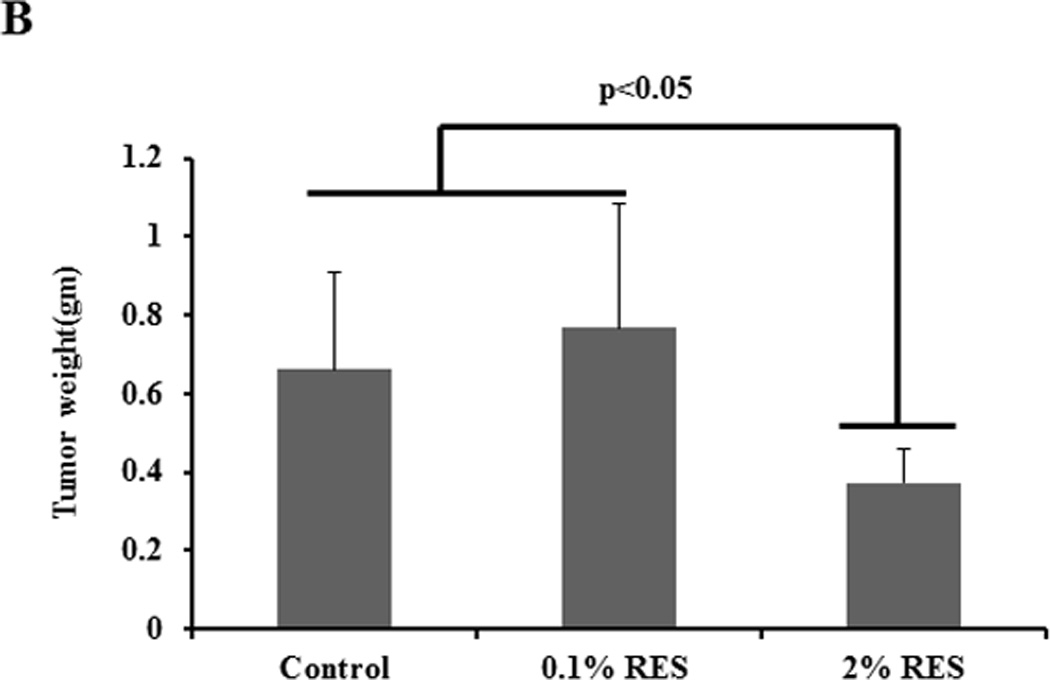
RES inhibits the development of HGPIN lesions in PTEN knockout mice. Homozygous male prostate-specific PTEN knockout mice (4- to 5-week-old) were randomized into three groups: The first group were fed a pelleted AIN76A control diet (n=15), the second group were fed a pelleted AIN76A diet containing 0.1% RES (n=15), and the third group were fed a pelleted AIN76A diet containing 2% RES (n=12). Animals were monitored weekly for body weight changes and food consumption was measured. After 14 weeks of treatment all animals were euthanized and necropsy was conducted. Prostatic lesions were graded as described in Methods. Sections of prostate tissue/tumor excised from mice (control or treated) were stained with H&E. Prostate from control animals showed HGPIN (top panel) whereas prostate tissue from mice fed with RES exhibited pathological features consistent with low-grade PIN (middle and bottom panels). A representative image of H&E evaluation is shown. Scale is indicated at the bottom of the figure. The extent of PIN lesions were scored and is shown in the Table. Graphical representation of the wet weight of the prostate is shown (B).
Table 1.
| Treatment | HGPIN 3 | HGPIN 2 |
|---|---|---|
| Control(n=15) | 11 | 4 |
| 0.1% RES | 6 | 9 |
| 2% RES | 5 | 7 |
RES inhibited formation of PIN lesions in vivo through the Akt/mTOR signaling pathway
To examine whether RES inhibited PIN lesion formation as a result of alterations in the Akt/mTOR signaling pathway, we analyzed prostate tissues from RES-treated PTEN knockout mice and age-matched controls using immunohistochemical analysis. We observed decreased staining for pS6K and increased staining for SIRT1 (changes were more prominent at high dose) with no change in the expression of pAkt, pmTOR, cleaved caspase-3, pStat3 or androgen receptor following RES treatment of PTEN knockout mice (figure 6A and data not shown). Semiquantitative analysis of these data show that there was about 29% and 57% decrease in pS6K staining in low and high dose RES respectively compared to control. On the other hand SIRT1 staining showed marked increase only in the high dose RES (75% increase) compared to control. We also did not observe any significant changes in the proliferation as evidence by Ki67 staining. These data suggest that the in vivo mechanism of RES action involve SIRT1-mediated inactivation of pS6K. A hypothetical model of this mechanism is shown in figure 6B.
Figure 6.
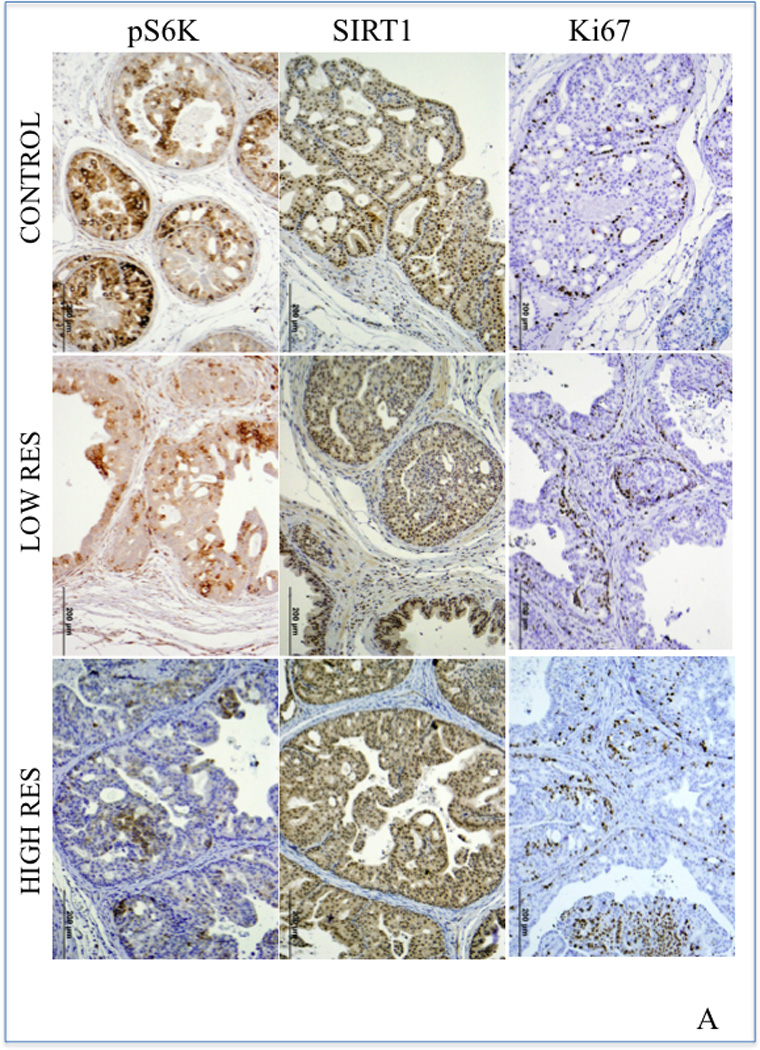
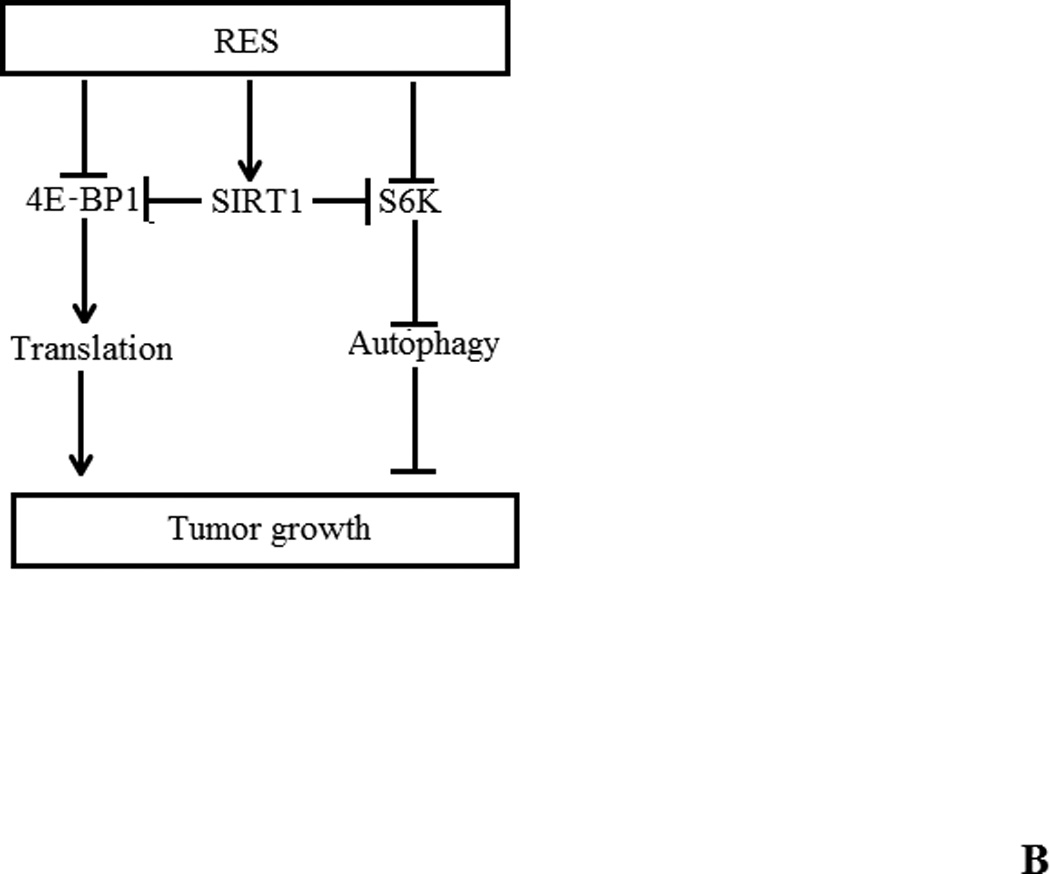
(A) Immunohistochemical analysis of SIRT1, pS6K, and pStat3 expression in representative tumors or prostate tissue from RES-treated PTEN knockout mice and age-matched controls. Paraffin-embedded tissues sections were stained with anti-Ki-67 (monoclonal rabbit, Abcam, Inc. Cambridge, MA) to assess proliferation; pS6K (Cell Signaling Technology Inc., Danvers, MA) and SIRT1 (Santa Cruz Biotechnology, Santa Cruz, CA) for signaling changes. The ancillary and visualization systems were: MACH2 Rabbit HRP polymer (Biocare 4 Plus Kit, Biocare Medical, Concord, CA) and DAB chromogen (DAKO Corporation, Carpentaria, CA. Five animals from each group were used in these experiments and a representative picture from each group is shown. (B) Hypothetical model of RES-induced autophagy in prostate cancer cells. Inhibition of mTORC1 activation (with pS6K as readout) and 4E-BP1 phosphorylation induces autophagy in a SIRT1-dependent manner. It is not yet clear whether SIRT1-mediated deacetylation of S6K triggers its dephosphorylation. We propose a model in which RES inhibits prostate cancer cell growth by induction of programmed cell death (a combination of both apoptosis and autophagy) through SIRT1-mediated inhibition of S6K phosphorylation.
Discussion
Sirtuins are histone deacetylase (HDACs) that play a key role in the regulation of life span of lower organisms and in posttranslational modifications of proteins including p53 and NFκB, thereby regulating diverse cellular processes (1–18). Elevated expression of SIRT1 has been reported in a number of primary cancers as well as in chemotherapy-resistant cancers (39–40). SIRT1 has been shown to possess both tumor promoting and tumor suppressor activities (1–18). Recently, a screen for modulators of SIRT1 activity identified the polyphenolic compound RES as the most potent activator of SIRT1 in human cells (41). Anecdotal observations coupled with epidemiological studies provide evidence that RES has beneficial effects in lowering the risk of cardiovascular diseases and cancer (42). RES has been reported to exhibit anti-tumorigenic activity both in vitro and in vivo and chemopreventive activity in a variety of tumor models including skin, liver, colon, breast, lung, and esophageal cancers (29). RES was also reported to inhibit tumor growth in a transgenic adenocarcinoma of mouse prostate model (TRAMP) (20), although a limitation of that study was the selection of adenocarcinoma as the end point rather than prostatic intraepithelial neoplasia (PIN) lesions, which are putative precursor lesions for prostate cancer. Given the high frequency of HGPIN lesions in men in their 6th and 7th decades of life (41% and 61% respectively), a better aim might be the development of RES as a preventive agent against progression of HGPIN lesions (22). To the best of our knowledge no studies have explored the efficacy of RES in preventing or delaying the development of PIN. It should be mentioned that liposomal encapsulated RES (50 mg/kg) has been reported to reduce adenocarcinoma in PTEN knockout mice (21) although the lack of information on the potential of non-encapsulated RES and small sample size (n=3) preclude drawing any firm conclusions from these data. The goal of this investigation was to test the potential of RES in preventing the development or progression of HGPIN lesions and to elucidate the underlying mechanism of action using in vitro cell culture models and tissues generated from in vivo models.
We found that SIRT1 expression was significantly higher in more aggressive cancer cells than in normal or less aggressive prostate cancer cells (figure 1) and that RES treatment induced SIRT1 expression at the RNA level. Interestingly, our data showed differential growth inhibitory effects of RES in prostate cancer cells (figure 2); androgen-responsive LNCaP and androgen-independent C42B cells were relatively resistant to RES treatment. Strikingly, we observed that at low doses (5 µmol/L), RES treatment stimulated, rather than inhibited, cell proliferation (figure 2). Mitogenic effects of RES were also reported in breast cancer cells (43). The mechanism by which RES stimulates cell proliferation at low doses involves activation of NFκB or possibly alteration in AMP/ATP ratios (28, 43). Recent studies also indicated that RES might not be a direct activator of SIRT1 (27). Consistent with these data, we did not observe SIRT1 activation by RES under our experimental conditions despite alterations in SIRT1 RNA and protein levels.
In contrast, stable knockdown of SIRT1 in DU145 and PC3 cells revealed a tumor suppressive role, with knockdown cells exhibiting enhanced proliferation and viability and decreased autophagy compared with control cells transfected with scrambled shRNA (figure 3 and 4). Treatment with RES reversed these endpoints, presumably through induction of SIRT expression. Our findings are in disagreement with those of Kojima and Jun-Hynes et al., who showed a tumor-promoting role for SIRT1 in DU145 cells using pharmacological and genetic inactivation (44). Although the exact reason for this discrepancy is not clear, one possible explanation could be differences in experimental conditions. However, our observations are in agreement with published findings demonstrating that overexpression of SIRT1 inhibits growth and proliferation of androgen-responsive prostate cancer cells and that activation of SIRT1 inhibits hormone-induced activation of androgen receptor (AR) (45). Furthermore, SIRT1 knockdown using shRNA has been shown to accelerate tumor formation in a colon cancer model (46).
Mechanistically, SIRT1 mediates a broad spectrum of functions through deacetylation of NFκB, p53, and FOXO3, leading to the suppression of apoptosis. Previous studies indicated that RES mediates its anti-cancer roles through induction of cancer cell apoptosis. However, our results indicate that RES treatment induced only up to 10% apoptosis in DU145 cells but resulted in a significant increase in autophagy (figure 4). In addition, SIRT1 knockdown in DU145 attenuated the autophagy induced by RES treatment, implying that SIRT1 is a positive regulator of autophagy in DU145 cells (figure 4). Recent studies indicate that inhibition of the Akt signaling pathway not only induces apoptosis, but also enhances autophagy (47). Our analysis of the effects of RES on components of the Akt signaling pathway indicated that RES inhibits multiple phosphorylation events, including S6K and 4E-BP1, with little to no significant effect on other Akt/mTOR components (figure 4). Our results clearly demonstrate that RES-induced cell death is primarily mediated by autophagy with a minor contribution from apoptosis. It is noteworthy that inhibition of SIRT1 by the pharmacological inhibitor nicotinamide enhances S6K acetylation, suggesting a potential role for SIRT1 in mediating S6K deacetylation (38). Although we have not demonstrated that S6K can undergo acetylation under our experimental conditions, we speculate that SIRT1-mediated deacetylation could trigger dephosphorylation of S6K. These observations suggest that RES inhibits prostate cancer cell growth through induction of programmed cell death (a combination of both apoptosis and autophagy) via SIRT1-mediated inhibition of S6K phosphorylation.
This is the first demonstration that the natural compound RES inhibits the incidence of PIN lesions, a known precursor lesion of prostate cancer, without any significant toxicity (figure 5). The biological activity of RES largely depends on the serum and tissue concentrations and toxicity-associated effects. Although we have not measured the tissue or serum levels of RES, based on its ability to decrease the incidence of HGPIN we assume that it is reaching the target tissue at an effective concentration. RES has been shown to be minimally toxic in animal models; consistent with this, we did not observe any significant changes in the body weight of treated animals.
It is possible that SIRT1 plays a dual role in tumorigenesis: in the early stage of cancer development when mutations are relatively low and tissue architecture is normal, activation of SIRT1 prevents the development of cancer. However, in advanced stages where tissue architecture is altered and numerous mutations have occurred, SIRT1 may have a tumor-promoting role. One of the biggest challenges in PCA management is the lack of effective therapeutic options for castrate-resistant disease. In this regard, our data demonstrating the ability of RES to induce autophagy through SIRT1 in the AR-negative cell line (DU145) is noteworthy. We are also aware that one of the limitations of translating RES to clinic applications is its low bioavailability, resulting from a half-life of approximately 9 h due to rapid metabolism and elimination (48). Therefore our future studies will focus on identifying or developing more stable forms of RES or analogs that cannot be rapidly metabolized or enhancing its bioavailability through combinatorial approaches. The present studies clearly warrant further in-depth investigation to determine whether the stage of intervention determines the functional ability (tumor suppressor vs. tumor promoting) of SIRT1. Nonetheless, we have identified SIRT1/S6K as a novel therapeutic target that could be developed for the management of prostate cancer, and possibly other malignancies in which Akt/mTOR signaling is deregulated.
Supplementary Material
Acknowledgments
Grant Support: This work was supported in part by the funds from National Cancer Institute R21 CA 137578; Veterans Affairs-Merit Award 1 I01 BX 000766-01 and 1RO1 CA 135451 (APK); RO1 CA 149516 (RG). We acknowledge support provided by Cancer Therapy and Research Center at University of Texas Health Science Center San Antonio through the National Cancer Institute support grant #2P30 CA 054174-17 (APK and RG).
Footnotes
Disclosure of potential conflicts of interest: No potential conflicts of interest were identified by any authors of this manuscript
References
- 1.Rahman S, Islam R. Mammalian Sirt1: insights on its biological functions. Cell Commun Signal. 2011;9:11. doi: 10.1186/1478-811X-9-11. [DOI] [PMC free article] [PubMed] [Google Scholar]
- 2.Cantó C, Auwerx J. PGC-1alpha, SIRT1 and AMPK, an energy sensing network that controls energy expenditure. Curr Opin Lipidol. 2009;20:98–105. doi: 10.1097/MOL.0b013e328328d0a4. [DOI] [PMC free article] [PubMed] [Google Scholar]
- 3.Sun C, Zhang F, Ge X, Yan T, Chen X, Shi X, et al. SIRT1 improves insulin sensitivity under insulin-resistant conditions by repressing PTP1B. Cell Metab. 2007;6:307–319. doi: 10.1016/j.cmet.2007.08.014. [DOI] [PubMed] [Google Scholar]
- 4.Hariharan N, Maejima Y, Nakae J, Paik J, Depinho RA, Sadoshima J. Deacetylation of FoxO by Sirt1 Plays an Essential Role in Mediating Starvation-Induced Autophagy in Cardiac Myocytes. Circ Res. 2010;107:1470–1482. doi: 10.1161/CIRCRESAHA.110.227371. [DOI] [PMC free article] [PubMed] [Google Scholar]
- 5.Ghosh HS, McBurney M, Robbins PD. SIRT1 negatively regulates the mammalian target of rapamycin. PLoS One. 2010;5:e9199. doi: 10.1371/journal.pone.0009199. (1–8). [DOI] [PMC free article] [PubMed] [Google Scholar]
- 6.Huffman DM, Grizzle WE, Bamman MM, Kim JS, Eltoum IA, Elgavish A, Nagy TR. SIRT1 is significantly elevated in mouse and human prostate cancer. Cancer Res. 2007;67:6612–6618. doi: 10.1158/0008-5472.CAN-07-0085. [DOI] [PubMed] [Google Scholar]
- 7.Kwon HS, Ott M. The ups and downs of SIRT1. Trends Biochem Sci. 2008;33:517–525. doi: 10.1016/j.tibs.2008.08.001. [DOI] [PubMed] [Google Scholar]
- 8.Cha EJ, Noh SJ, Kwon KS, Kim CY, Park BH, Park HS, et al. Expression of DBC1 and SIRT1 is associated with poor prognosis of gastric carcinoma. Clin Cancer Res. 2009;15:4453–4459. doi: 10.1158/1078-0432.CCR-08-3329. [DOI] [PubMed] [Google Scholar]
- 9.Jang KY, Hwang SH, Kwon KS, Kim KR, Choi HN, et al. SIRT1 expression is associated with poor prognosis of diffuse large B-cell lymphoma. Am J Surg Pathol. 2008;32:1523–1531. doi: 10.1097/PAS.0b013e31816b6478. [DOI] [PubMed] [Google Scholar]
- 10.Lee H, Kim KR, Noh SJ, Park HS, Kwon KS, Park BH, et al. Expression of DBC1 and SIRT1 is associated with poor prognosis for breast carcinoma. Hum Pathol. 2011;42:204–213. doi: 10.1016/j.humpath.2010.05.023. [DOI] [PubMed] [Google Scholar]
- 11.Tseng RC, Lee CC, Hsu HS, Tzao C, Wang YC. Distinct HIC1-SIRT1-p53 loop deregulation in lung squamous carcinoma and adenocarcinoma patients. Neoplasia. 2009;11:763–770. doi: 10.1593/neo.09470. [DOI] [PMC free article] [PubMed] [Google Scholar]
- 12.Elangovan S, Ramachandran S, Venkatesan N, Ananth S, Gnana-Prakasam JP, Martin PM, et al. SIRT1 is essential for oncogenic signaling by estrogen/estrogen receptor α in breast cancer. Cancer Res. 2011;71:6654–6664. doi: 10.1158/0008-5472.CAN-11-1446. [DOI] [PMC free article] [PubMed] [Google Scholar]
- 13.Herranz D, Serrano M. SIRT1: recent lessons from mouse models. Nat Rev Cancer. 2010;10:819–823. doi: 10.1038/nrc2962. [DOI] [PMC free article] [PubMed] [Google Scholar]
- 14.Wang RH, Sengupta K, Li C, Kim HS, Cao L, et al. Impaired DNA damage response, genome instability, and tumorigenesis in SIRT1 mutant mice. Cancer Cell. 2008;14:312–323. doi: 10.1016/j.ccr.2008.09.001. [DOI] [PMC free article] [PubMed] [Google Scholar]
- 15.Oberdoerffer P, Michan S, McVay M, Mostoslavsky R, Vann J, Park SK, et al. SIRT1 redistribution on chromatin promotes genomic stability but alters gene expression during aging. Cell. 2008;135:907–918. doi: 10.1016/j.cell.2008.10.025. [DOI] [PMC free article] [PubMed] [Google Scholar]
- 16.Herranz D, Muñoz-Martin M, Cañamero M, Mulero F, Martinez-Pastor B, Fernandez-Capetillo O, et al. Sirt1 improves healthy ageing and protects from metabolic syndrome-associated cancer. Nat Commun. 2010;1:3. doi: 10.1038/ncomms1001. [DOI] [PMC free article] [PubMed] [Google Scholar]
- 17.Lee IH, Cao L, Mostoslavsky R, Lombard DB, Liu J, Bruns NE, et al. A role for the NAD-dependent deacetylase Sirt1 in the regulation of autophagy. Proc Natl Acad Sci U S A. 2008;105:3374–3379. doi: 10.1073/pnas.0712145105. [DOI] [PMC free article] [PubMed] [Google Scholar]
- 18.Powell MJ, Casimiro MC, Cordon-Cardo C, He X, Yeow WS, Wang C, et al. Disruption of a Sirt1-dependent autophagy checkpoint in the prostate results in prostatic intraepithelial neoplasia lesion formation. Cancer Res. 2011;71:964–975. doi: 10.1158/0008-5472.CAN-10-3172. [DOI] [PMC free article] [PubMed] [Google Scholar]
- 19.Pervaiz S. Resveratrol: from grapevines to mammalian biology. FASEB J. 2003;17:1975–1985. doi: 10.1096/fj.03-0168rev. [DOI] [PubMed] [Google Scholar]
- 20.Harper CE, Patel BB, Wang J, Arabshahi A, Eltoum IA, Lamartiniere CA. Resveratrol suppresses prostate cancer progression in transgenic mice. Carcinogenesis. 2007;28:1946–1953. doi: 10.1093/carcin/bgm144. [DOI] [PubMed] [Google Scholar]
- 21.Narayanan NK, Nargi D, Randolph C, Narayanan BA. Liposome encapsulation of curcumin and resveratrol in combination reduces prostate cancer incidence in PTEN knockout mice. Int J Cancer. 2009;125:1–8. doi: 10.1002/ijc.24336. [DOI] [PubMed] [Google Scholar]
- 22.Sakr WA, Ward C, Grignon DJ, Haas GP. Epidemiology and molecular biology of early prostatic neoplasia. Mol Urol. 2000;4:109–113. [PubMed] [Google Scholar]
- 23.Wang S, Gao J, Lei Q, Rozengurt N, Pritchard C, Jiao J, et al. Prostate-specific deletion of the murine Pten tumor suppressor gene leads to metastatic prostate cancer. Cancer Cell. 2003;4:209–221. doi: 10.1016/s1535-6108(03)00215-0. [DOI] [PubMed] [Google Scholar]
- 24.Ganapathy M, Ghosh R, Jianping X, Zhang X, Bedolla R, Schoolfield J, et al. Involvement of FLIP in 2-methoxyestradiol-induced tumor regression in transgenic adenocarcinoma of mouse prostate model. Clin Cancer Res. 2009;15:1601–1611. doi: 10.1158/1078-0432.CCR-08-1389. [DOI] [PMC free article] [PubMed] [Google Scholar]
- 25.Park JH, Walls JE, Galvez JJ, Kim M, Abate-Shen C, Shen MM, et al. Prostatic intraepithelial neoplasia in genetically engineered mice. Am J Pathol. 2002;161:727–735. doi: 10.1016/S0002-9440(10)64228-9. [DOI] [PMC free article] [PubMed] [Google Scholar]
- 26.Shappell SB, Thomas GV, Roberts RL, Herbert R, Ittmann MM, Rubin MA, et al. Prostate pathology of genetically engineered mice: definitions and classification. The consensus report from the Bar Harbor meeting of the Mouse Models of Human Cancer Consortium Prostate Pathology Committee. Cancer Res. 2004;64:2270–2305. doi: 10.1158/0008-5472.can-03-0946. [DOI] [PubMed] [Google Scholar]
- 27.Beher D, Wu J, Cumine S, Kim KW, Lu SC, Atangan L, et al. Resveratrol is not a direct activator of SIRT1 enzyme activity. Chem Biol Drug Des. 2009;74:619–624. doi: 10.1111/j.1747-0285.2009.00901.x. [DOI] [PubMed] [Google Scholar]
- 28.Hawley SA, Ross FA, Chevtzoff C, Green KA, Evans A, Fogarty S, et al. Use of cells expressing gamma subunit variants to identify diverse mechanisms of AMPK activation. Cell Metab. 2010;11:554–565. doi: 10.1016/j.cmet.2010.04.001. [DOI] [PMC free article] [PubMed] [Google Scholar]
- 29.Bishayee A. Cancer prevention and treatment with resveratrol: from rodent studies to clinical trials. Cancer Prev Res. 2009;2:409–418. doi: 10.1158/1940-6207.CAPR-08-0160. [DOI] [PubMed] [Google Scholar]
- 30.Benitez DA, Pozo-Guisado E, Alvarez-Barrientos A, Fernandez-Salguero PM, Castellón EA. Mechanisms involved in resveratrol-induced apoptosis and cell cycle arrest in prostate cancer-derived cell lines. J Androl. 2007;28:282–293. doi: 10.2164/jandrol.106.000968. [DOI] [PubMed] [Google Scholar]
- 31.Gill C, Walsh SE, Morrissey C, Fitzpatrick JM, Watson RW. Resveratrol sensitizes androgen independent prostate cancer cells to death-receptor mediated apoptosis through multiple mechanisms. Prostate. 2007;67:1641–1653. doi: 10.1002/pros.20653. [DOI] [PubMed] [Google Scholar]
- 32.Morselli E, Maiuri MC, Markaki M, Megalou E, Pasparaki A, Palikaras K, et al. Caloric restriction and resveratrol promote longevity through the Sirtuin-1-dependent induction of autophagy. Cell Death Dis. 2010;1:e10. doi: 10.1038/cddis.2009.8. [DOI] [PMC free article] [PubMed] [Google Scholar]
- 33.Jung CH, Ro SH, Cao J, Otto NM, Kim DH. mTOR regulation of autophagy. FEBS Lett. 2010;584:1287–1295. doi: 10.1016/j.febslet.2010.01.017. [DOI] [PMC free article] [PubMed] [Google Scholar]
- 34.He C, Klionsky DJ. Regulation mechanisms and signaling pathways of autophagy. Annu Rev Genet. 2009;43:67–93. doi: 10.1146/annurev-genet-102808-114910. (review). [DOI] [PMC free article] [PubMed] [Google Scholar]
- 35.Janku F, McConkey DJ, Hong DS, Kurzrock R. Autophagy as a target for anticancer therapy. Nat Rev Clin Oncol. 2011;8:528–539. doi: 10.1038/nrclinonc.2011.71. [DOI] [PubMed] [Google Scholar]
- 36.Fingar DC, Salama S, Tsou C, Harlow E, Blenis J. Mammalian cell size is controlled by mTOR and its downstream targets S6K1 and 4EBP1/eIF4E. Genes Dev. 2002;16:1472–1487. doi: 10.1101/gad.995802. [DOI] [PMC free article] [PubMed] [Google Scholar]
- 37.Fenton TR, Gwalter J, Ericsson J, Gout IT. Histone acetyltransferases interact with and acetylate p70 ribosomal S6 kinases in vitro and in vivo. Int J Biochem Cell Biol. 2010;42:359–366. doi: 10.1016/j.biocel.2009.11.022. [DOI] [PubMed] [Google Scholar]
- 38.Lee H, Zhang P, Herrmann A, Yang C, Xin H, Wang Z, et al. Acetylated STAT3 is crucial for methylation of tumor-suppressor gene promoters and inhibition by resveratrol results in demethylation. Proc Natl Acad Sci U S A. 2012;109:7765–7769. doi: 10.1073/pnas.1205132109. [DOI] [PMC free article] [PubMed] [Google Scholar]
- 39.Kojima K, Ohhashi R, Fujita Y, Hamada N, Akao Y, Nozawa Y, et al. A role for SIRT1 in cell growth and chemoresistance in prostate cancer PC3 and DU145 cells. Biochem Biophys Res Commun. 2008;373:423–428. doi: 10.1016/j.bbrc.2008.06.045. [DOI] [PubMed] [Google Scholar]
- 40.Chu F, Chou PM, Zheng X, Mirkin BL, Rebbaa A. Control of multidrug resistance gene mdr1 and cancer resistance to chemotherapy by the longevity gene SIRT1. Cancer Res. 2005;65:10183–10187. doi: 10.1158/0008-5472.CAN-05-2002. [DOI] [PubMed] [Google Scholar]
- 41.Howitz KT, Bitterman KJ, Cohen HY, Lamming DW, Lavu S, Wood JG, et al. Small molecule activators of sirtuins extend Saccaromyces Cervisiae lifespan. Nature. 2003;425:191–196. doi: 10.1038/nature01960. [DOI] [PubMed] [Google Scholar]
- 42.Das M, Das DK. Resveratrol and cardiovascular health. Mol Aspects Med. 2010;31:503–512. doi: 10.1016/j.mam.2010.09.001. [DOI] [PubMed] [Google Scholar]
- 43.Fukui M, Yamabe N, Kang KS, Zhu BT. Growth-stimulatory effect of resveratrol in human cancer cells. Mol Carcinog. 2010;49:750–759. doi: 10.1002/mc.20650. [DOI] [PubMed] [Google Scholar]
- 44.Jung-Hynes B, Nihal M, Zhong W, Ahmad N. Role of sirtuin histone deacetylase SIRT1 in prostate cancer. A target for prostate cancer management via its inhibition? J Biol Chem. 2009;284:3823–3832. doi: 10.1074/jbc.M807869200. [DOI] [PMC free article] [PubMed] [Google Scholar]
- 45.Fu M, Liu M, Sauve AA, Jiao X, Zhang X, Wu X, et al. Hormonal control of androgen receptor function through SIRT1. Mol Cell Biol. 2006;26:8122–8135. doi: 10.1128/MCB.00289-06. [DOI] [PMC free article] [PubMed] [Google Scholar]
- 46.Kabra N, Li Z, Chen L, Li B, Zhang X, Wang C, Yeatman T, et al. SirT1 is an inhibitor of proliferation and tumor formation in colon cancer. J Biol Chem. 2009;284:18210–18217. doi: 10.1074/jbc.M109.000034. [DOI] [PMC free article] [PubMed] [Google Scholar]
- 47.Degtyarev M, De Mazière A, Orr C, Lin J, Lee BB, Tien JY, et al. Akt inhibition promotes autophagy and sensitizes PTEN-null tumors to lysosomotropic agents. J Cell Biol. 2008;183:101–116. doi: 10.1083/jcb.200801099. [DOI] [PMC free article] [PubMed] [Google Scholar]
- 48.Walle T, Hsieh F, DeLegge MH, Oatis JE, Jr, Walle KU. High absorption but very low bioavailability of oral resveratrol in humans. Drug Metabolism and Disposition. 2004;32:1377–1382. doi: 10.1124/dmd.104.000885. [DOI] [PubMed] [Google Scholar]
Associated Data
This section collects any data citations, data availability statements, or supplementary materials included in this article.