

Background: Calcium homeostasis endoplasmic reticulum protein (CHERP) was originally identified as an integral endoplasmic reticulum membrane protein that regulates intracellular Ca2+ channels.
Results: In contrast, we show CHERP binds SR140 in nuclear subdomains.
Conclusion: CHERP regulates Ca2+ homeostasis indirectly, not as a binding partner of ryanodine receptors or IP3 receptors.
Significance: These data support an entirely new model for the cellular role of CHERP.
Keywords: Calcium; Calcium intracellular release; Calcium signaling; Inositol 1,4,5-Trisphosphate; Ryanodine Receptor; Spliceosome; Endoplasmic Reticulum; IP3 Receptor
Abstract
Changes in cytoplasmic Ca2+ concentration, resulting from activation of intracellular Ca2+ channels within the endoplasmic reticulum, regulate several aspects of cellular growth and differentiation. Ca2+ homeostasis endoplasmic reticulum protein (CHERP) is a ubiquitously expressed protein that has been proposed as a regulator of both major families of endoplasmic reticulum Ca2+ channels, inositol 1,4,5-trisphosphate receptors (IP3Rs) and ryanodine receptors (RyRs), with resulting effects on mitotic cycling. However, the manner by which CHERP regulates intracellular Ca2+ channels to impact cellular growth is unknown. Here, we challenge previous findings that CHERP acts as a direct cytoplasmic regulator of IP3Rs and RyRs and propose that CHERP acts in the nucleus to impact cellular proliferation by regulating the function of the U2 snRNA spliceosomal complex. The previously reported effects of CHERP on cellular growth therefore are likely indirect effects of altered spliceosomal function, consistent with prior data showing that loss of function of U2 snRNP components can interfere with cell growth and induce cell cycle arrest.
Introduction
Agonist-evoked Ca2+ release from intracellular Ca2+ stores regulates many cellular functions, either acutely via regulation of existing cytoplasmic effectors or more chronically via transcriptional mechanisms. Appropriate physiological regulation of two major families of intracellular Ca2+ channels within the sarco/endoplasmic reticulum, inositol 1,4,5-trisphosphate receptors and ryanodine receptors (RyRs),3 is crucial for generating the specific patterns of cytoplasmic Ca2+ signals that serve to control cell proliferation and execution of transcriptional programs (1–4). Dysfunctional regulation of these intracellular Ca2+ channels may effect cellular transformation and inappropriate tissue remodeling in various pathologies (5–7).
One proposed regulator of agonist-evoked Ca2+ signaling is a widely expressed ER protein called CHERP (Ca2+ homeostasis endoplasmic reticulum protein). CHERP was initially proposed as an integral membrane protein that reacted with a monoclonal antibody raised against the intracellular dense tubular membrane system of platelets (8–10). Impairment of CHERP function, using either antisense cDNA or this inhibitory antibody, inhibited Ca2+ release by phosphoinositide-coupled agonists, nuclear translocation of NFAT, and cell proliferation (8, 9). These data implied a link between CHERP functionality and the generation of inositol 1,4,5-trisphosphate receptor-dependent Ca2+ signals needed to regulate cell cycle progression. Such a model received further support from the recent demonstration that CHERP co-localized with RyR1 in skeletal muscle, copurified with a heterologously expressed RyR1 fragment, and siRNA data showing CHERP modulated caffeine-mediated Ca2+ release (11). Therefore, CHERP appeared to act as a conserved regulator of both main families of intracellular Ca2+ channels.
To mechanistically define how CHERP regulates the balance between cellular senescence and proliferation through modulation of Ca2+ release activity, we resolved to understand how CHERP interacts with intracellular Ca2+ channels. Surprisingly, and in contrast to all previous studies on the cellular physiology of CHERP (8, 9, 11), we found CHERP acts as a nuclear protein localized to nuclear speckles in the context of the U2 snRNA spliceosomal complex. This provides an alternative explanation for previously reported effects of CHERP on cellular growth independent from any direct effect on intracellular Ca2+ channels or ER Ca2+ homeostasis. These findings necessitate reinterpretation of the currently postulated role of CHERP as an integral ER protein that directly regulates intracellular Ca2+ release channels (8, 9, 11).
EXPERIMENTAL PROCEDURES
Reagents
CHERP cDNA (NM_006387.5) was from Open Biosystems. Enhanced green fluorescent protein, and DsRed2-ER vectors and the In-fusion HD EcoDry PCR cloning kit were from Clontech. Protease inhibitors, protein G-agarose, and DAPI were obtained from Roche Applied Science, and alkaline phosphatase was from New England Biolabs. The phosphatase inhibitor mixture was from Thermo Scientific. Antibodies were sourced as follows: GFP (Santa Cruz, sc-9996), CHERP (Abcam, ab15951), PDI (Abcam, ab2792), SR140 (Abcam, ab87208), SF3B2 (Abcam, ab56800), SF3B3 (Abcam, ab96683), CREB (Millipore, MAB5432), Myc (9E10, Roche, 667149), SC35 (Sigma, S4045), and p80-coilin was provided by Dr. Garry Morgan (University of Nottingham). The immunogen used to generate the CHERP antibody is completely conserved in human, mouse, and rat. Secondary antibodies for Western blotting and immunohistochemistry were from LI-COR Biosciences and Invitrogen. All other chemicals were from Sigma. Cell lines were from ATCC.
Cell Culture and Subcellular Fractionation Methods
HEK293, SKBR3, and Jurkat cells were maintained in minimal essential medium, McCoy's 5A medium, and RPMI 1640 medium, respectively. HeLa cells were grown in Dulbecco's modified Eagle's medium. All media were supplemented with 10% fetal bovine serum (FBS), penicillin (100 units/ml), streptomycin (100 μg/ml), and l-glutamine (290 μg/ml) (Invitrogen). Cardiac and skeletal myocytes were prepared as described previously (12, 13). For overexpression assays, cells were transfected (70% confluence) with LipofectamineTM 2000 (Invitrogen), Effectene (Qiagen), or TrueFect transfection reagents (United Biosystems) and imaged or harvested 48 h later.
Whole cell lysate (WCL) was prepared by resuspension of trypsinized cells in nonreducing co-immunoprecipitation buffer (137 mm NaCl, 2 mm EDTA, 20 mm Tris-HCl, pH 8.0, 1% Nonidet P-40, 10% glycerol, 1× protease inhibitors, 1× phosphatase inhibitors) prior to solubilization for 1 h at 4 °C with mild agitation. The solubilized sample was centrifuged at 13,000 × g for 20 min at 4 °C, and the supernatant was collected and stored at −80 °C until use. Protein concentrations were determined by BCA assay (Thermo Scientific). For dephosphorylation experiments, HEK293 WCL (50 μg) was incubated with alkaline phosphatase (20 units, 37 °C for 1 h) and samples were separated by SDS-PAGE immediately after incubation.
For subcellular (cytosolic and nuclear) fractionation, trypsinized cells were resuspended in 2× volumes of Buffer I (10 mm HEPES, pH 7.9, 10 mm KCl, 0.1 mm EDTA, 1 mm DTT, 1 mm PMSF, 10% glycerol, 0.2% Nonidet P-40, 0.15 mm spermine, 0.5 mm spermidine) and incubated on ice for 10 min. The cytosolic fraction was obtained by centrifugation (4000 × g for 5 min, 4 °C). For isolation of the nuclear fraction, the pellet from the above centrifugation was resuspended in 1× volume mixture of Buffer I and Buffer IV (20 mm HEPES, pH 7.9, 0.8 m NaCl, 1 mm EDTA, 1 mm DTT, 1 mm PMSF, 10% glycerol). Both Buffer I and IV were supplemented with additional protease and phosphatase inhibitors. The sample was incubated (4 °C, 30 min) on an end-over-end shaker and then centrifuged (16,000 × g for 15 min, 4 °C) and the supernatant (nuclear fraction) was collected. Western blotting analysis of protein distribution in different fractions was performed after separating (4–12% NuPAGE BisTris gel, Invitrogen) and transfer of proteins to a PVDF membrane (0.45 μm, Invitrogen). An Odyssey® Infrared Imaging System (LI-COR Biosciences) was used for analysis of fluorescence intensity.
Immunoprecipitation and Mass Spectrometry
Soluble WCL (1 mg) was precleared with protein G-agarose, followed by incubation overnight with anti-CHERP antibody or rabbit IgG at 4 °C on a shaker. The immunocomplex was purified by incubating the reaction mixture with protein G-agarose, followed by washing with nonreducing co-immunoprecipitation buffer (3 × 10 min, 4 °C). Immunoprecipitated proteins were denatured in 1× LDS sample buffer (Invitrogen) supplemented with 100 mm DTT and then boiled for 5 min. Protein samples were separated and resolved using a ProteoSilverTM Plus Silver Staining Kit (Sigma). The protein band corresponding to CHERP was excised from the gel, followed by in-gel tryptic digestion. Digested peptide mixtures were desalted with C18 resin according to the “Stage Tip” procedure (14). Aliquots of ∼0.25 μg of total peptide were dissolved in 5.5 μl of load solvent (98:2:0.01, water:acetonitrile:formic acid) and loaded directly onto a 12 cm × 75-μm internal diameter fused silica pulled-tip (New Objective) capillary column packed in-house with Magic C18AQ resin (5 μm, 200 Å pore size; Michrom BioResources) with load solvent at a flow rate of 800 nl/min using an Eksigent 1D+LC nanoflow system (Dublin) and a MicroAS autosampler. Peptides were eluted using a gradient of 10–40% B Solvent (A Solvent, 98:2:0.01, water:acetonitrile:formic acid; B Solvent, 98:2:0.01, acetonitrile:water:formic acid) over 55 at 320 nl/min. The column was mounted in a nanospray source directly in line with a Velos Orbitrap mass spectrometer (Thermo Scientific). Spray voltage was 2 kV, and the heated capillary was maintained at 260 °C. The orbital trap was set to acquire survey mass spectra (300–1800 m/z) with a resolution of 30,000 at 400 m/z with automatic gain control (AGC) 1 × 10E6, 500-ms min injection time and lock mass at 445.1200 m/z (polysiloxane). The six most intense ions (2+ charged and higher) from the full scan were selected for fragmentation by higher-energy collisional dissociation with normalized collision energy 40%, activation time 0.1, and detector settings of 7500 resolution, AGC 1 × 10E5 ions, 500 ms maximum injection time and FT first mass mode fixed at 111 m/z. Dynamic exclusion settings were: repeat count 1, maximum 50 values, 12 s duration, and mass tolerance −0.7 to 1.25 atomic mass unit. Data were acquired using Xcalibur software version 2.1.0. The mass spectrometer .RAW files were converted to MzXML with msconvert from Proteowizard, which were converted to .MGF files with TINT raw-to-mgf converter. ProteinPilot 4.2 (AB Sciex) searches were performed against the UniProt Homo sapiens (taxon 9606; April 20, 2011 version) database with canonical and isoform sequences (146617 proteins), to which a contaminant database (thegpm.org/crap/index, 109 proteins) was appended. Search parameters were: cysteine iodoacetamide; trypsin; instrument Orbi MS (1–3ppm) Orbi MS/MS; biological modifications ID focus; thorough search effort; and False Discovery Rate analysis (with reversed database). Protein interaction analysis was performed using UniHI.6 (15).
Construction and Analysis of CHERP Mutants
An In-fusion HD EcoDry PCR cloning kit was used to subclone CHERP truncations into pEGFP using primer sequences as shown in Table 1. Myc fusions were generated in the pCMT vector. All DNA constructs were confirmed by sequencing (BioMedical Genomics Center from the University of Minnesota).
TABLE 1.
Primer sequences for subcloning NH2- versus COOH-terminal deletion constructs of CHERP
The primers used to generate indicated constructs are shown. Vector-specific sequences are italicized and gene-specific sequences shown in bold text. Restriction sites used for subcloning are underlined and nucleotides inserted for reading frame adjustments are shown as lowercase.
| Constructs | Forward primer (5′ → 3′) Reverse primer (5′ → 3′) |
|---|---|
| Wild-type | |
| CHERP(1–916) (pEGFP-C3) | AATTCTGCAGTCGACaATGGAGATGCCGCTGCCC |
| GTGGATCCCGGGCCCGCGGCTACTTACACTCGTCCCTG | |
| CHERP(1–916) (pEGFP-N3) | GTCAGATCCGCTAGCATGGAGATGCCGCTGCCC |
| CCGCGGTACCGTCGACCTTACACTCGTCCCTGGCC | |
| C-terminal deletion | |
| CHERP(1–897) (pEGFP-N3) | GTCAGATCCGCTAGCATGGAGATGCCGCTGCCC |
| CCGCGGTACCGTCGACGTAGTTCTCATAGGGGTC | |
| CHERP(1–838) (pEGFP-N3) | GTCAGATCCGCTAGCATGGAGATGCCGCTGCCC |
| CCGCGGTACCGTCGACCCTTGAGTCAGGGATGGG | |
| CHERP(1–777) (pEGFP-N3) | GTCAGATCCGCTAGCATGGAGATGCCGCTGCCC |
| CCGCGGTACCGTCGACGGAGTAGGAACGGGAGCA | |
| CHERP(1–742) (pEGFP-N3) | GTCAGATCCGCTAGCATGGAGATGCCGCTGCCC |
| CCGCGGTACCGTCGACTCTGCTCCGAGACCTCGA | |
| CHERP(1–725) (pEGFP-N3) | GTCAGATCCGCTAGCATGGAGATGCCGCTGCCC |
| CCGCGGTACCGTCGACCCGCCGGGCCCGCATTTT | |
| CHERP(1–705) (pEGFP-N3) | GTCAGATCCGCTAGCATGGAGATGCCGCTGCCC |
| CCGCGGTACCGTCGACACTGTTCCTGGGCCTGTC | |
| N-terminal deletion | |
| CHERP(342–916) (pEGFP-N3) | GTCAGATCCGCTAGCATGCTCCAGATGCCGCAGATG |
| CCGCGGTACCGTCGACCTTACACTCGTCCCTGGCC | |
| CHERP(705–916) (pEGFP-N3) | GTCAGATCCGCTAGCATGAGTGAAGGCTGGGAGCAG |
| CCGCGGTACCGTCGACCTTACACTCGTCCCTGGCC | |
| CHERP(743–916) (pEGFP-N3) | GTCAGATCCGCTAGCATGTCCAAGAGTCGAGGGCGTT |
| CCGCGGTACCGTCGACCTTACACTCGTCCCTGGCC | |
| CHERP(726–742) (pEGFP-N3) | GTCAGATCCGCTAGCATGAGGAAAGGCCAGGAGAAG |
| CCGCGGTACCGTCGACTCTGCTCCGAGACCTCGAG | |
| CHERP(726–777) (pEGFP-N3) | GTCAGATCCGCTAGCATGAGGAAAGGCCAGGAGAAG |
| CCGCGGTACCGTCGACGGAGTAGGAACGGGAGCA | |
| CHERP(726–838) (pEGFP-N3) | GTCAGATCCGCTAGCATGAGGAAAGGCCAGGAGAAG |
| CCGCGGTACCGTCGACCCTTGAGTCAGGGATGGG | |
RNAi Experiments
CHERP pre-design chimera RNAi (H00010523-R01, Abnova; “CHERP siRNA”) or Naito1 pre-design chimera RNAi (R0017, Abnova; “scramble siRNA”) were transfected into HEK293 cells (30–50% confluence) with LipofectamineTM RNAiMAX (Invitrogen) as per the manufacturer's procedures. Cells were harvested 96 h after siRNA transfection for subsequent experimental analyses.
Imaging Experiments
Immunostaining was performed after fixation (4% paraformaldehyde in PBS, 30 min at room temperature) and permeabilization (0.1% Triton X-100 in PBS (PBST), 10 min). For certain experiments, samples were permeabilized before fixation (Fig. 4, E and F). Samples were incubated in blocking solution (1% bovine serum albumin in PBST, 30 min at room temperature) before hybridization with primary antibody (4 °C, overnight). Samples were then washed (3 × 5 min) and then incubated with secondary antibody (1 h, room temperature). After further washing, samples were counterstained with DAPI (0.1 μg/ml for 1 min) before imaging. For live cell imaging, a confocal system (Olympus FluoView FV1000) was used to detect fluorophore emission. For comparison of the localization of CHERP truncation mutants, all images were captured at the same settings (laser intensity, exposure, and magnification), and the intensity values were quantified between similar sized regions-of-interest (cytoplasm versus nucleus) using MetaMorph software (Molecular Devices, Inc.). Data were analyzed and plotted using GraphPad Prism. Error bars represent mean ± S.E.
FIGURE 4.

Confocal imaging of CHERP in live cells. A, colocalization of CHERP(1–916)-GFP with DAPI counterstaining (0.1 μg/ml, 1 min) in HEK293 cells (top) and SKBR3 cells (bottom). B, targeting of CHERP(1–916)-GFP to nuclear subdomains in HEK293 and SKBR3 cells. Subnuclear densities are highlighted (arrows). C, staining of endogenous CHERP in HEK293 cells at low (left) and high magnification (right). Cells were co-stained with SC-35 and DAPI as indicated. D, a detergent-resistant fraction of CHERP in subnuclear foci. Left, immunofluorescence image of HeLa cells transiently transfected with a construct encoding Myc-CHERP and pre-extracted with 0.2% Triton prior to fixation. Right, immunofluorescence image overlaid with a phase-contrast image of the same cells. E, immunofluorescence image of HeLa cells transiently transfected with a construct encoding Myc-CHERP (left), co-stained for endogenous SC35 (middle). Pre-extraction of cells with detergent reveals large CHERP foci. Overlay (right) shows that the majority of, but not all, SC35-foci overlap with CHERP foci (white arrowhead). Boxes circumscribe the region enlarged (3 times) in the lower panel. F, CHERP does not localize to Cajal bodies. Lower (top) and higher (bottom) immunofluorescence images of the distribution of Myc-CHERP (left) and p80-coilin (middle) in HeLa cells. Merged images are shown on the right. G, cells treated with 5,6-dichloro-1-β-d-ribofuranosylbenzimidazole (DRB) (100 μm for 2 h, bottom) show enlarged CHERP foci that colocalize with SC35, compared with untreated cells (top).
RESULTS
Validation of an Anti-CHERP Antibody
To investigate the cellular physiology of CHERP, we first validated the specificity of an antibody used previously to study the properties of CHERP (11). Western blotting of HEK293 cell lysates probed with the anti-CHERP antibody revealed an immunoreactive band at 118 kDa (Fig. 1A), in agreement with previous estimates for migration of the endogenous CHERP protein (116–120 kDa (8, 16, 17)). The slower migration of CHERP relative to the predicted molecular mass (103 kDa) likely results from post-translational modifications such as phosphorylation of consensus sites within the 916-amino acid CHERP protein (8). Indeed, treatment with alkaline phosphatase increased the observed electrophoretic mobility of CHERP (Fig. 1A). This is consistent with the in silico prediction of COOH-terminal phosphorylation sites within the CHERP sequence (Table 2). Overexpression of full-length CHERP clones tagged with GFP either at the NH2 or COOH terminus (GFP-CHERP(1–916) or CHERP(1–916)-GFP) resulted in the appearance of an additional CHERP immunoreactive band at ∼143 kDa, consistent with a ∼27 kDa increase from the untagged protein (116–120 kDa) resulting from attachment of the reporter moiety (Fig. 1B). GFP immunoreactivity also corresponded with the novel band detected with the anti-CHERP antibody in GFP-CHERP(1–916) and CHERP(1–916)-GFP overexpressing cells (Fig. 1B). Finally, immunoprecipitation approaches were used to validate detection of CHERP with this antibody. Endogenous CHERP protein was detected in immunoprecipitates from HEK293 cell lysates but not IgG controls (Fig. 1C). The gel area corresponding to the immunoreactive band resolved from silver staining was excised and processed for mass spectrometry analyses together with the identical region from IgG samples. In-gel-digested peptides were purified and analyzed by LC-MS/MS. A total of 121 unique peptides with ≥95% identification confidence were matched to CHERP in the CHERP IP sample (54% amino acid sequence coverage (490/916 amino acids), with peptides spanning NH2 to COOH terminus, Fig. 1D). Collectively, these data validate the use of the anti-CHERP antibody for recognition of both endogenous and overexpressed CHERP protein.
FIGURE 1.
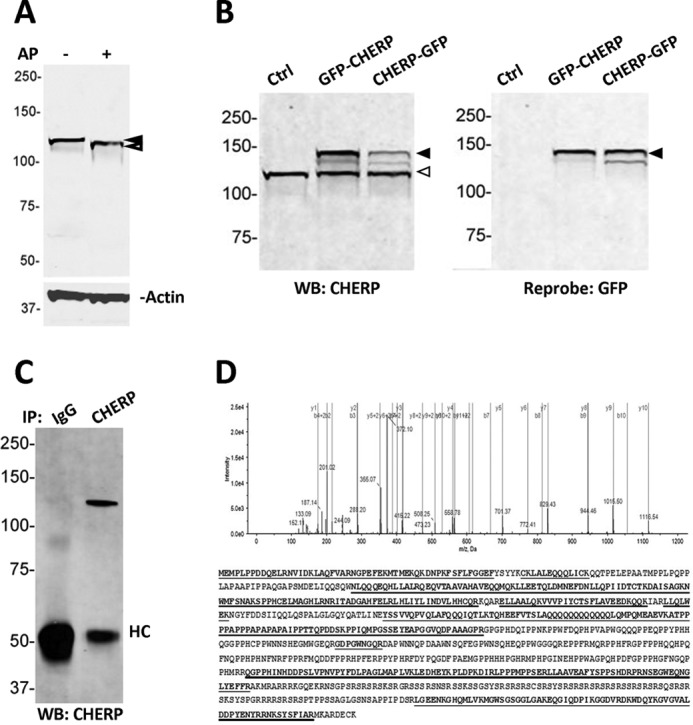
Validation of the anti-CHERP antibody. A, Western blot (WB) of WCL prepared from HEK293 cells probed with an anti-CHERP antibody in the absence (left) or presence of alkaline phosphatase (AP, right). Blots were co-incubated with an anti-actin antibody to serve as a loading control. B, Western blot of HEK293 WCL samples used for detection of endogenous and overexpressed CHERP constructs. Samples were probed with an anti-CHERP antibody (left) and then reprobed with an anti-GFP antibody (right). Solid arrowhead, GFP-tagged CHERP; open arrowhead, endogenous CHERP. C, Western blot (anti-CHERP) of WCL samples prepared from HEK293 cells following immunoprecipitation with an IgG (left) or a CHERP antibody (right). D, top, a representative tandem mass spectrum of doubly charged monoisotopic precursor 615.316 m/z matched to peptide ITADGAHFELR in CHERP sequence with 1.4 ppm mass accuracy and 99% peptide confidence. Theoretical b- and y-type fragment ion types matched to experimental product ion peaks are labeled (spectrum pasted from ProteinPilot Viewer software). Bottom, protein coverage (54%) by mass spectrometry detection of 121 unique peptides (underlined sequences) at ≥95% peptide confidence.
TABLE 2.
Characterization of CHERP properties by predictive algorithms and data mining
The in silico predicted features of CHERP correlated with the algorithms and programs used to make the predictions are shown.
| Function | Algorithm | Predicted results |
|---|---|---|
| Transmembrane helices | TopPred | 2 (aa 78–98; 232–252)a |
| HMMTOP | 1 (aa 641–659) | |
| LOCATE | 1 (aa 239–245) | |
| SOSUI | None | |
| TMHMM | None | |
| TMpred | None | |
| Signal peptide prediction | SignalP | None |
| Subcellular localization | WoLF PSORT | Nuclear |
| Yloc | Nuclear | |
| LOCATE | Nuclear | |
| ESLPred | Nuclear | |
| NucPred | Nuclear | |
| NLS prediction | NLS_BP | 2 (aa 726–742; 898–912) |
| Predict Protein | 2 (aa 778–788; 784–793) | |
| mRNA processing | PROSITE | SURP motif (aa15–57) |
| CID domain (aa 149–289) | ||
| G_patch (aa. 841–891) | ||
| RS domain (743–817) | ||
| Glycosylation prediction | NetNGlyc | 1 (aa 900) |
| PROCITE | 2 (aa 456, 900) | |
| NetOGlyc | 7 | |
| Phosphorylation | PhosphoSite | Tyr-714 |
| Ser-813, Ser-815, Ser-817, Thr-819, Ser-822 | ||
| Tyr-894, Ser-904 | ||
| SUMOylation | SUMOsp 2.0 | 3 (aa 318, 660, 916) |
| Palmitoylation | CSS-Palm 3.0 | 4 (aa 69, 225, 772, 915) |
a aa, amino acid(s).
Endogenous CHERP Resides in Nuclear Subdomains
Application of this same antibody for immunofluorescence localization of endogenous CHERP protein in mammalian cell lines surprisingly resolved a nuclear staining pattern. In both HEK293 and SKBR3 cells, endogenous CHERP co-localized with DAPI staining (Fig. 2A). There was no evidence for colocalization of CHERP with an endoplasmic reticulum (ER) marker (Fig. 2B). Taking a different approach, the nuclear targeting of CHERP was corroborated by subcellular fractionation followed by Western blotting. In both cell lines, endogenous CHERP immunoreactivity predominated in the nuclear fraction (>90% of total immunoreactivity), as defined by detection of CREB (Fig. 2C). The nuclear localization of CHERP clearly contrasted with prior immunofluorescence data from different cells, including Jurkat cells and rat skeletal myocytes, which colocalized CHERP with sarco/endoplasmic reticulum markers (8, 9, 11). Therefore, we extended our analyses to Jurkat cells and primary myocyte cultures. In cross-sections of rat skeletal (gastrocnemius) muscle and isolated cardiac myocytes, endogenous CHERP immunofluorescence again was localized to the nucleus as evidenced by the overlap with DAPI counterstaining (Fig. 2D). Again, there was no apparent colocalization of CHERP with ER markers (Fig. 2E) and the predominantly nuclear localization of CHERP was also apparent by subcellular fractionation (Fig. 2F). Finally, we examined the localization of endogenous CHERP in the Xenopus oocyte. The large size of the Xenopus oocyte (∼1 mm diameter) and the germinal vesicle (∼0.4 mm diameter) contained within the oocyte animal hemisphere permits manual enucleation to separate the nucleus from all other cellular components. Western blotting of fractions comprised of manually separated nuclei and the remaining cellular proteins again revealed a clear localization of CHERP in the nuclear fraction (Fig. 2G).
FIGURE 2.

Nuclear distribution of endogenous CHERP protein. A, top, immunocytochemistry of endogenous CHERP (red) in HEK293 (left) and SKBR3 cells (right). DAPI staining (blue) is shown in the middle panel, and as a composite merged image (bottom). B, triple staining of endogenous CHERP (red), ER (green), and nucleus (blue) in HEK293 cells. C, Western blot of cytoplasmic and nuclear fractions prepared from the indicated cell lines probed with anti-CHERP antibody (top) and a nuclear marker (CREB, bottom). D, immunofluorescence staining of endogenous CHERP protein in skeletal (bottom) and cardiac myocytes (top). E, immunolocalization of CHERP (red), nucleus (blue), and similar ER (green) in a rat cardiac myocyte. F, Western blots resolving CHERP distribution in cytoplasmic and nuclear fractions from cardiac myocytes and Jurkat cells. G, Western blots for CHERP in nuclei isolated manually from Xenopus oocytes (8 total nuclei), compared with the remaining cellular contents. Image shows isolated nucleus (N) in solution next to an intact oocyte. A, animal pole; V, vegetal pole.
Bioinformatic Analysis of CHERP
Previous bioinformatic analysis of the CHERP sequence advanced an interpretation of CHERP as an integral ER protein by putative assignment of dual transmembrane domains, some sequence homology to K+ channel architecture, and COOH-terminal ER-retention motifs (8). Reassessment of CHERP sequence homology using several different algorithms provided only equivocal support for these prior annotations. Notable was the lack of consistent prediction of transmembrane domains (Table 2). Rather, sequence analysis consistently predicted homology to domains found in nuclear proteins. Fig. 3A shows a schematic representation of the CHERP sequence and depicts the assignment of (i) a NH2-terminal SURP/SWAP (suppressor of white apricot) domain (18), (ii) a CID domain (RNA polymerase II CTD interacting domain (19)), (iii) a arginine/serine-rich (RS) domain (20), and (iv) a COOH-terminal G patch motif (21). These features identify CHERP as a “SR-related” protein, a conserved family of nuclear proteins that contain COOH-terminal RS domains (22). To our knowledge CHERP is a unique SR-related protein in possessing all four of these modules. Many of these domains are found in proteins known to act as splicing factors or more generally in RNA processing (18–21). For example, SURP and G patch domains are retained together in proteins thought to regulate pre-mRNA splicing (23). The family of CTD interacting domain (CID) proteins harboring serine/arginine-rich regions are called SCAFs (SR-related CTD-associated factors) and these proteins may play a role in co-transcriptional splicing (24). The known functional assignment of these domains is again supportive of a protein with a role in RNA processing. Putative homologs of CHERP are conserved in many vertebrates (amino acid identity >75%) and invertebrate species (Fig. 3B) and the SURP, CID, SR-rich, and G patch modules are conserved in the majority of these homologues (Fig. 3C).
FIGURE 3.
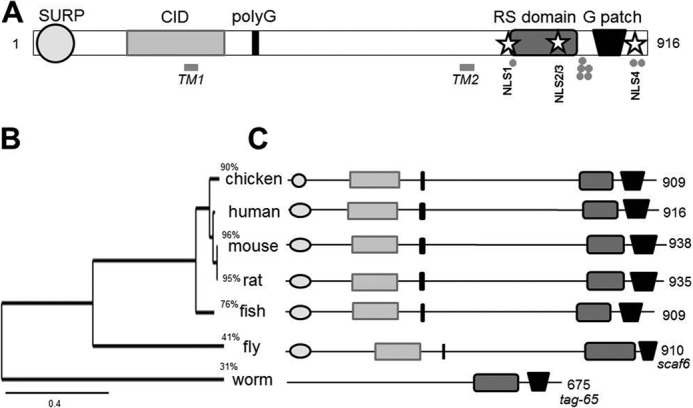
Bioinformatic annotation of the CHERP gene family. A, schematic representation of H. sapiens CHERP structure (NP_006378.3) to show annotation of features, including SURP domain (circle), CID (gray rectangle), polyglutamine tract (black bar), arginine/serine (RS)-rich region (dark gray rectangle), and G patch domain (trapezoid). Protein domains were annotated using a conserved domain search tool (38). Previously annotated transmembrane regions (TM) (8) are shown above the schematic, together with sites for phosphorylation identified from discovery-mode mass spectrometry data collated by PhosphoSite (small circles). Predicted NLS (stars) are indicated as NLS1 (amino acids 726–742), NLS2 and -3 (778–788/784–793), and NLS4 (898–912). B, phylogenetic tree (BioNJ/TreeDyn) of putative CHERP homologs in selected model organisms. Reference sequences for CHERP were as follows: Homo sapiens (NP_006378.3), Mus musculus (NP_613051.3), Rattus norvegicus (XP_214307.2), Gallus gallus (XP_001233544.1), Danio rerio (NP_956368.2), Drosphilia melanogaster (scaf6, NP_001014589.1), and Caenorhabditis elegans (tag-65, NP_506386.1). The scale indicates branch lengths. Percentages define the amino acid identity of individual genes with H. sapiens CHERP (NP_006378.3). C, overview of domain architecture of the CHERP protein in the indicated species as defined above.
Live Cell Imaging of GFP-tagged CHERP Constructs
Next, we used GFP-tagged full-length CHERP constructs to assess the live cell distribution and dynamics of CHERP by confocal imaging. Expression of either NH2 or COOH terminally tagged CHERP constructs (GFP-CHERP(1–916) or CHERP(1–916)-GFP) resulted in bright nuclear fluorescence in human cell lines, as assessed by colocalization of GFP fluorescence with DAPI staining (Fig. 4A). Similarly, nuclear staining was observed by immunofluorescence following expression of Myc-tagged CHERP constructs (data not shown). Comparison of GFP fluorescence intensities in regions of interest placed within the nucleus (“N”) or cytoplasm (“C”) was used to quantify the nuclear targeting bias of the full-length CHERP protein. An N:C ratio larger than 1 is indicative of nuclear enrichment, whereas a value <1 implies a bias toward cytoplasmic expression. Analysis of CHERP distribution yielded N:C ratios of 29 ± 3 for GFP-CHERP(1–916) and 29 ± 3 for CHERP(1–916)-GFP (n = 7–10 cells).
Higher magnification confocal images demonstrated regionalized targeting of GFP-tagged CHERP constructs within nuclear subdomains (Fig. 4B). Localized expression of endogenous CHERP within the nucleus was also apparent by immunofluorescence staining of the native protein (Fig. 4C). CHERP foci exhibited substantial co-localization with SC35, an essential splicing factor that is enriched in nuclear speckles (Fig. 4C). These CHERP subdomains were especially clear by immunofluorescence in cells expressing CHERP that were permeabilized and then fixed (Fig. 4D). This is informative as splicing factor components are known to be attached to the detergent-insoluble nuclear matrix (25, 26). In these preparations CHERP exhibited almost complete colocalization with SC35 (Fig. 4E), but no co-localization between CHERP foci and Cajal bodies was observed (identified by co-staining for p80-coilin, Fig. 4F). Finally, it is known that incubation of cells with RNA polymerase II inhibitors (such as actinomycin D, amanitin, and 5,6-dichloro-1-β-d-ribofuranosylbenzimidazole) results in clustering of splicing factor components into enlarged foci (25, 26). Treatment of transfected HeLa cells with 5,6-dichloro-1-β-d-ribofuranosylbenzimidazole resulted in CHERP accumulation within enlarged SC35-containing domains (Fig. 4G). On the basis of these data, we conclude that a substantial proportion of nuclear CHERP is present within nuclear speckles. This distribution is noteworthy in the context of (i) the high basic nature of CHERP (pI >9 (8)), a property shared with other proteins localizing to nuclear speckles (27); (ii) bioinformatic analysis suggesting CHERP is a SR-related protein, many of which are concentrated in nuclear speckles (22, 25); and (iii) the identity of other proteins that co-immunoprecipitate with CHERP that are known to localize to nuclear speckles (see Table 3).
TABLE 3.
Mass spectrometry analysis of proteins co-immunoprecipitating with CHERP
To identify proteins that may interact with CHERP, mass spectrometry data were filtered with two selection criteria: first, the assignment of ≥5 unique peptides and second, the ratio of peptide number assigned to the corresponding protein in CHERP over IgG >35. These criteria delimited 25 possible interactors shown in the table. Samples in bold indicate interactors predicted by database screening as highlighted in Fig. 6B.
| Protein name | Abbreviation | Accession No. | Molecular mass (kDa) | CHERP | IgG |
|---|---|---|---|---|---|
| Calcium homeostasis endoplasmic reticulum protein | CHERP | Q8IWX8 | 103 | 121 | 2 |
| U2 snRNP-associated SURP motif-containing protein | SR140 | O15042 | 118 | 115 | 3 |
| Splicing factor 3B subunit 2 | SF3B2 | Q13435 | 100 | 67 | 0 |
| Heterogeneous nuclear ribonucleoprotein U | HNRNPU | Q00839 | 91 | 52 | 0 |
| 116-kDa U5 small nuclear ribonucleoprotein component | EFTUD2 | B4DK30 | 105 | 46 | 0 |
| Bcl-2-associated transcription factor 1 | BCLAF1 | Q9NYF8 | 106 | 40 | 0 |
| Pinin | PNN | Q9H307 | 82 | 35 | 0 |
| Splicing factor 3B subunit 1 | SF3B1 | O75533 | 146 | 31 | 0 |
| Isoform 4 of Disks large homolog 1 | DLG1 | Q12959 | 100 | 18 | 0 |
| ATP-dependent RNA helicase DDX42 | DDX42 | Q86XP3 | 103 | 14 | 0 |
| Heterogeneous nuclear ribonucleoprotein U-like protein 1 | HNRNPUL1 | Q9BUJ2 | 96 | 13 | 0 |
| Protein 4.1 | EPB41 | P11171 | 97 | 13 | 0 |
| Isoform 3 of Importin-5 | IPO5 | O00410 | 117 | 13 | 0 |
| DNA-directed RNA polymerase | POLR1B | F5GZX4 | 132 | 12 | 0 |
| cDNA FLJ54400, highly similar to eukaryotic translation initiation factor 3 subunit 8 | NA | B4E1D5 | 104 | 12 | 0 |
| ATP-dependent RNA helicase A | DHX9 | Q08211 | 141 | 9 | 0 |
| Staphylococcal nuclease domain-containing protein 1 | SND1 | E7ESM6 | 101 | 9 | 0 |
| DIS3 | DIS3 | A8QI98 | 109 | 9 | 0 |
| DNA-directed RNA polymerase | POLR2B | C9J2Y9 | 133 | 8 | 0 |
| GC-rich sequence DNA-binding factor 1 | GCFC1 | Q9Y5B6 | 105 | 8 | 0 |
| Oxysterol-binding protein | DKFZp | Q68D75 | 97 | 7 | 0 |
| Rho GTPase-activating protein 11A | ARHGAP11A | Q6P4F7 | 114 | 7 | 0 |
| Protein flightless-1 homolog | FLII | Q13045 | 145 | 7 | 0 |
| Band 4.1-like protein 2 | EPB41L2 | O43491 | 113 | 7 | 0 |
| ATP-dependent DNA helicase Q5 | RECQL5 | B7Z8Y7 | 112 | 5 | 0 |
| Cell division cycle and apoptosis regulator protein 1 | CCAR1 | Q8IX12 | 131 | 5 | 0 |
Finally, we examined the targeting of a shorter form of CHERP (32 amino acids shorter, predicted molecular mass ∼100 kDa), derived from a differential 5′ translational start site (8). The “short” CHERP construct tagged with GFP (CHERP(33–916)-GFP) was also targeted to the nucleus with a similar distribution pattern to full-length CHERP (data not shown). Therefore, all localization studies support a nuclear residency of CHERP (and possible CHERP isoforms).
Truncation Analysis of CHERP
We hypothesized that the targeting of CHERP may depend on the integrity of a nuclear localization signal(s) within the primary sequence. Resolution of this sequence would both confirm, and allow manipulation of, the nuclear residency of CHERP. Profiling CHERP for putative nuclear targeting sequence identified three possible COOH-terminal regions harboring potential nuclear localization signals (NLSs). These comprised two bipartite sequences (NLS1, NLS4) as well as two overlapping NLS regions within the RS domain (NLS2/3, Fig. 3A). The RS domain of many SR proteins acts as a NLS by mediating an interaction with transportin-SR (22) and can also play a role in subnuclear targeting to nuclear speckles (28, 29). Therefore, to investigate the role of NH2-terminal and COOH-terminal domains as well as the putative NLS assignments in controlling CHERP distribution, we prepared a series of GFP-tagged truncation mutants of CHERP (Fig. 5A).
FIGURE 5.

Analysis of CHERP truncation mutants defines a region responsible for nuclear targeting. A, schematic overview of CHERP truncation mutants (symbols as defined in Fig. 3A). The GFP moiety was not depicted graphically. B, Western blot (WB) of cytoplasmic and nuclear fractions prepared from HEK293 cells transfected with the indicated CHERP truncation mutants or GFP alone and probed with a GFP antibody (left) or a CREB antibody (right). C, confocal live cell images show nuclear localization of wild-type CHERP (CHERP(1–916)-GFP), a NH2-terminal truncation mutant (CHERP(342–916)-GFP), and a COOH-terminal truncation (CHERP(1–725)-GFP). D, representative confocal images of a HEK293 cell co-transfected with CHERP(1–725)-GFP and DsRed2-ER that was subsequently stained with DAPI (blue). E, top, representative Western blot (GFP antibody) using WCL samples from HEK293 cells (mock transfected versus transfection of indicated constructs) confirmed expression of exogenous CHERP proteins. Bottom, schematic of a series of NH2- and COOH-terminal truncation mutants of CHERP. F, live cell confocal images of GFP-tagged CHERP truncation constructs expressed in HEK293 cells. The parental GFP vector was used as a control (GFP). G, quantitative analysis of CHERP construct distribution from confocal images, expressed as a ratio (N:C) on a logarithmic scale of fluorescence intensity in comparable nuclear and cytoplasmic regions of interest (*, p < 0.01).
First, we performed subcellular fractionation analysis to compare the overall targeting of NH2- and COOH-terminal truncations of CHERP with the full-length CHERP(1–916)-GFP protein. The NH2-terminal deletion (CHERP(342–916)-GFP) ablated the SURP, CID, and polyglutamine-rich regions. The COOH-terminal deletion (CHERP(1–725)-GFP) removed all four potential NLS sequences. Subcellular fractionation of HEK293 cell populations demonstrated that CHERP(1–916)-GFP and CHERP(342–916)-GFP were predominantly localized within the nuclear fraction, whereas the majority of CHERP(1–725)-GFP expression was cytoplasmic (Fig. 5B). These crude truncations suggested that the nuclear localization of CHERP was dependent on sequence within the COOH-terminal region of the protein.
Next, we used confocal imaging to assess the live cell distribution of the GFP-tagged constructs. Similar to results from the fractionation analysis, the NH2-terminal truncation (CHERP(342–916)-GFP]) was localized within the nucleus similar to CHERP(1–916)-GFP (Fig. 5C). The distribution of these constructs was quantified by a simple ratio of fluorescence intensity values between a similarly sized “region of interest” placed either in the nucleus or cytoplasm (“N:C ratio”) for multiple cells. This analysis supported the simple visual impression that removal of the NH2-terminal ∼340 amino acids from CHERP (CHERP(342–916)-GFP]) failed to impair nuclear targeting of the tagged construct (N:C ratios of 30 ± 2 and 30 ± 3 for CHERP(342–916)-GFP] and CHERP(1–916)-GFP respectively, n > 11 cells, Fig. 5G). In contrast, removal of the COOH-terminal region containing all potential NLS sequences resulted in a loss of the exclusive nuclear targeting. CHERP(1–725)-GFP was found throughout the cell (Fig. 5D), with a distribution more resembling GFP alone (N:C ratios of 2 ± 0.3 and 0.6 ± 0.04 (n = 7), respectively, Fig. 5G). The cytosolic CHERP(1–725)-GFP was distinct from the DsRed2-ER expression pattern (Fig. 5D).
A series of COOH-terminal truncations was prepared with the goal of sequentially removing NLS4 (CHERP(1–897)-GFP), the G patch domain (CHERP(1–838)-GFP), NLS2/3 (CHERP(1–777)-GFP), RS-domain (CHERP(1–742)-GFP), as well as a more complete truncation of the COOH terminus (CHERP(1–705)-GFP). Transfection of each construct into HEK293 cells resulted in expression of GFP-tagged constructs with progressively decreasing size (Fig. 5E), confirming appropriate expression of the truncation mutants. Confocal imaging of transfected cells revealed a restricted nuclear expression of all constructs with the exception of CHERP(1–725)-GFP (Fig. 5, C and D) and CHERP(1–705)-GFP, which showed a more pervasive expression in both the cytoplasm and nucleus (Fig. 5F). Similar results were obtained with NH2 terminally tagged versions of all these constructs (data not shown). Quantification of the image data supported the simple visual impression that removal of the COOH-terminal 175 amino acids from CHERP (CHERP(1–742)-GFP) failed to impair nuclear targeting of the tagged construct, whereas further truncation (CHERP(1–725)-GFP) resulted in a loss of nuclear localization (Fig. 5G). These data suggest that the NLS1 region of the protein (amino acid residues 726–742) was necessary to support the nuclear localization of CHERP. This reasoning was reinforced by the observation that CHERP(743–916)-GFP failed to accumulate in the nucleus (Fig. 5, F and G).
To identify which COOH-terminal region(s) was sufficient to direct CHERP expression to the nucleus, we examined the targeting of a series of COOH-terminal CHERP mutants. The NLS1 region alone (CHERP(726–742)-GFP) did not target to the nucleus (Fig. 5, F and G). Constructs expanding toward the COOH terminus were then screened (CHERP(726–777)-GFP, CHERP(726–838)-GFP) but only a construct incorporating the majority of the COOH terminus (CHERP(705–916)-GFP) proved sufficient for nuclear localization (Fig. 5, F and G). Expression of this construct resulted in a nuclear localization pattern that was similar to full-length CHERP (Fig. 5G), with a N:C ratio (∼8 ± 1.3, n = 15) significantly higher than other COOH-terminal constructs or GFP alone (Fig. 5G). These data suggest the COOH-terminal region was necessary and sufficient to direct nuclear targeting of CHERP.
CHERP Interaction with the U2 snRNP Complex
To identify proteins that interact with CHERP, samples used for immunoprecipitation analyses (Fig. 1D) were processed for LC-MS/MS. MS/MS spectra were assigned to peptides within the UniProt H. sapiens database (see “Experimental Procedures”), and the subsequently identified proteins were filtered by selection criteria (≥5 unique peptides in experimental samples or a ratio of >35 of peptide number assigned to the corresponding protein in CHERP over IgG samples). This processing yielded 26 discrete proteins (Table 3) and unsurprisingly peptides derived from CHERP predominated as expected from the immunoprecipitation approach used to generate these samples. Of the remaining 25 proteins, ontology analysis revealed that the majority of co-immunoprecipitated proteins were also nuclear, or known to distribute in both nuclear and cytoplasmic compartments (∼80%, Fig. 6A). Notably, the top two hits were components of the U2 small nuclear ribonucleoprotein (U2 snRNP) spliceosome complex, SR140 and SF3B2 (Table 3), and functional annotation assigned roles in RNA processing/splicing and transcription to the majority of candidates (∼70%, Fig. 6A).
FIGURE 6.

CHERP interacts with nuclear proteins, including SR140. A, Gene Ontology annotation (top, localization; bottom, function) of candidate CHERP-interacting proteins identified by mass spectrometry (listed in Table 3). B, predicted associations between several of the mass spectrometry candidates when their identities were submitted to a protein interactome database (see “Experimental Procedures”). Interactions confirmed by co-immunoprecipitation are shown by black lines. SF3B3 is a known partner in the SF3B complex and was not identified in the highest stringency tier of the mass spectrometry dataset but was interrogated in subsequent immunoprecipitation assays. C, validation of mass spectrometry candidates by co-immunoprecipitation and Western blotting. Left/middle, Western blots (WB) (anti-SR140 and CHERP) of WCL samples prepared from HEK293 cells following immunoprecipitation with an IgG (left lane) or a CHERP antibody (right lane) is shown. Right, a dual fluorescence Western blot showing no cross-reaction between CHERP and SR140 antibodies in control and CHERP-GFP overexpressing cells. D, co-immunoprecipitation of SF3B3 with CHERP. E, a representative Western blot result showing CHERP (top) and SR140 protein levels (middle) in mock, scramble, and CHERP siRNA-transfected HEK293 cells. β-Actin (ACTB) is used as a loading control. F, quantification of Western blotting results from E. *, p < 0.01, comparison of mock and scramble siRNA to CHERP siRNA; #, p < 0.01, comparison of mock to scramble siRNA.
In silico protein interaction analysis was performed by taking the mass spectrometry candidates and querying a human interactome database that collated computational and experimental data (see “Experimental Procedures”). This analysis highlighted six proteins from the top 10 hits of the mass spectrometry dataset that are interactors with the U2 snRNP complex, including the ATP-dependent RNA helicases (DDX42), the U5 snRNP component EFTUD2, and the heteregenous nuclear ribonucleoprotein U (Fig. 6B). It was therefore reassuring that many of the candidates from the immunoprecipitation analysis could be evidenced as known interactors. To further interrogate the validity of these interaction profiles, we probed the immunoprecipitated samples with antibodies for candidates identified in the mass spectrometry dataset. Fig. 6C shows a representative Western blot confirming co-immunoprecipitation of SR140 with CHERP. Given the similar size range of these proteins, we confirmed that the SR140 antibody did not recognize CHERP by examining staining patterns in a dual fluorescence Western (Fig. 6C). Co-immunoprecipitation was also observed between CHERP and SF3B2 (data not shown). As a further test of whether CHERP interacts with U2 snRNP components we screened for the presence of another component of the splicing factor SF3B complex (SF3B3), which was not identified within the highest stringency mass spectrometry candidate list (Table 3). Western blotting identified SF3B3 in CHERP immunoprecipitates (Fig. 6D) providing further support for the proposed association of CHERP with the U2 snRNP.
CHERP Regulates SR140 Expression
To analyze the cellular role of CHERP, we examined the effects of CHERP ablation. In HEK293 cells transfected with CHERP siRNA (see “Experimental Procedures”), the level of CHERP protein decreased to 32 ± 5% of endogenous levels as assessed by densitometry of Western blots (Fig. 6, E and F). Levels of CHERP protein remained high in cells treated with scramble RNAi (112 ± 4% of control). Interestingly, comparison of SR140 levels between CHERP RNAi and scrambled RNAi samples revealed a decrease in SR140 protein only in cells where CHERP was targeted for ablation (47 ± 6% of expression levels observed in mock transfected cells, Fig. 6, E and F). Therefore, CHERP knockdown caused a decrease in the levels of an established “A” complex protein that we demonstrate here is a binding partner of CHERP (Fig. 6, Table 3).
DISCUSSION
The protein CHERP was originally identified from expression library screening with a monoclonal antibody (mAb213-21 (8)) that blocked IP3-evoked calcium release in several cell types (8, 10). CHERP was found to be widely expressed (8), and shown by immunocytochemistry to colocalize with ER markers in several cell types (8, 9). In vitro translation of the CHERP cDNA yielded a ∼128 kDa protein on Western blots, the reactivity of which was ablated following antisense knockdown with CHERP cDNA (8). Original bioinformatic analyses predicted dual transmembrane spanning domains, as well as ER targeting and K+ channel-like motifs that were consistent with a role for CHERP in regulating K+ flux (8), as supported by immunoaffinity purification of CHERP as an integral membrane protein and experiments showing the ability of mAb213-21 to block Ca2+ release could be reversed by nigericin or valinomycin (10). The ability of CHERP to support agonist-evoked Ca2+ mobilization from the ER was viewed as important for regulating cell cycle progression, as impairment of CHERP function by antisense methods resulted in decreased cellular proliferation and impaired NFAT activation (8, 9). Recently, this interpretation was reinforced by a study showing that CHERP was co-purified and co-localized with RyR1 in skeletal muscle, where it was again functionally implicated as a regulator of intracellular Ca2+ release as a direct binding partner of RyRs in sarcoplasmic reticulum (11). Therefore, to date, the consensus has been that CHERP acts as an integral ER membrane protein that regulates intracellular Ca2+ release, possibly by regulating the K+ permeability of the ER (8, 9) or via direct interaction with RyR1 (11).
This study supports an entirely different cellular role for CHERP, as a nuclear protein localized to nuclear speckles and likely involved in regulation of spliceosomal function. The observed effects of CHERP on Ca2+ signaling would then be secondary to a role in the regulation of RNA processing, rather than the prior consensus that CHERP acts cytoplasmically to regulate intracellular Ca2+ channel activity. Our re-evaluation is based on the following data.
First, CHERP is a nuclear protein. In several cell types, immunostaining revealed endogenous CHERP localized to the nucleus (Figs. 2 and 4). These localization studies utilized an antibody that was verified to recognize CHERP protein by immunoprecipitation, mass spectrometry, and siRNA methods. Furthermore, the nuclear localization of CHERP was supported by the identification of a sequence within the COOH-terminal portion of CHERP (Fig. 5), which was necessary and sufficient for conferring nuclear localization of GFP-tagged constructs. Notably the region necessary for nuclear localization of CHERP (residues 726–742) comprises a bipartite NLS upstream of an RS-rich region, an organizational motif that has previously been evidenced to be important for targeting of some, but not all (29), SR proteins to nuclear speckles (28). Confocal data clearly resolved CHERP localized within discrete nuclear subdomains. These included nuclear speckles (25) as shown by colocalization of a subset of CHERP foci with SC35. This co-localization was enhanced upon treatment of cells with the transcription inhibitor 5,6-dichloro-1-β-d-ribofuranosylbenzimidazole (Fig. 4G).
Furthermore, CHERP was co-immunoprecipitated with known components of the spliceosomal complex (Table 3 and Fig. 6B), an outcome consistent with previous larger scale, discovery orientated mass spectrometry screens (16, 17, 30, 31). Specific interactions with SR140 and SF3B components of 17S U2 snRNP complexes were confirmed by co-immunoprecipitation and Western blotting methods (Fig. 6, C and D). On the basis of these associations, we examined the impact of CHERP knockdown on SR140 and resolved that CHERP expression and SR140 expression were correlated. Notably, in CHERP siRNA cells, the expected decrease in CHERP expression resulted in an unexpected decrease in SR140 levels. (Fig. 6, E and F).
Contrasting with this experimental dataset, it is notable that the ER model for CHERP activity lacks direct evidence for K+ transport (8) and receives ambiguous bioinformatic support for the requisite architectural motifs such as transmembrane domains (Table 2). Further studies are obviously needed to define the precise role played by CHERP in the regulation of splicing and/or transcription, and the extent to which the function of this conserved protein is preserved between different organisms (Fig. 3B).
How can this new interpretation be harmonized with the prior literature? First, there is no disparity with the previous reported functional effects of CHERP ablation, namely attenuation of agonist-evoked Ca2+ signaling and decreased cellular proliferation (8, 9, 11). Although, these data were originally ascribed to inhibition of ER Ca2+ mobilization, these functional effects may equally be explained by interference of spliceosome function. Loss of function of several U2 snRNP components, by genetic or pharmacological methods, can interfere with cell growth and induce cell cycle arrest (32–34). Therefore, we have no particular reason to doubt previous functional data showing that loss of CHERP function induces cellular senescence, but believe that changes in ER calcium homeostasis are consequent to, rather than causative of, these effects. Assigning the precise role of CHERP in splicing will not be a trivial task. More than 200 proteins copurify with human spliceosomal complexes, and the major challenge in this field is assigning a functional impact to these individual proteins. For example, half of the SR-related factors have themselves no currently assigned function in splicing even though they are clearly spliceosomal components. Our knockdown data show CHERP impacts SR140 levels, and although no known role is currently ascribed to vertebrate SR140 it is interesting that ablation of the Arabidopsis SR140 ortholog (RRC1) caused aberrant alternative splicing outcomes (35).
Second, how can the disparate reports of CHERP localization (ER versus nucleus) using anti-CHERP antibodies be reconciled? There is no reason to doubt the specificity of the monoclonal antibody originally used to isolate CHERP. mAb213-21 recognized a band of the appropriate molecular size and immunoreactivity was attenuated by antisense ablation of CHERP (8). However, two aspects of its generation are notable, the antibody was an IgM species raised against platelet ER membrane vesicles. Platelets are anuclear and spliceosomal components are found in the cytoplasm of platelets (36), providing a possible explanation for the atypical presence of significant amounts of CHERP in the ER membrane fractions used for immunization. Second, the larger size of the IgM antibody (∼6-fold larger, 900 versus 150 kDa for IgG) may have impaired nuclear penetrance and resolution of intranuclear CHERP staining depending on the protocol used. Residual ER staining (8, 9) may possibly imply a secondary function of CHERP in the cytoplasm, for example, during open mitosis.
Third, the recent co-localization and co-purification of CHERP with RyR1 in rat soleus muscle clearly contrasts with our data (11). Using the same antibody, we do not observe a similar ER localization in several cell types, including skeletal and cardiac muscle (Fig. 2, D and E). mAb213-21 was also previously demonstrated not to bind to similar ER membrane proteins from skeletal muscle, or inhibit caffeine-dependent Ca2+ release from skeletal muscle similar ER membranes (10). Although CHERP was proposed as a RyR1-interacting protein following overexpression of a RyR1 fragment in HEK293 cells, one concern would be whether this result was derived from nonphysiological association of the two proteins when removed from their normal subcellular environments (CHERP released from nuclei, overexpressed RyR1 fragments removed from the juxtamembrane compartment). Even if this interpretation were to be supported by co-immunoprecipitation data showing that soluble CHERP ligand associated with proteins within the ER, then the model of CHERP as an integral ER protein (8, 9) interacting with RyR1 (11) seems remote. One could envisage a cytoplasmic function for CHERP during open mitosis (34, 37), or an alternatively spliced (8) and neofunctionalized CHERP isoform exhibiting cytoplasmic residency. However, on the balance of data provided here, further studies are needed to support any functional role for CHERP in the cytoplasm. We propose that future studies investigating CHERP should use the SCAF6 designator (SR-related CTD associated factor 6) rather than the CHERP designator, as the latter infers an ER localization.
In conclusion, our data underscore a new role for CHERP in nuclear splicing, adding a new regulator to the massive list of proteins known to associate with the spliceosomal machinery (16, 17, 30, 31). This reinterpretation of the cellular role of CHERP is consistent with all previous functional data showing the role of CHERP in cellular proliferation (8, 9, 11), but offers an entirely new mechanistic interpretation for these effects.
Acknowledgments
We thank the Thompson and Metzger laboratories at the University of Minnesota for preparation of skeletal muscle slices and cardiac myocytes. We are also grateful for technical support from the Center for Mass Spectrometry and Proteomics at the University of Minnesota and the various supporting agencies of this facility, including National Science Foundation Major Research Instrumentation Grants NSF-DBI-0215759 and 9871237 used to purchase the core instruments used in this study.
This work was supported, in whole or in part, by National Institutes of Health Grant GM088790 (to J. S. M.).
- RyR
- ryanodine receptor
- CHERP
- Ca2+ homeostasis endoplasmic reticulum protein
- CREB
- cAMP-response element-binding protein
- ER
- endoplasmic reticulum
- CID
- CTD interacting domain
- NLS
- nuclear localization signal
- SF3B3
- splicing factor SF3B3
- WCL
- whole cell lysate
- BisTris
- 2-[bis(2-hydroxyethyl)amino]-2-(hydroxymethyl)propane-1,3-diol.
REFERENCES
- 1. Foskett J. K., White C., Cheung K. H., Mak D. O. (2007) Inositol trisphosphate receptor Ca2+ release channels. Physiol. Rev. 87, 593–658 [DOI] [PMC free article] [PubMed] [Google Scholar]
- 2. Lipskaia L., Lompré A. M. (2004) Alteration in temporal kinetics of Ca2+ signaling and control of growth and proliferation. Biol. Cell 96, 55–68 [DOI] [PubMed] [Google Scholar]
- 3. Crabtree G. R. (2001) Calcium, calcineurin, and the control of transcription. J. Biol. Chem. 276, 2313–2316 [DOI] [PubMed] [Google Scholar]
- 4. Boulware M. J., Marchant J. S. (2008) Timing in cellular Ca2+ signaling. Curr. Biol. 18, R769-R776 [DOI] [PMC free article] [PubMed] [Google Scholar]
- 5. Missiaen L., Robberecht W., van den Bosch L., Callewaert G., Parys J. B., Wuytack F., Raeymaekers L., Nilius B., Eggermont J., De Smedt H. (2000) Abnormal intracellular Ca2+ homeostasis and disease. Cell Calcium 28, 1–21 [DOI] [PubMed] [Google Scholar]
- 6. Benkusky N. A., Farrell E. F., Valdivia H. H. (2004) Ryanodine receptor channelopathies. Biochem. Biophys. Res. Commun. 322, 1280–1285 [DOI] [PubMed] [Google Scholar]
- 7. Choe C. U., Ehrlich B. E. (2006) The inositol 1,4,5-trisphosphate receptor (IP3R) and its regulators. Sometimes good and sometimes bad teamwork. Sci. STKE 2006, re15. [DOI] [PubMed] [Google Scholar]
- 8. Laplante J. M., O'Rourke F., Lu X., Fein A., Olsen A., Feinstein M. B. (2000) Cloning of human Ca2+ homoeostasis endoplasmic reticulum protein (CHERP). Regulated expression of antisense cDNA depletes CHERP, inhibits intracellular Ca2+ mobilization and decreases cell proliferation. Biochem. J. 348, 189–199 [PMC free article] [PubMed] [Google Scholar]
- 9. O'Rourke F. A., LaPlante J. M., Feinstein M. B. (2003) Antisense-mediated loss of calcium homoeostasis endoplasmic reticulum protein (CHERP; ERPROT213–21) impairs Ca2+ mobilization, nuclear factor of activated T-cells (NFAT) activation and cell proliferation in Jurkat T-lymphocytes. Biochem. J. 373, 133–143 [DOI] [PMC free article] [PubMed] [Google Scholar]
- 10. O'Rourke F., Soons K., Flaumenhauft R., Watras J., Baio-Larue C., Matthews E., Feinstein M. B. (1994) Ca2+ release by inositol 1,4,5-trisphosphate is blocked by the K+-channel blockers apamin and tetrapentylammonium ion, and a monoclonal antibody to a 63 kDa membrane protein. Reversal of blockade by K+ ionophores nigericin and valinomycin and purification of the 63 kDa antibody-binding protein. Biochem. J. 300, 673–683 [DOI] [PMC free article] [PubMed] [Google Scholar]
- 11. Ryan T., Sharma P., Ignatchenko A., MacLennan D. H., Kislinger T., Gramolini A. O. (2011) Identification of novel ryanodine receptor 1 (RyR1) protein interaction with calcium homeostasis endoplasmic reticulum protein (CHERP). J. Biol. Chem. 286, 17060–17068 [DOI] [PMC free article] [PubMed] [Google Scholar]
- 12. Rodenbaugh D. W., Wang W., Davis J., Edwards T., Potter J. D., Metzger J. M. (2007) Parvalbumin isoforms differentially accelerate cardiac myocyte relaxation kinetics in an animal model of diastolic dysfunction. Am. J. Physiol. Heart Circ. Physiol. 293, H1705-H1713 [DOI] [PubMed] [Google Scholar]
- 13. Kostal V., Levar K., Swift M., Skillrud E., Chapman M., Thompson L. V., Arriaga E. A. (2011) Semi-automated image analysis. Detecting carbonylation in subcellular regions of skeletal muscle. Anal. Bioanal. Chem. 400, 213–222 [DOI] [PMC free article] [PubMed] [Google Scholar]
- 14. Rappsilber J., Ishihama Y., Mann M. (2003) Stop and go extraction tips for matrix-assisted laser desorption/ionization, nanoelectrospray, and LC/MS sample pretreatment in proteomics. Anal. Chem. 75, 663–670 [DOI] [PubMed] [Google Scholar]
- 15. Chaurasia G., Malhotra S., Russ J., Schnoegl S., Hänig C., Wanker E. E., Futschik M. E. (2009) UniHI 4. New tools for query, analysis and visualization of the human protein-protein interactome. Nucleic Acids Res. 37, D657–660 [DOI] [PMC free article] [PubMed] [Google Scholar]
- 16. Hartmuth K., Urlaub H., Vornlocher H. P., Will C. L., Gentzel M., Wilm M., Lührmann R. (2002) Protein composition of human prespliceosomes isolated by a tobramycin affinity-selection method. Proc. Natl. Acad. Sci. U.S.A. 99, 16719–16724 [DOI] [PMC free article] [PubMed] [Google Scholar]
- 17. Will C. L., Urlaub H., Achsel T., Gentzel M., Wilm M., Lührmann R. (2002) Characterization of novel SF3b and 17S U2 snRNP proteins, including a human Prp5p homologue and an SF3b DEAD-box protein. EMBO J. 21, 4978–4988 [DOI] [PMC free article] [PubMed] [Google Scholar]
- 18. Kuwasako K., He F., Inoue M., Tanaka A., Sugano S., Güntert P., Muto Y., Yokoyama S. (2006) Solution structures of the SURP domains and the subunit-assembly mechanism within the splicing factor SF3a complex in 17S U2 snRNP. Structure 14, 1677–1689 [DOI] [PubMed] [Google Scholar]
- 19. Noble C. G., Hollingworth D., Martin S. R., Ennis-Adeniran V., Smerdon S. J., Kelly G., Taylor I. A., Ramos A. (2005) Key features of the interaction between Pcf11 CID and RNA polymerase II CTD. Nat. Struct. Mol. Biol. 12, 144–151 [DOI] [PubMed] [Google Scholar]
- 20. Boucher L., Ouzounis C. A., Enright A. J., Blencowe B. J. (2001) A genome-wide survey of RS domain proteins. RNA 7, 1693–1701 [PMC free article] [PubMed] [Google Scholar]
- 21. Aravind L., Koonin E. V. (1999) G-patch. A new conserved domain in eukaryotic RNA-processing proteins and type D retroviral polyproteins. Trends Biochem. Sci. 24, 342–344 [DOI] [PubMed] [Google Scholar]
- 22. Long J. C., Caceres J. F. (2009) The SR protein family of splicing factors. Master regulators of gene expression. Biochem. J. 417, 15–27 [DOI] [PubMed] [Google Scholar]
- 23. Sampson N. D., Hewitt J. E. (2003) SF4 and SFRS14, two related putative splicing factors on human chromosome 19p13.11. Gene 305, 91–100 [DOI] [PubMed] [Google Scholar]
- 24. Patturajan M., Wei X., Berezney R., Corden J. L. (1998) A nuclear matrix protein interacts with the phosphorylated C-terminal domain of RNA polymerase II. Mol. Cell. Biol. 18, 2406–2415 [DOI] [PMC free article] [PubMed] [Google Scholar]
- 25. Spector D. L., Lamond A. I. (2011) Nuclear speckles. Cold Spring Harbor Persp. Biol. 3 [DOI] [PMC free article] [PubMed] [Google Scholar]
- 26. Spector D. L. (1993) Macromolecular domains within the cell nucleus. Annu. Rev. Cell Biol. 9, 265–315 [DOI] [PubMed] [Google Scholar]
- 27. Bickmore W. A., Sutherland H. G. (2002) Addressing protein localization within the nucleus. EMBO J. 21, 1248–1254 [DOI] [PMC free article] [PubMed] [Google Scholar]
- 28. Hedley M. L., Amrein H., Maniatis T. (1995) An amino acid sequence motif sufficient for subnuclear localization of an arginine/serine-rich splicing factor. Proc. Natl. Acad. Sci. U.S.A. 92, 11524–11528 [DOI] [PMC free article] [PubMed] [Google Scholar]
- 29. Cáceres J. F., Misteli T., Screaton G. R., Spector D. L., Krainer A. R. (1997) Role of the modular domains of SR proteins in subnuclear localization and alternative splicing specificity. J. Cell Biol. 138, 225–238 [DOI] [PMC free article] [PubMed] [Google Scholar]
- 30. Ingham R. J., Colwill K., Howard C., Dettwiler S., Lim C. S., Yu J., Hersi K., Raaijmakers J., Gish G., Mbamalu G., Taylor L., Yeung B., Vassilovski G., Amin M., Chen F., Matskova L., Winberg G., Ernberg I., Linding R., O'donnell P., Starostine A., Keller W., Metalnikov P., Stark C., Pawson T. (2005) WW domains provide a platform for the assembly of multiprotein networks. Mol. Cell. Biol. 25, 7092–7106 [DOI] [PMC free article] [PubMed] [Google Scholar]
- 31. Jurica M. S., Moore M. J. (2003) Pre-mRNA splicing. Awash in a sea of proteins. Mol. Cell 12, 5–14 [DOI] [PubMed] [Google Scholar]
- 32. Rymond B. (2007) Targeting the spliceosome. Nat. Chem. Biol. 3, 533–535 [DOI] [PubMed] [Google Scholar]
- 33. Kittler R., Putz G., Pelletier L., Poser I., Heninger A. K., Drechsel D., Fischer S., Konstantinova I., Habermann B., Grabner H., Yaspo M. L., Himmelbauer H., Korn B., Neugebauer K., Pisabarro M. T., Buchholz F. (2004) An endoribonuclease-prepared siRNA screen in human cells identifies genes essential for cell division. Nature 432, 1036–1040 [DOI] [PubMed] [Google Scholar]
- 34. Hofmann J. C., Husedzinovic A., Gruss O. J. (2010) The function of spliceosome components in open mitosis. Nucleus 1, 447–459 [DOI] [PMC free article] [PubMed] [Google Scholar]
- 35. Shikata H., Shibata M., Ushijima T., Nakashima M., Kong S. G., Matsuoka K., Lin C., Matsushita T. (2012) The RS domain of Arabidopsis splicing factor RRC1 is required for phytochrome B signal transduction. Plant J. 70, 727–738 [DOI] [PubMed] [Google Scholar]
- 36. Denis M. M., Tolley N. D., Bunting M., Schwertz H., Jiang H., Lindemann S., Yost C. C., Rubner F. J., Albertine K. H., Swoboda K. J., Fratto C. M., Tolley E., Kraiss L. W., McIntyre T. M., Zimmerman G. A., Weyrich A. S. (2005) Escaping the nuclear confines. Signal-dependent pre-mRNA splicing in anucleate platelets. Cell 122, 379–391 [DOI] [PMC free article] [PubMed] [Google Scholar]
- 37. Takenaka K., Nakagawa H., Miyamoto S., Miki H. (2004) The pre-mRNA-splicing factor SF3a66 functions as a microtubule-binding and -bundling protein. Biochem. J. 382, 223–230 [DOI] [PMC free article] [PubMed] [Google Scholar]
- 38. Marchler-Bauer A., Lu S., Anderson J. B., Chitsaz F., Derbyshire M. K., DeWeese-Scott C., Fong J. H., Geer L. Y., Geer R. C., Gonzales N. R., Gwadz M., Hurwitz D. I., Jackson J. D., Ke Z., Lanczycki C. J., Lu F., Marchler G. H., Mullokandov M., Omelchenko M. V., Robertson C. L., Song J. S., Thanki N., Yamashita R. A., Zhang D., Zhang N., Zheng C., Bryant S. H. (2011) CDD. A conserved domain database for the functional annotation of proteins. Nucleic Acids Res. 39, D225–229 [DOI] [PMC free article] [PubMed] [Google Scholar]