Abstract
Context:
Free fatty acids (FFAs) and triglycerides (TGs) are altered postburn, but whether these alterations are associated with postburn outcomes is not clear.
Objective:
The aim of the present study was to analyze lipid metabolic profiles in pediatric burn patients and to correlate these profiles with patient outcomes and hospital courses.
Design and Setting:
We conducted a prospective cohort study at an academic pediatric hospital burn center.
Patients:
Our study included 219 pediatric burn patients.
Main Outcome Measures:
Patients were stratified according to their plasma TG and FFA levels. Main patient outcomes, such as postburn morbidity and mortality, and clinical metabolic markers were analyzed.
Results:
All groups were similar in demographics and injury characteristics. Patients with elevated TGs had significantly worse clinical outcomes associated with increased acute-phase protein synthesis indicating augmented inflammation and hypermetabolism, whereas increased FFAs did not seem to profoundly alter postburn outcomes.
Conclusions:
Elevated TGs, but not FFAs, postburn are associated with worsened organ function and clinical outcomes.
Hypermetabolism including hyperglycemia, insulin resistance, and catabolism, is a hallmark of severely burned patients and affects the clinical course and outcomes (1, 2). The focus of ongoing studies has been insulin resistance and hyperglycemia because euglycemic control improves outcomes in burn and critically ill patients (3, 4). However, it appears that another metabolic pathway plays an important role affecting post burn outcomes—the fat metabolism (5–7). Burn induces profound lipolysis consisting of the breakdown (hydrolysis) of triacylglycerol into free fatty acids (FFAs) and glycerol. Interestingly, despite increased lipolysis, plasma FFA concentrations can be increased or decreased, which can be due to hypoalbuminemia or increased intracellular FFA turnover, which is part of the futile cycle involving the breakdown of adipose and muscle triglycerides (TGs) into FFAs (5–7). Increased TGs and FFAs, however, lead to fatty infiltration of vital organs, especially the liver. Accordingly, fatty liver is very common postburn and is associated with increased clinical morbidities as well as metabolic alterations (2, 8–12). Postburn pathology examinations (8, 11) and spectroscopy studies have shown that burned children have a 3- to 5-fold increase in hepatic TGs (10, 13), associated with increased incidence of infection, sepsis, and poor outcome (14, 15).
Of special interest is that not only do TGs and FFAs contribute to postburn morbidity and mortality by fatty infiltration of various organs, but it was also shown that FFAs and TGs can mediate insulin resistance (16). FFAs and TGs impair insulin-stimulated glucose uptake (17, 18) and induce insulin resistance through inhibition of glucose transport activity (19). In the context of type 2 diabetes, it has been shown that increased FFA and TG levels are predictive for incidence and severity of the disease (20). These data are in agreement with various other recent studies that showed a strong relationship between fat and glucose metabolism (21). Data therefore suggest that fat metabolism contributes to postburn morbidity and mortality, but the role of FFAs and TGs in critically ill patients is not completely understood. To date, no large clinical study focused on these two important markers of the lipid metabolism postburn. The aim of the present study was to determine how elevated plasma FFA and TG levels influence the metabolic response, circulating metabolites, and patient outcomes.
Patients and Methods
A cohort of 219 pediatric burn patients with second- and third-degree burns between 30 and 70% of the total body surface area (TBSA) admitted to our burn center were included in this analysis. Patients were stratified according to mean plasma FFA and TG values of the first 60 d postburn injury. Patients with plasma FFA concentrations greater than 0.6 mmol/liter were assigned to the FFA group, and those with TG concentrations greater than 180 mg/dl to the TG group.
All patients underwent the same resuscitation protocol according to the Galveston formula and surgical treatment regimen (2, 22) as well as total burn wound excision within 48 h after admission and consecutive wound coverage with autologous skin and donor sites. During acute hospitalization, all patients received a low-fat enteral nutrition (Vivonex T.E.N.; Sandoz Nutritional, Minneapolis, MN) consisting of 15% amino acids, 3% fat, and 82% carbohydrates. All patients received the same amount of calories: 1500 kcal/m2 body surface area plus 1500 kcal/m2 burned of TBSA per day (2).
Patient demographics (age, date of burn and admission, sex, burn size, and depth of burn) and concomitant injuries such as inhalation injury, sepsis, morbidity, and mortality were recorded. Organ failure and multiorgan failure were assessed according to the DENVER2 score definitions (2, 23, 24). Sepsis was defined as a positive blood culture or pathological tissue specimen identifying the pathogen during hospitalization or at autopsy, in combination with at least three of the following: leucocytosis or leucopenia (>12,000 or <4,000), hyperthermia or hypothermia (>38.5 or <36.5 C), tachycardia (>150 beats/min in children), refractory hypotension (systolic BP <90 mm Hg), thrombocytopenia (platelets <50,000/mm3), hyperglycemia (serum glucose >240 mg/dl), and enteral feeding intolerance (residuals >200 ml/h or diarrhea >1 liter/d) (25). We further determined time between operations as a measure for wound healing/reepithelization.
Glucose, TGs, FFAs, blood urea nitrogen, and plasma proteins
Blood samples were collected from all patients at admission and consecutively at routine time points throughout the hospital stay. Blood was drawn in a serum-separator collection tube and centrifuged for 10 min at 1320 rpm; the serum was removed and stored at −70 C until assayed (2).
Serum proteins were determined using HPLC, nephelometry (BNII plasma protein analyzer; Dade Behring, Bowie, MD), and ELISA techniques. Plasma glucose and TG levels were measured using a multianalyzer (RA-1000; Technicon, Tarrytown, NY). A copper nitrate/ethanolamine assay was used for the determination of FFA concentration (2).
Body mass index (BMI)
BMI was calculated according to the formula: BMI = weight (kilograms)/height2 (square meters). BMI was normalized for age by calculation of the percentile ranks for children according to the definitions of the World Health Organization.
Liver volume
Liver size was determined by ultrasound, which was conducted weekly as a clinical routine. Liver size/volume was calculated based on established methods (8, 26).
Ethics and statistics
This study was reviewed and approved by the Institutional Review Board of the University of Texas Medical Branch, Galveston, TX. Before the study, each subject, parent, or child's legal guardian signed a written informed consent form. Statistical analysis was performed by using Student's t test, χ2 analysis, and Wilcoxon rank sum test. Data are expressed as means ± sd or sem, where appropriate. Significance was accepted at P < 0.05.
Results
Demographics
A total of 219 pediatric burn patients were included in this analysis (Table 1), of which 127 patients had normal FFA and TG levels, 46 elevated FFA, and 63 elevated TG. Seventeen patients had both elevated FFA and TG levels, and we assigned these patients to both groups. All three patient populations were similar in age, gender, and ethnic distribution. The average BMI (normal, 19.8; FFA, 19.1; TG, 21.1 kg/m2) and BMI percentile corrected for age (normal, 73.8; FFA, 72.5; TG, 80.6) did not show significant differences among the groups. Injury characteristics were comparable regarding total area burn size (normal, 51 ± 10%; FFA, 53 ± 10%; TG, 53 ± 11%), second degree (normal, 12 ± 16%; FFA, 13 ± 16%; TG, 12 ± 16%), third degree (normal, 39 ± 19%; FFA, 40 ± 18%; TG, 40 ± 19%), incidence of inhalation injury [normal, 55 (43%); FFA, 17 (37%); TG, 28 (44%)], and burn type.
Table 1.
All groups showed consistency in their demographics and injury characteristics at admission
| Normal | FFA high | TG high | P value | |
|---|---|---|---|---|
| n | 127 | 46 | 63 | |
| FFA (mmol/liter) | 0.3 ± 0.2a | 0.9 ± 0.2a | 0.5 ± 0.3a | <0.001 |
| TG (mg/dl) | 131.0 ± 26.9a | 169.0 ± 53.9a | 231.0 ± 45.0a | <0.001 |
| BMI percentile | 73.8 | 72.5 | 80.6 | NS |
| BMI absolute | 19.8 | 19.1 | 21.1 | NS |
| Gender (n) | ||||
| Male | 86 | 32 | 31 | |
| Female | 41 | 14 | 32 | |
| Ethnicity (n) | ||||
| African-American | 7 | 1 | 6 | |
| Caucasian | 14 | 7 | 10 | |
| Hispanic | 105 | 38 | 47 | |
| Other | 1 | 0 | 0 | |
| Age at admit (yr) | 7.8 ± 5.1 | 7.7 ± 5.1 | 6.7 ± 4.3 | |
| Type of burn [n (%)] | ||||
| Inhalation injury | 55 (43.3) | 17 (37.0) | 28 (44.4) | |
| Flame | 98 (77.2) | 40 (87.0) | 49 (77.8) | NS |
| Scald | 15 (11.8) | 5 (10.9) | 12 (19.0) | NS |
| Other | 14 (11.0) | 1 (2.2) | 2 (3.2) | NS |
| TBSA (%) | ||||
| Burn | 51 ± 10 | 53 ± 10 | 53 ± 11 | NS |
| Second degree | 12 ± 16 | 13 ± 16 | 12 ± 16 | NS |
| Third degree | 39 ± 19 | 39 ± 18 | 40 ± 19 | NS |
All patients were comparable regarding their BMI with no significant differences among the groups. Most patients had normal FFA and TG levels throughout the hospital course. Seventeen patients (group not shown) had combined elevated FFA and TG. Data are shown as mean ± sd. NS, Not significant.
Significant difference between all three groups, P < 0.05.
Lipid metabolism
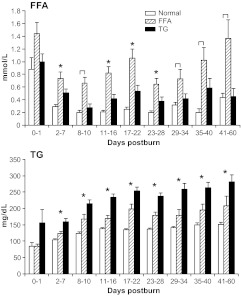
Serum FFA and TG levels are shown in Fig. 1. FFA levels are elevated in all groups immediately postburn (d 0–1). The FFA group had significantly (P < 0.05) higher FFA levels throughout the hospital course compared with normal and TG. The patients with high TG had, however, significantly (P < 0.05) higher FFA levels compared with normal at 2–7 and 11–28 d postburn, P < 0.05 (Fig. 1). TG levels significantly increased in all three groups over time compared with admission values. Normal patients had the lowest levels at a relatively stable state, whereas FFA and TG patients displayed increasing levels over time in a similar pattern. However, TGs were significantly increased in the high-TG group when compared with the other two groups (P < 0.05) (Fig. 1).
Fig. 1.
FFAs and TGs throughout the hospital course. FFA and TG levels were consistently different among the groups for the whole observation period. Brackets annotate significances (P < 0.05) between the indicated groups and asterisks among the normal vs. FFA and TG groups.
Clinical outcomes
Clinical outcomes are shown in Table 2 and indicate that all three groups required the same number of operations and same time between the operations. However, we found that patients with high TG spent the longest time in the intensive care unit when compared with normal burn patients (P = 0.045) (Table 2). Patients with high TG, furthermore, had remarkable but not statistically significant higher DENVER2 scores compared with normal. The incidence of multiorgan failure was highest in the TG groups when compared with normal, resulting in a significantly (P < 0.035) higher mortality in the TG group compared with normal patients (Table 2).
Table 2.
Postburn clinical outcomes
| Normal | FFA high | TG high | P value | |
|---|---|---|---|---|
| n | 127 | 46 | 63 | |
| Number of OR | 4.0 ± 2.0 | 3.5 ± 1.7 | 4.2 ± 2.0 | NS |
| Time between OR (d) | 5.2 ± 1.4 | 4.8 ± 1.6 | 5.2 ± 1.8 | NS |
| LOS ICU (d) | 29.6 ± 13.9 | 25.4 ± 12.4a | 33.1 ± 18.5a | 0.015 |
| LOS/TBSA | 0.6 ± 0.2a | 0.5 ± 0.2a | 0.6 ± 0.4 | <0.05 |
| Max DENVER2 | 3.2 ± 1.3 | 3.4 ± 1.3 | 3.7 ± 1.6 | NS |
| Multiorgan failure [n (%)] | 12 (9)a | 5 (11) | 12 (19)a | 0.030 |
| Sepsis [n (%)] | 9 (7) | 5 (11) | 7 (11) | NS |
| Died [n (%)] | 3 (2.4)a | 3 (6.5) | 5 (7.9)a | 0.035 |
ICU, Intensive care unit; LOS, length of stay; NS, not significant; OR, operations.
Significant difference between groups, P < 0.05.
Glucose metabolism
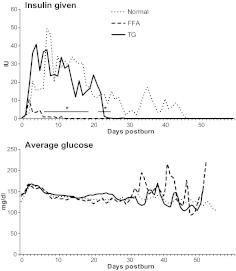
All three groups had elevated glucose levels during the first 2 wk postburn (Fig. 2). There were no significant differences between the three groups. However, it appears that high-FFA patients had a great variability in serum glucose levels compared with normal and high-TG patients. Normal patients and patients with high TG required significantly more insulin between d 8 and 23 when compared with patients with normal and high FFA (P < 0.05) (Fig. 2).
Fig. 2.
Glucose metabolism shown by units of insulin administered and systemic daily average glucose levels. Normal patients received significantly (P < 0.05) more insulin up to d 23 postburn compared with FFA at similar average glucose levels.
Acute-phase and constitutive proteins
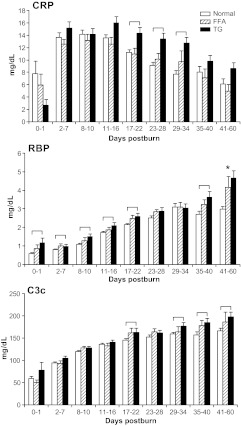
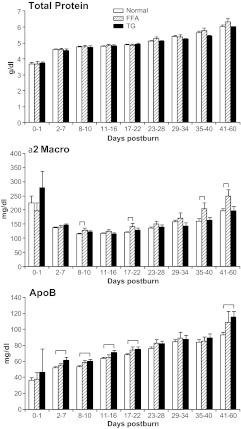
Hepatic acute-phase proteins are depicted in Fig. 3. C-reactive protein (CRP), retinol-binding protein (RBP), and C3 complement (C3c) levels were significantly increased in the TG group when compared with the normal group (P < 0.05) (Fig. 3). Constitutive protein α2-macroglobulin, a marker for lipolysis, was significantly (P < 0.05) elevated in the FFA group compared with normal at various time points (Fig. 4). Apolipoprotein B was significantly higher in the TG and FFA group at various time points when compared with normal (P < 0.05) (Fig. 4).
Fig. 3.
Acute-phase proteins. CRP and C3c were significantly elevated in the TG group during the second phase postburn beginning d 17 compared with normal patients. RBP showed a significantly higher onset immediately after burn injury compared with normal. Brackets annotate significances (P < 0.05) between the groups.
Fig. 4.
Total protein and constitutive proteins α2-macroglobulin (Macro) and apolipoprotein B (ApoB). Serum levels of total protein increased over time in all groups at a similar rate. α2-Macroglobulin showed significantly (P < 0.05) higher levels in the FFA group throughout the whole study period compared with normal, whereas apolipoprotein B was elevated in the TG group. Brackets annotate significances (P < 0.05) between the groups.
Renal function
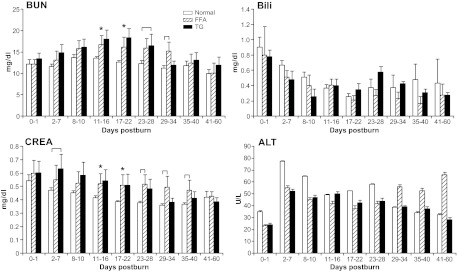
Blood urea nitrogen, which represents renal function, was significantly (P < 0.05) elevated at various time in both the TG and FFA groups compared with the normal group (P < 0.05) (Fig. 5). Serum creatinine levels followed this pattern and remained significantly (P < 0.05) elevated in the FFA and TG groups compared with normal for up to d 40 postburn (Fig. 5).
Fig. 5.
Markers for renal and hepatic function. Blood urea nitrogen (BUN) and creatinine (CREA) displayed an impaired kidney function in the FFA and TG group between d 11 and 40. Liver function displayed by ALT and bilirubin (Bili) did not differ significantly between groups. Brackets annotate significances (P < 0.05) between the groups and asterisks among the normal vs. FFA and TG groups.
Hepatic function
The markers for hepatic functions alanine aminotransferase (ALT) and bilirubin were elevated in all groups during the whole study period (Fig. 5). We found a large variability within groups, and hence no significant differences were detected.
Liver volume
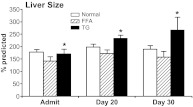
Liver volume was significantly different between groups from admission. Liver size was significantly increased in the TG group compared with normal patients and FFA patients (P < 0.05) (Fig. 6). TG patients furthermore demonstrated a significant increase in liver size over time, whereas normal and FFA burn patients did not express an increase and plateaued (P = 0.036).
Fig. 6.
Liver size at admission and followed in 10-d intervals for the first 30 d expressed as percent predicted. Only the TG group showed a consistent significant rise over all time points up to d 30. Liver volume plateaued in the normal and FFA group. Asterisks indicate significance in the TG group.
Discussion
Hypermetabolism and catabolic responses postburn have been the focus of multiple clinical and animal investigations, especially those studying postinjury physiology (1, 2). Extensive research regarding injury mechanisms, infections, glucose metabolism, hormonal influence, and drug administration revealed that these different patient populations have different patterns of lipolysis (FFA) and TG synthesis (1, 2, 5, 7, 10). Some studies reported that the FFA and TG levels were elevated in patients after injury (15). Others have indicated that they were decreased depending on different treatments (9, 14, 27–30). However, to date, no standard pattern could be defined and associated with adverse events and patient outcomes. In the present study, we stratified patients according to their plasma FFA and TG levels. Interestingly, the incidence of elevated FFAs and TGs above normal values in the whole patient population was much lower than expected. Clinical outcomes data in this analysis revealed that serum TG appears as a central adipose parameter for an increased postburn morbidity and mortality.
TG levels in both the TG and FFA group increased steadily over the duration of the study. TG synthesis originates from the liver, and it is hard to explain whether increased TG levels are because of increased synthesis, decreased uptake, or impaired clearance. Interestingly, increased TG levels were associated with the greatest hepatomegaly postburn. This finding is in agreement with the results of other studies where an association between circulating TG and fatty infiltration of the liver has been made (2, 5, 8, 10, 12, 26). The recycled fat from the periphery does not contribute to the required caloric utilization but rather being deposited in the liver. Hepatic TG deposition is not being used and contributes to the increased incidence of hepatomegaly and morbidity (5, 10, 31, 32). Reassembly of lipids can also be shown by higher apolipoprotein B levels in the TG group. Apolipoprotein B is a major carrier for liver-synthesized cholesterol to peripheral tissues (33). To date, mechanisms of this transporter molecule are not completely understood, but it seems to play an important role in the chronic disease development in lipid disorders. Inflammatory markers such as the acute-phase proteins CRP and C3c showed higher expression after the acute treatment phase beginning on d 17. This finding also corresponds with the protracted elevation of TG in the TG group, indicating that prolonged inflammation is related to increased TGs. Besides the clinically established parameter CRP, the complement-activating factor C3c is used for the diagnosis of acute infections and chronic inflammatory disorders such as rheumatoid arthritis and glomerulonephritis. RBP was elevated in this patient group throughout the whole observation period. This marker is currently under investigation for being involved in the development of insulin resistance, acute, and inflammatory processes (34). RBP, the only known carrier for vitamin A, is mainly expressed through adipose tissue and the liver. Because a relationship between RBP and lipids has been shown, this molecule is considered as an adipokine. In the context of our results, the immediate elevation of RBP in the TG group might also indicate a different metabolism in this patient population.
The FFA results are difficult to interpret in the current study. FFAs did not show a uniform signal over time, which indicates that lipolysis is triggered by adverse events throughout the hospital course rather than being an increasing long-term consequence due to developing impaired organ function. FFAs did not significantly impair hepatic function, nor did it cause significant hepatomegaly. FFAs were associated with increased α2-macroglobulin levels. α2-Macroglobulin receptors in adipocytes have been shown to contribute to intracellular lipid breakdown, and therefore, FFAs may not be as central because they are broken down more rapidly than TGs (35). Other analyzed metabolic markers did not show major differences compared with the normal and TG groups, and we hence conclude that FFAs are a sensitive marker for lipid breakdown in the peripheral tissue and that differences downstream in the lipid metabolism as described above are responsible for the pathophysiological changes.
The effect of insulin therapy in traumatized and critically ill patients has been investigated over the last decade (3, 4, 36). In particular, it has been shown that burn patients benefit from the administration of insulin. Interestingly, patients in the FFA group, representing those with greater peripheral lipid breakdown, received significantly less insulin when compared with TG and normal postburn patients. It is difficult to determine why there is a difference in the high-TG and normal patients, but an explanation could be that FFAs are not associated with a profound hyperinsulinemic hyperglycemic response, but TGs are. This would support our findings that TGs are associated with worse organ function. Furthermore, in the TG patient population, liver size increased significantly, whereas hepatic organ function markers such as bilirubin, aspartate aminotransferase (AST), and ALT were not significantly different among the groups. However, our results indicate that derangements in lipid metabolism are associated with renal function. Both FFA and TG groups showed a significantly worsened renal function as shown by elevated blood urea nitrogen levels and creatinine. This might be an effect secondary to the incidence of infectious complications or to a greater catabolic response (1, 2). The breakdown of muscle mass might contribute to a higher load of creatinine and nitrogen. It also can be assumed that due to the recycling to TGs, wasted caloric equivalents in the TG group might contribute to these outcomes, because the kidneys require large amounts of energy to maintain normal organ function.
In summary, we found in this study that elevated TGs contribute to worsen postburn morbidity and mortality, whereas elevated FFAs gave inconclusive results. The ideal approach to test the importance of FFAs and TGs would be to conduct a prospective randomized trial with agents that reduce these fat metabolic markers and determine whether alleviated TGs and FFAs lead to an improved metabolic and clinical outcome postburn.
Acknowledgments
We thank all the individuals who participated in this clinical trial. We also thank the research staff for their assistance.
This work was supported by grants from the National Institute for Disabilities and Rehabilitation Research (H133A070026 and H133A70019), the National Institutes of Health (NIH) (R01-GM087285, P50-GM60338, R01-HD049471, R01-GM56687-11S1, and T32-GM8256), and Shriners Hospitals for Children (84080, 8660, 9145, and 8760) and, in addition, by the Canadian Institutes of Health Research Grant 123336, Canada foundation for Innovation Leader's Opportunity Fund Project 25407, and Physicians' Services Inc. Foundation Health Research Grant Program. C.C.F. is an Institute for Translational Sciences Career Development Scholar supported, in part, by NIH KL2RR029875 and NIH UL1RR029876.
This study is registered at www.clinicaltrials.gov as NCT00675714.
Disclosure Summary: The authors have nothing to disclose.
Footnotes
- ALT
- Alanine aminotransferase
- BMI
- body mass index
- C3c
- C3 complement
- CRP
- C-reactive protein
- FFA
- free fatty acid
- RBP
- retinol-binding protein
- TBSA
- total body surface area
- TG
- triglyceride.
References
- 1. Herndon DN, Tompkins RG. 2004. Support of the metabolic response to burn injury. Lancet 363:1895–1902 [DOI] [PubMed] [Google Scholar]
- 2. Jeschke MG, Chinkes DL, Finnerty CC, Kulp G, Suman OE, Norbury WB, Branski LK, Gauglitz GG, Mlcak RP, Herndon DN. 2008. Pathophysiologic response to severe burn injury. Ann Surg 248:387–401 [DOI] [PMC free article] [PubMed] [Google Scholar]
- 3. Hemmila MR, Taddonio MA, Arbabi S, Maggio PM, Wahl WL. 2008. Intensive insulin therapy is associated with reduced infectious complications in burn patients. Surgery 144:629–635; discussion 635–637 [DOI] [PMC free article] [PubMed] [Google Scholar]
- 4. Jeschke MG, Kulp GA, Kraft R, Finnerty CC, Mlcak R, Lee JO, Herndon DN. 2010. Intensive insulin therapy in severely burned pediatric patients: a prospective randomized trial. Am J Respir Crit Care Med 182:351–359 [DOI] [PMC free article] [PubMed] [Google Scholar]
- 5. Cree MG, Aarsland A, Herndon DN, Wolfe RR. 2007. Role of fat metabolism in burn trauma-induced skeletal muscle insulin resistance. Crit Care Med 35:S476–S483 [DOI] [PubMed] [Google Scholar]
- 6. Cree MG, Fram RY, Herndon DN, Qian T, Angel C, Green JM, Mlcak R, Aarsland A, Wolfe RR. 2008. Human mitochondrial oxidative capacity is acutely impaired after burn trauma. Am J Surg 196:234–239 [DOI] [PMC free article] [PubMed] [Google Scholar]
- 7. Cree MG, Wolfe RR. 2008. Postburn trauma insulin resistance and fat metabolism. Am J Physiol Endocrinol Metab 294:E1–E9 [DOI] [PubMed] [Google Scholar]
- 8. Barrow RE, Mlcak R, Barrow LN, Hawkins HK. 2004. Increased liver weights in severely burned children: comparison of ultrasound and autopsy measurements. Burns 30:565–568 [DOI] [PubMed] [Google Scholar]
- 9. Barrow RE, Wolfe RR, Dasu MR, Barrow LN, Herndon DN. 2006. The use of beta-adrenergic blockade in preventing trauma-induced hepatomegaly. Ann Surg 243:115–120 [DOI] [PMC free article] [PubMed] [Google Scholar]
- 10. Cree MG, Newcomer BR, Katsanos CS, Sheffield-Moore M, Chinkes D, Aarsland A, Urban R, Wolfe RR. 2004. Intramuscular and liver triglycerides are increased in the elderly. J Clin Endocrinol Metab 89:3864–3871 [DOI] [PubMed] [Google Scholar]
- 11. Jeschke MG. 2009. The hepatic response to thermal injury: is the liver important for postburn outcomes? Mol Med 15:337–351 [DOI] [PMC free article] [PubMed] [Google Scholar]
- 12. Jeschke MG, Micak RP, Finnerty CC, Herndon DN. 2007. Changes in liver function and size after a severe thermal injury. Shock 28:172–177 [DOI] [PubMed] [Google Scholar]
- 13. Cree MG, Newcomer BR, Herndon DN, Qian T, Sun D, Morio B, Zwetsloot JJ, Dohm GL, Fram RY, Mlcak RP, Aarsland A, Wolfe RR. 2007. PPAR-alpha agonism improves whole body and muscle mitochondrial fat oxidation, but does not alter intracellular fat concentrations in burn trauma children in a randomized controlled trial. Nutr Metab (Lond) 4:9. [DOI] [PMC free article] [PubMed] [Google Scholar]
- 14. Barret JP, Jeschke MG, Herndon DN. 2001. Fatty infiltration of the liver in severely burned pediatric patients: autopsy findings and clinical implications. J Trauma 51:736–739 [DOI] [PubMed] [Google Scholar]
- 15. Kamolz LP, Andel H, Mittlböck M, Winter W, Haslik W, Meissl G, Frey M. 2003. Serum cholesterol and triglycerides: potential role in mortality prediction. Burns 29:810–815 [DOI] [PubMed] [Google Scholar]
- 16. Randle PJ, Garland PB, Hales CN, Newsholme EA. 1963. The glucose fatty-acid cycle: its role in insulin sensitivity and the metabolic disturbances of diabetes mellitus. Lancet 1:785–789 [DOI] [PubMed] [Google Scholar]
- 17. Boden G, Chen X, Ruiz J, Heifets M, Morris M, Badosa F. 1994. Insulin receptor down-regulation and impaired antilipolytic action of insulin in diabetic patients after pancreas/kidney transplantation. J Clin Endocrinol Metab 78:657–663 [DOI] [PubMed] [Google Scholar]
- 18. Shah P, Vella A, Basu A, Basu R, Adkins A, Schwenk WF, Johnson CM, Nair KS, Jensen MD, Rizza RA. 2002. Effects of free fatty acids and glycerol on splanchnic glucose metabolism and insulin extraction in nondiabetic humans. Diabetes 51:301–310 [DOI] [PubMed] [Google Scholar]
- 19. Dresner A, Laurent D, Marcucci M, Griffin ME, Dufour S, Cline GW, Slezak LA, Andersen DK, Hundal RS, Rothman DL, Petersen KF, Shulman GI. 1999. Effects of free fatty acids on glucose transport and IRS-1-associated phosphatidylinositol 3-kinase activity. J Clin Invest 103:253–259 [DOI] [PMC free article] [PubMed] [Google Scholar]
- 20. Pankow JS, Duncan BB, Schmidt MI, Ballantyne CM, Couper DJ, Hoogeveen RC, Golden SH. 2004. Fasting plasma free fatty acids and risk of type 2 diabetes: the atherosclerosis risk in communities study. Diabetes Care 27:77–82 [DOI] [PubMed] [Google Scholar]
- 21. Petersen KF, Befroy D, Dufour S, Dziura J, Ariyan C, Rothman DL, DiPietro L, Cline GW, Shulman GI. 2003. Mitochondrial dysfunction in the elderly: possible role in insulin resistance. Science 300:1140–1142 [DOI] [PMC free article] [PubMed] [Google Scholar]
- 22. Barrow RE, Jeschke MG, Herndon DN. 2000. Early fluid resuscitation improves outcomes in severely burned children. Resuscitation 45:91–96 [DOI] [PubMed] [Google Scholar]
- 23. Klein MB, Silver G, Gamelli RL, Gibran NS, Herndon DN, Hunt JL, Tompkins RG. 2006. Inflammation and the host response to injury: an overview of the multicenter study of the genomic and proteomic response to burn injury. J Burn Care Res 27:448–451 [DOI] [PubMed] [Google Scholar]
- 24. Zhou B, Xu W, Herndon D, Tompkins R, Davis R, Xiao W, Wong WH, Toner M, Warren HS, Schoenfeld DA, Rahme L, McDonald-Smith GP, Hayden D, Mason P, Fagan S, Yu YM, Cobb JP, Remick DG, Mannick JA, Lederer JA, Gamelli RL, Silver GM, West MA, Shapiro MB, Smith R, et al. 2010. Analysis of factorial time-course microarrays with application to a clinical study of burn injury. Proc Natl Acad Sci USA 107:9923–9928 [DOI] [PMC free article] [PubMed] [Google Scholar]
- 25. Greenhalgh DG, Saffle JR, Holmes JH, 4th, Gamelli RL, Palmieri TL, Horton JW, Tompkins RG, Traber DL, Mozingo DW, Deitch EA, Goodwin CW, Herndon DN, Gallagher JJ, Sanford AP, Jeng JC, Ahrenholz DH, Neely AN, O'Mara MS, Wolf SE, Purdue GF, Garner WL, Yowler CJ, Latenser BA. 2007. American Burn Association consensus conference to define sepsis and infection in burns. J Burn Care Res 28:776–790 [DOI] [PubMed] [Google Scholar]
- 26. Barrow RE, Hawkins HK, Aarsland A, Cox R, Rosenblatt J, Barrow LN, Jeschke MG, Herndon DN. 2005. Identification of factors contributing to hepatomegaly in severely burned children. Shock 24:523–528 [DOI] [PubMed] [Google Scholar]
- 27. Aarsland A, Chinkes DL, Sakurai Y, Nguyen TT, Herndon DN, Wolfe RR. 1998. Insulin therapy in burn patients does not contribute to hepatic triglyceride production. J Clin Invest 101:2233–2239 [DOI] [PMC free article] [PubMed] [Google Scholar]
- 28. Morio B, Irtun O, Herndon DN, Wolfe RR. 2002. Propranolol decreases splanchnic triacylglycerol storage in burn patients receiving a high-carbohydrate diet. Ann Surg 236:218–225 [DOI] [PMC free article] [PubMed] [Google Scholar]
- 29. Herndon DN, Barrow RE, Rutan TC, Minifee P, Jahoor F, Wolfe RR. 1988. Effect of propranolol administration on hemodynamic and metabolic responses of burned pediatric patients. Ann Surg 208:484–492 [DOI] [PMC free article] [PubMed] [Google Scholar]
- 30. Wolfe RR, Klein S, Herndon DN, Jahoor F. 1990. Substrate cycling in thermogenesis and amplification of net substrate flux in human volunteers and burned patients. J Trauma 30:S6–S9 [DOI] [PubMed] [Google Scholar]
- 31. Wolfe RR, Herndon DN, Jahoor F, Miyoshi H, Wolfe M. 1987. Effect of severe burn injury on substrate cycling by glucose and fatty acids. N Engl J Med 317:403–408 [DOI] [PubMed] [Google Scholar]
- 32. Wolfe RR, Herndon DN, Peters EJ, Jahoor F, Desai MH, Holland OB. 1987. Regulation of lipolysis in severely burned children. Ann Surg 206:214–221 [DOI] [PMC free article] [PubMed] [Google Scholar]
- 33. Fernández-Miranda C, Pérez-Carreras M, Colina F, López-Alonso G, Vargas C, Solís-Herruzo JA. 2008. A pilot trial of fenofibrate for the treatment of non-alcoholic fatty liver disease. Dig Liver Dis 40:200–205 [DOI] [PubMed] [Google Scholar]
- 34. Kraft R, Herndon DN, Kulp GA, Mecott GA, Trentzsch H, Jeschke MG. 2011. Retinol binding protein: marker for insulin resistance and inflammation postburn? JPEN J Parenter Enteral Nutr 35:695–703 [DOI] [PMC free article] [PubMed] [Google Scholar]
- 35. Ahmad J, Singh M, Saleemuddin M. 2001. A study of plasma alpha-2-macroglobulin levels in type 2 diabetic subjects with microalbuminuria. J Assoc Physicians India 49:1062–1065 [PubMed] [Google Scholar]
- 36. Jeschke MG, Kraft R, Emdad F, Kulp GA, Williams FN, Herndon DN. 2010. Glucose control in severely thermally injured pediatric patients: what glucose range should be the target? Ann Surg 252:521–528 [DOI] [PMC free article] [PubMed] [Google Scholar]


