

Abstract
The trichothecene deoxynivalenol (DON), a common contaminant of cereal-based foods, is a ribotoxic mycotoxin known to activate innate immune cells in vivo and in vitro. Although it is recognized that DON induces transcription and mRNA stabilization of inflammation-associated mRNAs in mononuclear phagocytes, it is not known if this toxin affects translation of selected mRNA species in the cellular pool. To address this question, we employed a focused inflammation/autoimmunity PCR array to compare DON-induced changes in profiles of polysome-associated mRNA transcripts (translatome) to total cellular mRNA transcripts (transcriptome) in the RAW 264.7 murine macrophage model. Exposure to DON at 250ng/ml (0.84 µM) for 6h induced robust expression changes in inflammatory response genes including cytokines, cytokine receptors, chemokines, chemokine receptors, and transcription factors, with 73% of the changes being highly comparable within transcriptome and translatome populations. When expression changes of selected representative inflammatory response genes in the polysome and cellular mRNA pools were quantified in a follow-up study by real-time PCR, closely coordinated regulation of the translatome and transcriptome was confirmed; however, modest but significant differences in the relative expression of some genes within the two pools were also detectable. Taken together, DON’s capacity to alter translation expression of inflammation-associated genes appears to be driven predominantly by selective transcription and mRNA stabilization that have been reported previously; however, a small subset of these genes appear to be further regulated at the translational level.
Key Words: macrophage, inflammation, deoxynivalenol, trichothecene mycotoxin, translatome.
The trichothecene deoxynivalenol (DON), a ribotoxic mycotoxin produced by toxigenic Fusarium sp. that commonly contaminates cereal-based foods, has the potential to adversely affect humans and animals and therefore represents an important public health concern (Pestka, 2010). Primary targets of this mycotoxin are monocytes and macrophages of the innate immune system. Both in vitro and in vivo studies have demonstrated that DON rapidly activates mitogen-activated protein kinases which drive upregulated expression of mRNAs and proteins for inflammation-related genes such as the cytokines, chemokines, and cyclooxygenase-2 (Chung et al., 2003; Islam et al., 2006; Moon and Pestka, 2002; Shifrin and Anderson, 1999; Zhou et al., 2003a). DON-induced increases in cellular pools of inflammation-associated mRNAs have been linked to both transcriptional activation and stabilization of mRNA through AUUUA motif in the 3′-untranslated region (UTR; Choi et al., 2009; Chung et al., 2003; Moon and Pestka, 2002) indicating that these two mechanisms contribute to upregulated gene expression.
It is critical to note that the overall rate of translation in a cell depends not wholly on available mRNA but also on the capacity for and efficiency of translation (Proud, 2007; Sonenberg and Hinnebusch, 2009). Capacity relates to the availability and abundance of ribosomal subunits and other translational components, whereas efficiency is regulated by the rate of translational initiation and peptide chain elongation. Individual mRNAs are subject to additional levels of translational regulation, and elements in their 5′- and 3′-UTRs may interact with regulatory RNAs (e.g., antisense sequences and microRNAs) or RNA-binding proteins (RBPs) to modulate ribosomal association. As yet, it is not known whether ribotoxins such as DON might also selectively modulate translation through these mechanisms. In addition, DON’s capability of inhibiting translation at high concentrations (Zhou et al., 2003b) makes this question more complicated and interesting.
One strategy for monitoring changes in protein expression in stressed cells is proteomic analysis, but such an approach is time-consuming, expensive, and relatively insensitive compared with transcriptomic approaches employing highly sensitive PCR (Cheeseman et al., 2011; Kuny et al., 2012). Additionally, measures of protein levels are affected by protein degradation and hence do not fully reflect translation. An alternative approach for identifying and quantitating genes being translated in cells under a specific set of conditions is to first isolate their polysomes and then profile the associated mRNAs. This “translatome” strategy has successfully been used in fungal, plant, and animal cells (Halbeisen and Gerber, 2009; Markou et al., 2010; Mustroph and Bailey-Serres, 2010; Preiss et al., 2003; Shenton et al., 2006). For example, yeasts exposed to different stresses, such as amino acid depletion and fusel alcohol addition, show distinct translational profiles (Smirnova et al., 2005), suggesting there is a role of translational regulation in rapidly responding environmental stress. Further studies employing additional high-throughput array analysis have revealed that translatome does not correlate with the transcriptome under mild stresses but does so under severe stresses such as amino acid deprivation (Halbeisen and Gerber, 2009), suggesting that coordination of translatome and transcriptome is stress dependent. Uncoupling of transcriptome and translatome has also been documented in human cells in response to various stimuli and stresses (Grolleau et al., 2002; Mikulits et al., 2000; Tebaldi et al., 2012).
The purpose of this study was to test the hypothesis that DON selectively modulates translation of inflammation-associated genes in the RAW 264.7 murine macrophage cell model. Specifically, we employed a focused inflammation/autoimmune PCR array to compare the DON-induced inflammation-associated translatome and transcriptome. The results revealed that DON’s capacity to modulate translation of most inflammation-associated genes is predominantly driven by transcription and mRNA stabilization; however, a small subset of these genes appeared to be regulated, in part, by selective translation.
MATERIALS AND METHODS
Chemicals.
DON, acid-phenol (pH 4.3), trichloromethane, isoamyl alcohol, lithium chloride, sucrose, heparin, cycloheximide, and Triton X-100 were purchased from Sigma-Aldrich (St Louis, MO). TRIzol was obtained from Invitrogen (Carlsbad, CA). RNase-free water was supplied by Ambion (Austin, TX).
Cell culture.
RAW 264.7 (ATCC, Rockville, MD), a mouse macrophage cell line, was cultured in Dulbecco’s modified Eagle’s medium supplemented with 10% (vol/vol) heat-inactivated fetal bovine serum (Atlanta Biologicals, Lawrenceville, GA), streptomycin (100 µg/ml) and penicillin (100U/ml) at 37°C in a humidified atmosphere with 5% CO2. Macrophage cell number and viability were assessed by trypan blue dye exclusion using a hematocytometer. Prior to exposure of DON, cells (2.5 × 10⁶ per plate) were seeded and cultured in 100-mm tissue culture plates for 24h to achieve ~80% confluency. Cells were treated with vehicle or 250ng/ml (0.84µM) DON for 6h and subjected to polysomal and total RNA isolation. This concentration partially inhibits translation in RAW 264.7 but is optimal for inducing inflammatory gene expression (Moon and Pestka, 2002; Yang and Pestka, 2002).
Sucrose density gradient fractionation.
For polysome isolation, cells were washed twice with ice-cold PBS and lysed in 500 µl ice-cold polysome extraction buffer (50mM KCl, 10mM MgCl2, 15mM Tris-HCl [pH 7.4], 1% (vol/vol) Triton X-100, 0.1mg/ml cycloheximide, and 0.5mg/ml heparin) (Bae et al., 2009). Sucrose solutions (10 and 50%, wt/vol) were prepared in RNase-free water containing 50 mM KCl, 15 mM Tris-HCl (pH 7.4), 10 mM MgCl2, 0.1mg/ml cycloheximide, and protease inhibitor. Cell lysates were centrifuged at 16,000 × g, 4°C, for 15min to remove nuclei, mitochondria, and cell debris. The resultant clear supernatant (1.8ml) was layered on a 9-ml linear sucrose gradient solution (10–50%) prepared using an ISCO 160 Gradient Former and held at 4°C in an 11.5-ml Sorvall centrifuge tube and centrifuged at 200,000 × g, 4°C for 3h in Sorvall TH-641 rotor. Polysomal fractions were isolated by fractionating gradient at a rate of 0.5ml/min into 2-ml tube by upward displacement using an ISCO Density Gradient Fraction Collector, consisting of a needle-piercing device with a syringe pump connected to an EM-1 UV monitor for continuous measurement of the absorbance at 254nm (Teledyne ISCO, Lincoln, NE).
Total and polysomal RNA purification.
A modification of previously described procedure (Zong et al., 1999) was used for comparing the transcriptome and translatome. For transcriptome analysis, total RNAs were extracted by TRIzol (Invitrogen) following manufacturer’s protocol. For translatome analysis, polysomal fractions (500 µl) were diluted with RNase-free water to a volume of 1000 µl and subsequently combined with equal volume of phenol:chloroform:isoamyl alcohol (25:24:1). Tubes were mixed, held at 25°C for 5min, and centrifuged at 16,000 × g, 4°C for 15min. Supernatants were pooled and transferred to a 50-ml conical centrifuge tube, and RNA was precipitated with LiCl at final concentration of 2M at −20°C overnight. After centrifugation at 12,000 × g, 4°C for 15min, pellets were washed three times with 70% ethanol, air-dried, and resuspended in RNase-free water. RNA concentrations were also measured with a NanoDrop reader (Thermo Fisher, Wilmington, DE) and integrity verified using Agilent 2100 Bioanalyzer Nanochip capillary electrophoresis unit. RNA integrity number values were ≥9.9 for all samples, suggesting the RNA was of high purity with minimal degradation and suitable for cDNA synthesis. Both total and polysomal RNAs were stored at −80°C.
PCR array and data analysis.
RNA (2 µg) samples were reverse transcribed using a high capacity RNA-to-cDNA kit (Applied Biosystems, Foster City, CA) and the newly synthesized cDNA purified using a Qiagen PCR purification kit (Valencia, CA). Resultant cDNAs (8ng per well) were applied to 384-well mouse Inflammatory Response and Autoimmunity (PAMM-077A) PCR array plates from SABiosciences (Valencia, CA) according to manufacturer’s instructions. Plates were analyzed in duplicate in an Applied Biosystems 7900 Real-Time PCR System. Mean Ct values of five housekeeping genes on the PCR array plate (β-glucuronidase, hypoxanthine guanine phosphoribosyl transferase, heat shock protein 90 α, glyceraldehyde-3-phosphate dehydrogenase [GAPDH], β-actin) were 17.4 (control-total cDNA), 17.6 (DON-total cDNA), 17.8 (control-polysomal cDNA), and 17.9 (DON-polysomal cDNA) verifying the quantity of mRNA recovered as well as the efficacy of PCR array protocol for all four experimental groups. Data were interpreted using SABiosciences’ web-based PCR array data analysis tool.
Real-time PCR.
Total and polysomal RNAs were purified from three replicate cultures each of control and DON-treated cells and reverse transcribed into cDNA as described above. Quantitative PCR using duplicate technical replicates of each cDNA was performed on a 7500 Fast Real-Time PCR System (Applied Biosystems) using TaqMan gene expression assay probes (Applied Biosystems) of mouse target genes, IL-1β (Mm01336189_m1), IL-6 (Mm00446190_m1), IL-10 (Mm00439614_m1), IL-18 (Mm00434225_m1), TNF-α (Mm00443258_m1), CCL2 (Mm00441242_m1), CCL4 (Mm00443111_m1), CCL5 (Mm01302427_m1), CCL7 (Mm00443113_m1), CCR1 (Mm00438260_s1), CCR2 (Mm01216173_m1), CXCL2 (Mm00436450_m1), BCL6 (Mm00477633_m1), Fos (Mm00487425_m1), CXCR1 (Mm00731329_s1), TLR5 (Mm00546288_s1), ITGB2 (Mm00434513_m1) or an endogenous control GAPDH (Mm99999915_g1) and TaqMan Universal PCR Master Mix (Applied Biosystems). The expression levels of individual gene were normalized with GAPDH in the same sample by calculation of delta-cycle threshold (∆Ct) value. Relative expression levels of respective genes in DON-treated samples were compared with corresponding control and calculated by relative quantification (∆∆Ct) (Takeda et al., 2008). Data were represented as the mean ± SE of the three replicate cultures.
Statistical analysis.
Data were analyzed using Sigma Plot 11 (Jandel Scientific, San Rafael, CA). Data sets were considered significantly different when p < 0.05.
RESULTS
Although it has been recognized that DON induces transcription and enhances stability of inflammation-associated mRNAs in the macrophage, the toxin’s effects on translation of these mRNAs are not yet understood. The translational and transcriptional profiles of inflammation-related mRNAs were therefore compared in RAW 264.7 macrophage treated with 250ng/ml of the toxin for 6h using a focused PCR array containing 84 inflammation related genes. The percentages of upregulated, downregulated, and unaffected genes were markedly similar in the transcriptome (45, 7, and 48%, respectively) (Fig. 1A) and the translatome (48, 10, and 42%, respectively) (Fig. 1B). Overall, the transcriptome and translatome shared 33 upregulated genes (89 and 83%, respectively) (Fig. 2A) and 5 downregulated genes (80 and 56%, respectively) (Fig. 2B). Scatter plots (DON vs. control) of transcriptome and translatome also revealed highly analogous gene distribution patterns with similar clustering of upregulated and downregulated genes (Figs. 3A and 3B).
FIG. 1.

Relative numbers of array genes by DON in the transcriptome and translatome. Based on the PCR array result, the percentage of DON-induced up-, down-, and unregulated genes were calculated and shown in (A) transcriptome and (B) translatome, respectively.
FIG. 2.

Comparison of DON overlapping genes in transcriptome and translatome. Numbers of genes (A) upregulated and (B) downregulated by DON in transcriptome and translatome, respectively. Overlapping regions represent the common genes that were shared by transcriptome and translatome.
FIG. 3.

Scatter distribution of up- and downregulated genes in transcriptome and translatome. (A) Transcriptome and (B) translatome data (DON vs. Control) were plotted using SAbiosciences web-based RT2 Profiler PCR Array Data Analysis tool and exported. Each dot represents a single gene. The parallel line region indicates twofold threshold and the black arrows demonstrate the up- or downregulation of genes. Examples of commonly upregulated (CCL3, CCL4, CXCL2, CCR1, CCR2, CCR3, and CCL7) and downregulated genes (LTB, IL-7, IL-18, CXCL10, and CD40) are identified.
Genes up- and downregulated by DON at the transcriptome and translatome level could be broadly categorized as chemokines, chemokine receptors, cytokines, cytokine receptors, or inflammatory response genes (Table 1). Quantitative changes in gene expression are summarized in Table 2 (upregulation) and Table 3 (downregulation). Notably, mRNAs, all CCL family chemokines and receptors within the array were upregulated. The average fold up- and downregulation levels per gene were 5.6 and 0.26 in transcriptome, respectively, and 5.9 and 0.25 in translatome, respectively. The relative ratios of translatome/transcriptome for 73% of the modulated genes were between 0.5 and 2.0 (Tables 2 and 3) suggesting there was close coordination of transcriptome and translatome mRNA populations.
TABLE 1.
Functional Gene Grouping of DON-Induced Up- and Downregulated Genes in Transcriptome and Translatome
| Functional gene grouping | Translatome and transcriptome | Translatome- specific | Transcriptome-specific |
|---|---|---|---|
| Chemokines | ↑Ccl1, Ccl11, Ccl12, Ccl17, Ccl2, Ccl22, Ccl24, Ccl3, Ccl4, Ccl5, Ccl7, Cxcl2, Cxcl3 ↓Cxcl10 |
↑Cxcl1↓Ccl25, Cxcl11 | ↑Cxcl9 |
| Chemokine receptors | ↑Ccr1, Ccr2, Ccr3, Ccr7, Cxcr2 | ↑Cxcr1 | |
| Cytokines | ↑Il1b, Il10, Il1f10, Tnf, Fasl, Il23a, Il6 ↓Il18, Il7, Ltb |
↑Ifng | ↑Tnfsf14, Lta |
| Cytokine receptors | ↑Il1r1, Il1rn | ↑Il22ra2,↓Il18rap | ↑Il10rb |
| Inflammatory response | ↑Bcl6, Fos, C3ar1, C4b, Crp, Ripk2 ↓Cd40 |
↑C3, Itgb2, Tlr5↓Tlr3 | ↓Tlr2 |
TABLE 2.
DON-Induced Upregulation of Inflammatory Response Genes in Translatome (TLM) and Transcriptome (TCM)
| Fold change* | Gene Bank | Gene description | |||
|---|---|---|---|---|---|
| Symbol | TLM/TCM | TLM | TCM | ||
| Cxcl1 | 11.6 | 6.1 | 0.5 | NM_008176 | Chemokine (C-X-C motif) ligand 1 |
| Ifng | 8.5 | 11.5 | 1.4 | NM_008337 | Interferon gamma |
| Tlr5 | 7.2 | 6.5 | 0.9 | NM_016928 | Toll-like receptor 5 |
| Il1b | 5.4 | 27.4 | 5.1 | NM_008361 | Interleukin 1 beta |
| Cxcr1 | 3.2 | 3.2 | 1 | NM_178241 | Chemokine (C-X-C motif) receptor 1 |
| Il22ra2 | 2.1 | 3.9 | 1.9 | NM_178258 | Interleukin 22 receptor, alpha 2 |
| Ccl7 | 2.0 | 12.2 | 6.2 | NM_013654 | Chemokine (C-C motif) ligand 7 |
| Ccl12 | 1.9 | 5.4 | 2.9 | NM_011331 | Chemokine (C-C motif) ligand 12 |
| Il10 | 1.9 | 3.9 | 2.1 | NM_010548 | Interleukin 10 |
| Ccr1 | 1.8 | 32.9 | 18.2 | NM_009912 | Chemokine (C-C motif) receptor 1 |
| Cxcl2 | 1.6 | 15.5 | 9.9 | NM_009140 | Chemokine (C-X-C motif) ligand 2 |
| Itgb2 | 1.5 | 2.4 | 1.6 | NM_008404 | Integrin beta 2 |
| Bcl6 | 1.5 | 3.8 | 2.6 | NM_009744 | B-cell leukemia/lymphoma 6 |
| Ccl24 | 1.5 | 9.2 | 6.3 | NM_019577 | Chemokine (C-C motif) ligand 24 |
| C3 | 1.4 | 2.6 | 1.8 | NM_009778 | Complement component 3 |
| Ccr3 | 1.4 | 6.2 | 4.5 | NM_009914 | Chemokine (C-C motif) receptor 3 |
| Il6 | 1.3 | 3.9 | 3.1 | NM_031168 | Interleukin 6 |
| Fasl | 1.2 | 3.3 | 2.7 | NM_010177 | Fas ligand (TNF superfamily, member 6) |
| Cxcr2 | 1.1 | 14.8 | 13.6 | NM_009909 | Chemokine (C-X-C motif) receptor 2 |
| Ripk2 | 1.1 | 2.6 | 2.4 | NM_138952 | Receptor (TNFRSF)-interacting serine-threonine kinase 2 |
| Ccl17 | 1.0 | 3 | 2.9 | NM_011332 | Chemokine (C-C motif) ligand 17 |
| Ccl11 | 1.0 | 4.4 | 4.4 | NM_011330 | Chemokine (C-C motif) ligand 11 |
| Ccr2 | 1.0 | 6.2 | 6.4 | NM_009915 | Chemokine (C-C motif) receptor 2 |
| Fos | 0.9 | 2 | 2.2 | NM_010234 | FBJ osteosarcoma oncogene |
| C3ar1 | 0.9 | 6.7 | 7.5 | NM_009779 | Complement component 3a receptor 1 |
| Il1f10 | 0.9 | 2.4 | 2.8 | NM_153077 | Interleukin 1 family, member 10 |
| Ccl4 | 0.9 | 6.6 | 7.7 | NM_013652 | Chemokine (C-C motif) ligand 4 |
| Lta | 0.8 | 1.9 | 2.3 | NM_010735 | Lymphotoxin A |
| Tnf | 0.8 | 2.4 | 2.9 | NM_013693 | Tumor necrosis factor |
| Ccl2 | 0.8 | 3.8 | 4.6 | NM_011333 | Chemokine (C-C motif) ligand 2 |
| Ccl3 | 0.8 | 8 | 10 | NM_011337 | Chemokine (C-C motif) ligand 3 |
| Il23a | 0.8 | 3.8 | 4.9 | NM_031252 | Interleukin 23, alpha subunit p19 |
| Il1rn | 0.7 | 7.7 | 10.6 | NM_031167 | Interleukin 1 receptor antagonist |
| Cxcl3 | 0.7 | 2.1 | 2.9 | NM_203320 | Chemokine (C-X-C motif) ligand 3 |
| C4b | 0.7 | 2.9 | 4.2 | NM_009780 | Complement component 4B |
| Ccl5 | 0.7 | 2.4 | 3.5 | NM_013653 | Chemokine (C-C motif) ligand 5 |
| Il10rb | 0.6 | 1.3 | 2.1 | NM_008349 | Interleukin 10 receptor, beta |
| Crp | 0.6 | 2.1 | 3.5 | NM_007768 | Crp, pentraxin-related |
| Ccl1 | 0.5 | 3.9 | 8.4 | NM_011329 | Chemokine (C-C motif) ligand 1 |
| Ccr7 | 0.4 | 3.1 | 7.7 | NM_007719 | Chemokine (C-C motif) receptor 7 |
| Il1r1 | 0.4 | 4.2 | 10.9 | NM_008362 | Interleukin 1 receptor, type I |
| Cxcl9 | 0.3 | 1.1 | 3.8 | NM_008599 | Chemokine (C-X-C motif) ligand 9 |
| Ccl22 | 0.3 | 2.6 | 9.7 | NM_009137 | Chemokine (C-C motif) ligand 22 |
| Tnfsf14 | 0.3 | 0.6 | 2.1 | NM_019418 | Tumor necrosis factor (ligand) superfamily, member 14 |
*The correlation coefficient between TLM and TCM fold change was R 2 = 0.52 (p < 0.001).
TABLE 3.
DON-Induced Downregulation of Inflammatory Response Genes in Translatome (TLM) and Transcriptome (TCM)
| Fold change | Gene Bank | Gene description | |||
|---|---|---|---|---|---|
| Symbol | TLM/TCM | TLM | TCM | ||
| Tlr2 | 1.3 | 0.54 | 0.41 | NM_011905 | Toll-like receptor 2 |
| Cd40 | 0.8 | 0.22 | 0.27 | NM_011611 | CD40 antigen |
| Tlr3 | 0.7 | 0.50 | 0.71 | NM_126166 | Toll-like receptor 3 |
| Il18rap | 0.7 | 0.44 | 0.66 | NM_010553 | Interleukin 18 receptor accessory protein |
| Il7 | 0.6 | 0.23 | 0.38 | NM_008371 | Interleukin 7 |
| Il18 | 0.5 | 0.20 | 0.38 | NM_008360 | Interleukin 18 |
| Ccl25 | 0.5 | 0.44 | 0.93 | NM_009138 | Chemokine (C-C motif) ligand 25 |
| Cxcl10 | 0.4 | 0.01 | 0.02 | NM_021274 | Chemokine (C-X-C motif) ligand 10 |
| Ltb | 0.4 | 0.04 | 0.09 | NM_008518 | Lymphotoxin B |
| Cxcl11 | 0.1 | 0.19 | 1.30 | NM_019494 | Chemokine (C-X-C motif) ligand 11 |
Real-time PCR of samples from three additional independent experiments was used to quantitatively validate modulated expression of selected genes in the polysome and total cellular pools identified in the array study. Upregulation of cytokine genes (IL-1β, IL-6, IL-10, and TNF-α) (Fig. 4), chemokine and receptor genes (CCL2, CCL4, CCL5, CCL7, CXCL2, CCR1, and CCR2) (Fig. 5), and transcription factors (Fos and BCL6) (Fig. 6) were confirmed in both the transcriptome and translatome. Downregulation of IL-18 (Fig. 4) was again observed in both of these populations. For some genes (IL-1β, CCL2, CCL4, and CCL5), modest but significant differences in translatome and transcriptome were observed. Three genes (TLR5, CXCR1, and ITGB2) that were identified in the array to be selectively upregulated in the translatome but not in transcriptome were also verified by real-time PCR (Fig. 7). Accordingly, these data suggest that although upregulation of inflammation-related genes following DON treatment was primarily related to the mRNA species present in the cell, moderate translational regulation was also evident.
FIG. 4.

Comparative effects of DON on cytokine mRNA expression in transcriptome and translatome. Three independent cell culture experiments were conducted and transcriptome and translatome were analyzed by real-time PCR in duplicate. The relative changes in mRNA reflect the ratio of response by DON- and vehicle-treated cells. Data are mean ± SE of triplicate wells. The dotted line indicates the basal level of gene expression (onefold) in total and polysome controls. Asterisk indicates induced significant increases in mRNA expression relative to respective controls within the transcriptome and translatome (p < 0.05).
FIG. 5.

Comparative effects of DON on chemokines and their receptors expression in transcriptome and translatome. Study was conducted and analyzed as described in the legend of Figure 4.
FIG. 6.
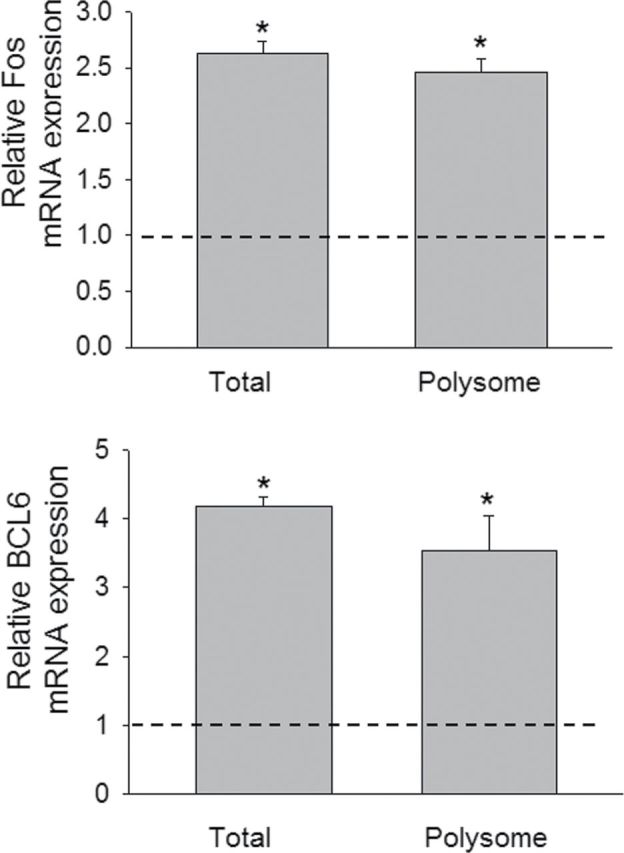
Comparative effects of DON on transcription factor mRNA expression in transcriptome and translatome. Study was conducted and analyzed as described in the legend of Figure 4.
FIG. 7.
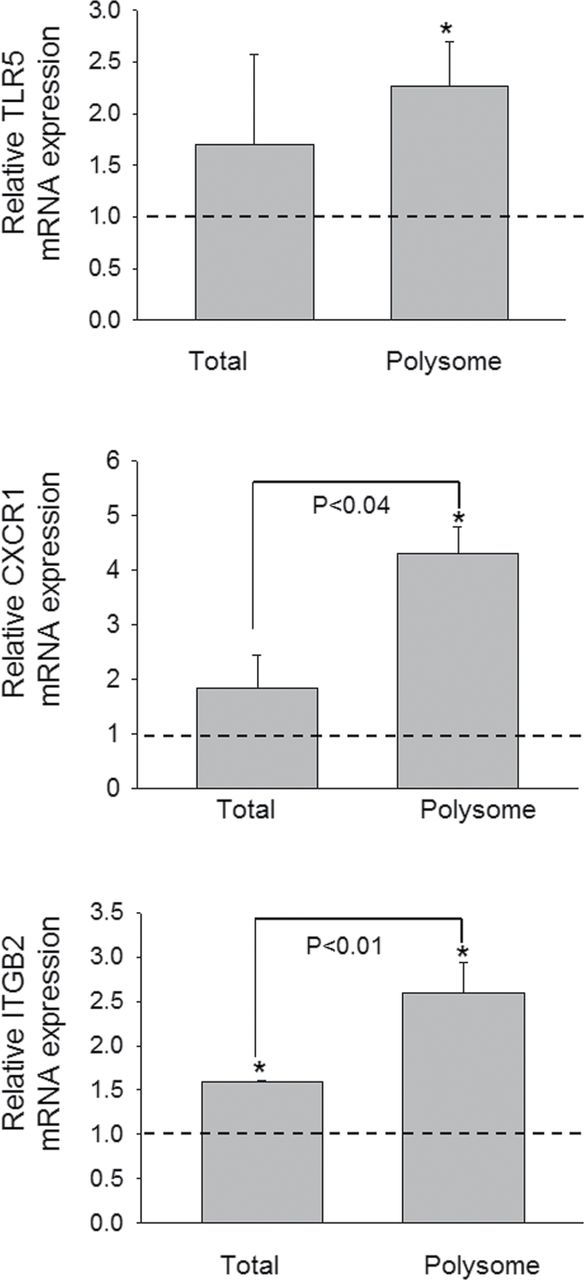
DON induces translatome-specific mRNA expression. Study was conducted and analyzed as described in the legend of Figure 4.
DISCUSSION
Although DON-induced gene expression has been previously investigated in detail relative to the total cellular mRNA pool, this is the first attempt to profile the polysomal mRNAs that are being actively translated following toxin exposure. Given DON’s capacity to target innate immune function and induce inflammation-associated genes, we employed a cloned macrophage model and a focused PCR array. Although previous studies indicate that 250ng/ml of DON partially inhibits translation in RAW 264.7 cells (Zhou et al., 2003b), this concentration did not appear to significantly skew the profile of genes being translated in our analysis. Comparison between transcriptome and translatome indicated most genes in the two pools responded similarly to DON, suggesting the translation to a large extent closely reflected the total cellular pool of mRNAs. Nevertheless, a small number of genes appeared to be further regulated at the level of translation.
A key question that arises relates to how DON might mediate translational regulation of the small subset of genes identified here. In the global context, translation is regulated at multiple levels, some of which could be targeted by DON. Mammalian target of rapamycin complex 1 is activated by phosphoinositide 3-kinase (PI3K) via Akt or directly by ERK1/2 and promotes phosphorylation/activation of p70 S6 kinase (p70S6K) that phosphorylates the small ribosomal subunit protein S6 (Rps6), a process indicated to promote translation (Ma and Blenis, 2009). The PI3K-Akt pathway also mediates increase in the global initiation rate of translation by promoting phosphorylation of 4E-BP1 and subsequent release of eIF4e to bind to the 7-methylGTP cap of mRNAs and increase the rate of initiation (Ma and Blenis, 2009). Alternatively, p90 ribosomal S6 kinase (p90RSK), activated by ERK1/2, also phosphorylates eIF4b and eEF2k (Ma and Blenis, 2009). In contrast, double-stranded RNA-activated protein kinase (PKR), PKR-like endoplasmic reticulum kinase, general control non-derepressible 2 kinase (GCN2) and heme-regulated eukaryotic initiation factor 2 alpha kinase (HRI) suppress global translation by coordinating the phosphorylation of eIF2α. DON is known to concurrently activate the translation-promoting pathway members Akt, ERK1/2, and p90RSK, and the translation-inhibitory PKR (Zhou et al., 2003a,b). Fine-tuning of the balance between these counteracting pathways might account in part for the selective translation of some mRNAs observed in this study.
Besides global regulation, translation of specific messages can be modulated on an individual level. For example, translation of GCN4 is activated in response to amino acid deprivation, which generally represses translation, via a mechanism involving a short upstream open reading frame (Hinnebusch, 1997). In addition, translation of specific messages can also be controlled by specific RBPs (Gebauer and Hentze, 2004), many of which interact with functionally related groups of mRNAs, illustrating the elaborate regulation on level of translation. microRNAs can also precisely regulate specific gene expression by imperfectly binding to the 3′-UTR of target mRNA. Resultant stalled translation complexes could be degraded or relocalized to stress granule for future use (Leung and Sharp, 2010). We have previously determined that the concentration and time period used here, DON can modulate the profile of miRNAs in macrophage (He and Pestka, 2010), suggesting a potential role for these modulating inflammatory gene expression. Further investigation is needed to elucidate the regulatory elements responsible for DON-mediated translation regulation genes.
The profiles of genes (cytokine, chemokine, receptor, transcription factor, and inflammation) in the translatome and transcriptome provide valuable new insight into the immunotoxic actions of DON. DON-induced upregulation of IL-1β, IL-6, and TNF-α as observed here is highly consistent with previous findings (Wong et al., 1998, 2001; Zhou et al., 1998). IL-6 can act as both a proinflammatory and anti-inflammatory cytokine and it also stimulates the expression of interleukin 1 receptor antagonist (IL-1rn) and IL-10 (Borish and Steinke, 2003; Petersen and Pedersen, 2005), the upregulation of which were also found in this study. IL-1rn can nonfunctionally bind to the same receptor as IL-1. IL-10 inhibits production of IL-1β, IL-6, IL-12, CXCL8, and TNF-α in monocyte/macrophage (Commins et al., 2010). DON-induced upregulation of IL-1 receptor (IL-1r1) and IL-1, and mutual induction of TNF and IL-1 may be negatively regulated by IL-1rn, IL-6 and IL-10. In total, these responses are consistent with both induction of inflammatory genes as well as anti-inflammatory genes that can minimize physiological damage to tissue.
The observation that the CC chemokine family was markedly upregulated upon DON exposure represents a critical finding because this family of small molecules directs receptor-mediated trafficking of leukocytes. CC chemokines control both recruitment of effector leukocytes to target sites of infection and the migration of cells during normal processes of tissue maintenance or development (Borish and Steinke, 2003; Moser et al., 2004). CCL2 and CCL7, which were previously reported to be upregulated in spleens of DON-exposed mice (Kinser et al., 2004, 2005), are potent chemoattractants that direct monocytes/macrophages to inflammatory sites by regulating the expression of adhesion molecules and cytokines in these cells (Jiang et al., 1992; Maddaluno et al., 2011). Our data show for the first time that DON upregulated CCL3 and CCL4, both of which have potent chemotactic activities for monocytes and T cells (Hasegawa et al., 1999). It is notable that receptors for these chemokines were also upregulated in the transcriptome and translatome (CCR1, CCR2, and CXCR2). These data strongly suggest that leukocyte chemotaxis could contribute to aberrant systemic inflammatory responses observed in DON-exposed animals.
Two transcription factors, Fos and BCL6, were also observed here to be upregulated by DON in transcriptome and translatome. Fos heterodimerizes with other subunits to form activator protein-1 (AP-1) transcriptional factor complex and regulates gene expression in response to various stimuli, including cytokines, stress, and bacterial and viral infections (Hess et al., 2004). Increased AP-1 binding has been observed in DON-exposed RAW 264.7 cells (Wong et al., 2002). Binding activity of AP-1 is elevated upon DON treatment in mouse spleen, which precedes the upregulation of inflammatory cytokine expression (Kinser et al., 2004; Zhou et al., 2003a). BCL6 is a zinc-finger transcription factor that represses transcription in a sequence-specific manner and modulates inflammation (Barish et al., 2010) by cistronic antagonism of NF-kB, a transcription factor that is also activated by DON (Gray and Pestka, 2007; Zhou et al., 2003a). BCL6 represses transcription of IL-18 (Takeda et al., 2003; Yu et al., 2005), the downregulation of which was observed here in the PCR array and confirmed by real-time PCR. Chemokine are also negatively regulated by BCL6 to attenuate inflammation (Seto et al., 2011; Toney et al., 2000), suggesting BCL6 might be important in modulation of DON-induced immunostimulatory events.
Other genes with significant immunological functions induced by DON included C4b and C3ar1, components of complement system, which are important components of host defense and enhancement of phagocytosis (Ogundele, 2001). C3ar1, was previously reported to be upregulated by DON (Chung et al., 2003). C-reactive protein (Crp) (Carroll, 2004), an acute-phase protein that rises in response to inflammation and activates the complement system, was also upregulated by DON. Overall, upregulation of C4b, C3ar1, and Crp indicates involvement of complement system in DON-induced inflammatory response.
Although here we specifically examined the correlation between transcriptome and translatome for genes related to innate immunity by DON, there are obvious limitations to using a focused PCR array with a relatively small number of genes. It will therefore be of interest in the future to compare translatome and transcriptome profiles at a genome-wide level to determine if expression of other genes such as those related to energy metabolism and cell cycle are regulated similarly to inflammation-associated genes. Another limitation here was the use of single time point, making it difficult to discriminate inflammatory genes responding primarily to DON exposure from those affected in secondary fashion by the upregulation of potent modulatory cytokines and chemokines. Thus, future studies should employ multiple time points.
Taken together, DON potently induced translation of various cytokine, chemokine, their receptor, and transcription such factor genes associated with inflammation. Although most of this upregulation corresponded to increased transcription and/or mRNA stability, some genes appeared to be additionally regulated at translational level. The major implication of this study is that it demonstrates the potential for a ribotoxin to selectively enhance the expression of proteins at the translation level. This expands understanding of the ribotoxic stress response elicited by a wide range of xenobiotics with public health significance, as well as provides new insight into the complex nature of translational regulation.
FUNDING
This study was supported by ES003358 from the National Institutes of Health grant as well as USDA Wheat and Barley SCAB Initiative Award 59-0206-9-058 and USDA NIFA Award 2011-D635.
ACKNOWLEDGMENT
We thank Mary Rosner for technical assistance and suggestions.
REFERENCES
- Bae H. K., Shinozuka J., Islam Z., Pestka J. J. (2009). Satratoxin G interaction with 40S and 60S ribosomal subunits precedes apoptosis in the macrophage. Toxicol. Appl. Pharmacol. 237, 137–145. [DOI] [PMC free article] [PubMed] [Google Scholar]
- Barish G. D., Yu R. T., Karunasiri M., Ocampo C. B., Dixon J., Benner C., Dent A. L., Tangirala R. K., Evans R. M. (2010). Bcl-6 and NF-kappaB cistromes mediate opposing regulation of the innate immune response. Genes Dev. 24, 2760–2765. [DOI] [PMC free article] [PubMed] [Google Scholar]
- Borish L. C., Steinke J. W. (2003). 2. Cytokines and chemokines. J. Allergy Clin. Immunol. 111,(2 Suppl)S460–S475. [DOI] [PubMed] [Google Scholar]
- Carroll M. C. (2004). The complement system in regulation of adaptive immunity. Nat. Immunol. 5, 981–986. [DOI] [PubMed] [Google Scholar]
- Cheeseman M. T., Tyrer H. E., Williams D., Hough T. A., Pathak P., Romero M. R., Hilton H., Bali S., Parker A., Vizor L., et al. (2011). HIF-VEGF pathways are critical for chronic otitis media in Junbo and Jeff mouse mutants. PLoS Genet. 7, e1002336. [DOI] [PMC free article] [PubMed] [Google Scholar]
- Choi H. J., Yang H., Park S. H., Moon Y. (2009). HuR/ELAVL1 RNA binding protein modulates interleukin-8 induction by muco-active ribotoxin deoxynivalenol. Toxicol. Appl. Pharmacol. 240, 46–54. [DOI] [PubMed] [Google Scholar]
- Chung Y. J., Zhou H. R., Pestka J. J. (2003). Transcriptional and posttranscriptional roles for p38 mitogen-activated protein kinase in upregulation of TNF-alpha expression by deoxynivalenol (vomitoxin). Toxicol. Appl. Pharmacol. 193, 188–201. [DOI] [PubMed] [Google Scholar]
- Commins S. P., Borish L., Steinke J. W. (2010). Immunologic messenger molecules: Cytokines, interferons, and chemokines. J. Allergy Clin. Immunol. 125(2 Suppl 2),S53–S72. [DOI] [PubMed] [Google Scholar]
- Gebauer F., Hentze M. W. (2004). Molecular mechanisms of translational control. Nat. Rev. Mol. Cell Biol. 5, 827–835. [DOI] [PMC free article] [PubMed] [Google Scholar]
- Gray J. S., Pestka J. J. (2007). Transcriptional regulation of deoxynivalenol-induced IL-8 expression in human monocytes. Toxicol. Sci. 99, 502–511. [DOI] [PubMed] [Google Scholar]
- Grolleau A., Bowman J., Pradet-Balade B., Puravs E., Hanash S., Garcia-Sanz J. A., Beretta L. (2002). Global and specific translational control by rapamycin in T cells uncovered by microarrays and proteomics. J. Biol. Chem. 277, 22175–22184. [DOI] [PubMed] [Google Scholar]
- Halbeisen R. E., Gerber A. P. (2009). Stress-dependent coordination of transcriptome and translatome in yeast. PLoS Biol. 7, e1000105. [DOI] [PMC free article] [PubMed] [Google Scholar]
- Hasegawa M., Sato S., Takehara K. (1999). Augmented production of chemokines (monocyte chemotactic protein-1 (MCP-1), macrophage inflammatory protein-1alpha (MIP-1alpha) and MIP-1beta) in patients with systemic sclerosis: MCP-1 and MIP-1alpha may be involved in the development of pulmonary fibrosis. Clin. Exp. Immunol. 117, 159–165. [DOI] [PMC free article] [PubMed] [Google Scholar]
- He K., Pestka J. J. (2010). Deoxynivalenol-induced modulation of microRNA expression in RAW 264.7 macrophages-A potential novel mechanism for translational inhibition The Toxicologist 114(Suppl), 310. [Google Scholar]
- Hess J., Angel P., Schorpp-Kistner M. (2004). AP-1 subunits: Quarrel and harmony among siblings. J. Cell. Sci. 117,(Pt 25)5965–5973. [DOI] [PubMed] [Google Scholar]
- Hinnebusch A. G. (1997). Translational regulation of yeast GCN4. A window on factors that control initiator-trna binding to the ribosome. J. Biol. Chem. 272, 21661–21664. [DOI] [PubMed] [Google Scholar]
- Islam Z., Gray J. S., Pestka J. J. (2006). p38 Mitogen-activated protein kinase mediates IL-8 induction by the ribotoxin deoxynivalenol in human monocytes. Toxicol. Appl. Pharmacol. 213, 235–244. [DOI] [PubMed] [Google Scholar]
- Jiang Y., Beller D. I., Frendl G., Graves D. T. (1992). Monocyte chemoattractant protein-1 regulates adhesion molecule expression and cytokine production in human monocytes. J. Immunol. 148, 2423–2428. [PubMed] [Google Scholar]
- Kinser S., Jia Q., Li M., Laughter A., Cornwell P., Corton J. C., Pestka J. (2004). Gene expression profiling in spleens of deoxynivalenol-exposed mice: Immediate early genes as primary targets. J. Toxicol. Environ. Health Part A 67, 1423–1441. [DOI] [PubMed] [Google Scholar]
- Kinser S., Li M., Jia Q., Pestka J. J. (2005). Truncated deoxynivalenol-induced splenic immediate early gene response in mice consuming (n-3) polyunsaturated fatty acids. J. Nutr. Biochem. 16, 88–95. [DOI] [PubMed] [Google Scholar]
- Kuny S., Gaillard F., Sauvé Y. (2012). Differential gene expression in eyecup and retina of a mouse model of Stargardt-like macular dystrophy (STGD3). Invest. Ophthalmol. Vis. Sci. 53, 664–675. [DOI] [PubMed] [Google Scholar]
- Leung A. K., Sharp P. A. (2010). MicroRNA functions in stress responses. Mol. Cell 40, 205–215. [DOI] [PMC free article] [PubMed] [Google Scholar]
- Ma X. M., Blenis J. (2009). Molecular mechanisms of mTOR-mediated translational control. Nat. Rev. Mol. Cell Biol. 10, 307–318. [DOI] [PubMed] [Google Scholar]
- Maddaluno M., Di Lauro M., Di Pascale A., Santamaria R., Guglielmotti A., Grassia G., Ialenti A. (2011). Monocyte chemotactic protein-3 induces human coronary smooth muscle cell proliferation. Atherosclerosis 217, 113–119. [DOI] [PubMed] [Google Scholar]
- Markou T., Marshall A. K., Cullingford T. E., Tham e. l. L., Sugden P. H., Clerk A. (2010). Regulation of the cardiomyocyte transcriptome vs translatome by endothelin-1 and insulin: Translational regulation of 5’ terminal oligopyrimidine tract (TOP) mRNAs by insulin. BMC Genomics 11, 343. [DOI] [PMC free article] [PubMed] [Google Scholar]
- Mikulits W., Pradet-Balade B., Habermann B., Beug H., Garcia-Sanz J. A., Müllner E. W. (2000). Isolation of translationally controlled mRNAs by differential screening. FASEB J. 14, 1641–1652. [DOI] [PubMed] [Google Scholar]
- Moon Y., Pestka J. J. (2002). Vomitoxin-induced cyclooxygenase-2 gene expression in macrophages mediated by activation of ERK and p38 but not JNK mitogen-activated protein kinases. Toxicol. Sci. 69, 373–382. [DOI] [PubMed] [Google Scholar]
- Moser B., Wolf M., Walz A., Loetscher P. (2004). Chemokines: Multiple levels of leukocyte migration control. Trends Immunol. 25, 75–84. [DOI] [PubMed] [Google Scholar]
- Mustroph A., Bailey-Serres J. (2010). The Arabidopsis translatome cell-specific mRNA atlas: Mining suberin and cutin lipid monomer biosynthesis genes as an example for data application. Plant Signal. Behav. 5, 320–324. [DOI] [PMC free article] [PubMed] [Google Scholar]
- Ogundele M. (2001). Role and significance of the complement system in mucosal immunity: Particular reference to the human breast milk complement. Immunol. Cell Biol. 79, 1–10. [DOI] [PubMed] [Google Scholar]
- Pestka J. J. (2010). Deoxynivalenol: Mechanisms of action, human exposure, and toxicological relevance. Arch. Toxicol. 84, 663–679. [DOI] [PubMed] [Google Scholar]
- Petersen A. M., Pedersen B. K. (2005). The anti-inflammatory effect of exercise. J. Appl. Physiol. 98, 1154–1162. [DOI] [PubMed] [Google Scholar]
- Preiss T., Baron-Benhamou J., Ansorge W., Hentze M. W. (2003). Homodirectional changes in transcriptome composition and mRNA translation induced by rapamycin and heat shock. Nat. Struct. Biol. 10, 1039–1047. [DOI] [PubMed] [Google Scholar]
- Proud C. G. (2007). Signalling to translation: How signal transduction pathways control the protein synthetic machinery. Biochem. J. 403, 217–234. [DOI] [PubMed] [Google Scholar]
- Seto T., Yoshitake M., Ogasawara T., Ikari J., Sakamoto A., Hatano M., Hirata H., Fukuda T., Kuriyama T., Tatsumi K., et al. (2011). Bcl6 in pulmonary epithelium coordinately controls the expression of the CC-type chemokine genes and attenuates allergic airway inflammation. Clin. Exp. Allergy 41, 1568–1578. [DOI] [PubMed] [Google Scholar]
- Shenton D., Smirnova J. B., Selley J. N., Carroll K., Hubbard S. J., Pavitt G. D., Ashe M. P., Grant C. M. (2006). Global translational responses to oxidative stress impact upon multiple levels of protein synthesis. J. Biol. Chem. 281, 29011–29021. [DOI] [PubMed] [Google Scholar]
- Shifrin V. I., Anderson P. (1999). Trichothecene mycotoxins trigger a ribotoxic stress response that activates c-Jun N-terminal kinase and p38 mitogen-activated protein kinase and induces apoptosis. J. Biol. Chem. 274, 13985–13992. [DOI] [PubMed] [Google Scholar]
- Smirnova J. B., Selley J. N., Sanchez-Cabo F., Carroll K., Eddy A. A., McCarthy J. E., Hubbard S. J., Pavitt G. D., Grant C. M., Ashe M. P. (2005). Global gene expression profiling reveals widespread yet distinctive translational responses to different eukaryotic translation initiation factor 2B-targeting stress pathways. Mol. Cell. Biol. 25, 9340–9349. [DOI] [PMC free article] [PubMed] [Google Scholar]
- Sonenberg N., Hinnebusch A. G. (2009). Regulation of translation initiation in eukaryotes: Mechanisms and biological targets. Cell 136, 731–745. [DOI] [PMC free article] [PubMed] [Google Scholar]
- Takeda N., Arima M., Tsuruoka N., Okada S., Hatano M., Sakamoto A., Kohno Y., Tokuhisa T. (2003). Bcl6 is a transcriptional repressor for the IL-18 gene. J. Immunol. 171, 426–431. [DOI] [PubMed] [Google Scholar]
- Takeda K., Kojima Y., Ikejima K., Harada K., Yamashina S., Okumura K., Aoyama T., Frese S., Ikeda H., Haynes N. M., et al. (2008). Death receptor 5 mediated-apoptosis contributes to cholestatic liver disease. Proc. Natl. Acad. Sci. U.S.A. 105, 10895–10900. [DOI] [PMC free article] [PubMed] [Google Scholar]
- Tebaldi T., Re A., Viero G., Pegoretti I., Passerini A., Blanzieri E., Quattrone A. (2012). Widespread uncoupling between transcriptome and translatome variations after a stimulus in mammalian cells. BMC Genomics 13, 220. [DOI] [PMC free article] [PubMed] [Google Scholar]
- Toney L. M., Cattoretti G., Graf J. A., Merghoub T., Pandolfi P. P., Dalla-Favera R., Ye B. H., Dent A. L. (2000). BCL-6 regulates chemokine gene transcription in macrophages. Nat. Immunol. 1, 214–220. [DOI] [PubMed] [Google Scholar]
- Wong S., Schwartz R. C., Pestka J. J. (2001). Superinduction of TNF-alpha and IL-6 in macrophages by vomitoxin (deoxynivalenol) modulated by mRNA stabilization. Toxicology 161, 139–149. [DOI] [PubMed] [Google Scholar]
- Wong S. S., Zhou H. R., Marin-Martinez M. L., Brooks K., Pestka J. J. (1998). Modulation of IL-1beta, IL-6 and TNF-alpha secretion and mRNA expression by the trichothecene vomitoxin in the RAW 264.7 murine macrophage cell line. Food Chem. Toxicol. 36, 409–419. [DOI] [PubMed] [Google Scholar]
- Wong S. S., Zhou H. R., Pestka J. J. (2002). Effects of vomitoxin (deoxynivalenol) on the binding of transcription factors AP-1, NF-kappaB, and NF-IL6 in raw 264.7 macrophage cells. J. Toxicol. Environ. Health Part A 65, 1161–1180. [DOI] [PubMed] [Google Scholar]
- Yang G. H., Pestka J. J. (2002). Vomitoxin (deoxynivalenol)-mediated inhibition of nuclear protein binding to NRE-A, an IL-2 promoter negative regulatory element, in EL-4 cells. Toxicology 172, 169–179. [DOI] [PubMed] [Google Scholar]
- Yu R. Y., Wang X., Pixley F. J., Yu J. J., Dent A. L., Broxmeyer H. E., Stanley E. R., Ye B. H. (2005). BCL-6 negatively regulates macrophage proliferation by suppressing autocrine IL-6 production. Blood 105, 1777–1784. [DOI] [PubMed] [Google Scholar]
- Zhou H. R., Islam Z., Pestka J. J. (2003a). Rapid, sequential activation of mitogen-activated protein kinases and transcription factors precedes proinflammatory cytokine mRNA expression in spleens of mice exposed to the trichothecene vomitoxin. Toxicol. Sci. 72, 130–142. [DOI] [PubMed] [Google Scholar]
- Zhou H. R., Lau A. S., Pestka J. J. (2003b). Role of double-stranded RNA-activated protein kinase R (PKR) in deoxynivalenol-induced ribotoxic stress response. Toxicol. Sci. 74, 335–344. [DOI] [PubMed] [Google Scholar]
- Zhou H. R., Yan D., Pestka J. J. (1998). Induction of cytokine gene expression in mice after repeated and subchronic oral exposure to vomitoxin (deoxynivalenol): Differential toxin-induced hyporesponsiveness and recovery. Toxicol. Appl. Pharmacol. 151, 347–358. [DOI] [PubMed] [Google Scholar]
- Zong Q., Schummer M., Hood L., Morris D. R. (1999). Messenger RNA translation state: The second dimension of high-throughput expression screening. Proc. Natl. Acad. Sci. U.S.A. 96, 10632–10636. [DOI] [PMC free article] [PubMed] [Google Scholar]