

Abstract
The aryl hydrocarbon receptor (AhR) mediates alterations in hepatic lipid composition elicited by 2,3,7,8-tetrachlorodibenzo-p-dioxin (TCDD). In order to further investigate the effects of TCDD, liver, serum, and gonadal white adipose tissue (gWAT) fatty acid methyl esters (FAMEs) and lipids were examined in fasted 4-week-old female mice orally gavaged with 30 µg/kg TCDD at 24, 72, and 168h postdose. Mean hepatic FAME levels increased (236.7 µmol/g in controls compared with 392.2 µmol/g in TCDD treated) with minimal changes in gWAT and serum. In the liver, TCDD decreased saturated fatty acids (SFAs 16:0, 18:0, 20:0, and 22:0) and increased monounsaturated fatty acids (MUFAs 16:1n7, 18:1n9, and 20:1n9). Hepatic polyunsaturated fatty acids (PUFAs) 20:2n6, 20:3n6, 18:3n3, and 22:5n3 also increased, whereas 20:4n6 and 22:6n3 levels decreased. gWAT PUFAs 20:2n6 and 20:3n6 exhibited modest increases, whereas serum 18:0 decreased and 18:1n9 increased. Serum analyses also identified a ~25% decrease in total cholesterol (CHOL), low-density lipoprotein (LDL), and high-density lipoprotein following TCDD treatment. The decrease in serum CHOL was consistent with the induction of hepatic reverse CHOL transport genes Lcat (2.0-fold), Apoa1 (1.7-fold), and Ldlr (3.6-fold), and the repression of CHOL biosynthesis genes Hmgcs1 (−2.1-fold) and Hmgcr (−2.3-fold). In addition, TCDD decreased serum Apob100 (4.4-fold) and Apob48 (2.2-fold) protein levels, suggesting serum lipid clearance and decreased hepatic efflux. Collectively, the TCDD-elicited decreases in serum lipid levels are consistent with AhR-mediated enhancement of dietary fat distribution to the liver.
Key Words: TCDD, AhR, lipid.
The aryl hydrocarbon receptor (AhR) is a ligand-activated transcription factor with no known endogenous high-affinity ligand. In addition to 2,3,7,8-tetrachlorodibenzo-p-dioxin (TCDD) it binds other structurally diverse chemicals including endobiotics (indoles, tetrapyrroles, and arachidonic acid [AA] metabolites) and natural products (vegetable-, fruit-, and tea-derived indoles and flavonoid metabolites) (Denison and Nagy, 2003; Nguyen and Bradfield, 2008). The canonical pathway involves AhR activation following ligand binding, translocation to the nucleus, and heterodimerization with the AhR nuclear translocator (Hankinson, 1995; Pollenz et al., 1994). The heterodimer complex then interacts with dioxin response elements in the promoters of target genes and recruits transcriptional coactivators to regulate gene transcription (Denison et al., 1988; Yao and Denison, 1992).
AhR-mediated disruption of energy balance includes hepatic lipid abnormalities marked by steatosis and inflammation. TCDD also induces hepatic lipid transport, processing, and metabolism gene expression including Cd36 (Lee et al., 2010), Vldlr, Ldlr, Fabp1, and Slc27a3-4 concurrent with decreased expression of Fasn (Angrish et al., 2012; Boverhof et al., 2006; Kopec et al., 2008) and enzyme activity (Lakshman et al., 1988). Gene expression with complementary diet and 14C-oleate studies implicate dietary fat as a lipid source in TCDD-elicited steatosis, suggesting that hepatic lipid accumulation is due to enhanced uptake of dietary lipids rather than de novo synthesis (Angrish et al., forthcoming). However, TCDD is also reported to inhibit adipocyte differentiation in vitro (Alexander et al., 1998; Shimba et al., 1998) and induce adipose lipolysis in rats (Lee et al., 2010; Pohjanvirta et al., 1990). Although these processes may contribute to hepatic fat accumulation, in vivo studies examining the effects of TCDD on adipose tissue in mice are lacking.
Although steatosis is the simple, benign and reversible accumulation of fat, chronic hepatic accumulation can progress to steatohepatitis, nonalcoholic fatty liver disease, nonalcoholic steatohepatitis, and cirrhosis, leading to metabolic syndrome (MetS) (Alberti et al., 2009; Olufadi and Byrne, 2008; Trauner et al., 2010; Vanni et al., 2010). The incidence of MetS is approaching pandemic proportions (Ford et al., 2010), and can exacerbate cardiovascular disease, diabetes, and hepatocellular carcinoma progression (Cheung and Sanyal, 2010; Trauner et al., 2010). It is characterized by dyslipidemia, obesity, and increased hepatic triacylglyceride (TAG) levels (Cheung and Sanyal, 2010; Donnelly et al., 2005). Although genetics, culture, increased caloric intake, and a more sedentary lifestyle are major contributing factors to MetS development (Unger, 2003; Unger and Zhou, 2001), exposure to metabolic disrupting chemicals may have an underappreciated role in the etiology of MetS and its associated diseases (Casals-Casas and Desvergne, 2011; Chen et al., 2009; Grun and Blumberg, 2009a,b). For example, human epidemiological studies have associated MetS, obesity, and diabetes with exposure to organochlorines (Alonso-Magdalena et al., 2008; Apelberg et al., 2007; Casals-Casas et al., 2008; Cimafranca et al., 2004; Hatch et al., 2010; Park et al., 2010; Rubin, 2007; Smink et al., 2008; Stahlhut et al., 2007; Swedenborg et al., 2009; Turyk et al., 2009). This includes hyperlipidemia and vascular disorders such as atherosclerotic plaque formation and increased risk for cardiovascular disease and diabetes (Kang et al., 2006; Kern et al., 2004; Pelclova et al., 2002, 2009). Collectively, the link between AhR-mediated effects and MetS-associated diseases warrants further investigation.
Our previous studies in fed mice suggest AhR-mediated hepatic steatosis involves coordinated digestive and hepatic interactions that enhance dietary lipid deposition in the liver (Angrish et al., forthcoming). However, TCDD may also affect other lipogenic tissues and blood-lipid transport that contribute to hepatic steatosis. Consequently, this complementary study examines the effects of TCDD on fatty acid (FA) composition in the liver, gWAT, and serum as well as serum cholesterol (CHOL) and apolipoprotein B (Apob) in fasted mice. The reported changes provide further evidence that TCDD-elicited steatosis involves the hepatic accumulation of dietary fat.
MATERIALS AND METHODS
Animal husbandry and in vivo treatment.
Heterozygous B6.129-Scd1 tm1Myz/J mice (Jackson Laboratory, Ben Harbor, ME) were bred, genotyped, and weaned as previously described (Angrish et al., 2011) to select for female, wild-type (WT) mice. On post natal date (PND) 28, female WT mice (n = 5) were gavaged with 0.1ml of sesame oil (vehicle control) or 30 µg/kg TCDD (Dow Chemical Company, Midland, MI). WT B6.129-Scd1 tm1Myz/J immature mice were used to facilitate comparisons with other data sets and to minimize potential interactions with estrogens produced by developing ovaries. The dose was chosen to elicit moderate hepatic effects while avoiding overt toxicity. Animals were fasted 4h prior to sacrifice at 24, 72, and 168h postdose. Blood was collected via submandibular vein puncture before sacrifice. Liver and gWAT samples were flash frozen in liquid nitrogen and stored at −80°C. All procedures were carried out with Michigan State University Institutional Animal Care and Use Committee approval.
Serum lipid panels.
Serum total CHOL, free CHOL, low-density lipoprotein (LDL), high-density lipoprotein (HDL), nonesterified fatty acids (NEFA), and TAG were measured according to the manufacturer’s microtiter protocol (CHOL E; Free CHOL E, L-Type LDL, L-Type HDL, NEFA-HR(2), L-Type TG M, Wako Diagnostics).
Gas chromatography-mass spectrometry (GC-MS) fatty acid methyl ester lipid profiling.
Lipid analysis was performed as previously described (Angrish et al., 2011). Lipids extracted from liver (~100mg), gWAT (~30mg), and serum (50 µl) were separated and analyzed with an Agilent 6890N GC with a 30mDB23 column interfaced to an Agilent 5973 MS. 19:1n9 free fatty acid (FFA) and 19:0 TAG were added as extraction efficiency controls and 17:1n1 fatty acid methyl ester (Nu-Chek, Elysian, MN) was spiked in as a loading control. GC-MS data files were converted to Waters MassLynx file format, analyzed with MassLynx software and reported as µmol/g liver or adipose tissue and nmol/ml serum. FA levels are based on peak areas from total ion chromatograms, and µmol is obtained from a linear calculation of a calibration curve and normalized to sample weight (liver and adipose) or volume (serum).
Western blot.
Serum was diluted 1:5 in RIPA buffer (50mM Tris-HCl pH 7.4, 1% NP-40, 0.25% Na-deoxycholate, 150mM NaCl, 1mM EDTA), separated using 5% SDS-PAGE, transferred to a PVDF membrane (Millipore, Billerica, MA) and immunoblotted with ApoB antibody SC-11795 (Santa Cruz Biotechnology, Santa Cruz, CA). Immunoreactive bands were visualized by chemiluminescence with the Pierce ECL Western blotting substrate (Thermo Scientific, Rockford, IL) and quantified by densitometry (ImageJ).
RNA isolation.
RNA was isolated from frozen liver and gWAT samples with ~1.0ml TRIzol (Invitrogen) according to the manufacturer’s protocol and an additional acid phenol:chloroform extraction as previously described (Boverhof et al., 2006). Total RNA was resuspended in RNA storage solution, quantified by spectrophotometry at A260, and quality assessed by gel electrophoresis.
Quantitative real-time PCR.
Quantitative real-time PCR (QRTPCR) was performed as previously described (Boverhof et al., 2006). The copy number of each sample was standardized to the geometric mean of Gapdh, Hprt, and Actb to control for differences in RNA loading, quality, and cDNA synthesis (Vandesompele et al., 2002). Data are reported as the fold change of standardized treated over standardized vehicle.
Statistical analysis.
Data were analyzed by ANOVA followed by Tukey’s post hoc test in SAS 9.2 (SAS Institute, Cary, NC), unless otherwise stated. Differences between treatment groups were considered significant when p < 0.05.
RESULTS
TCDD Effects on Body, Liver, and Adipose Weights
Fasted mice gavaged with 30 µg/kg TCDD had increased absolute and relative liver weights at 72 and 168h postdose (Table 1). There were no significant alterations in body weight, body weight gain, or adipose weight throughout the study suggesting treatment had no effect on food consumption.
TABLE 1.
Effect of TCDD on Body, Liver, and gWAT Weights at 24, 72, and 168h Postdose
| Time (h) | Treatment | Body weight (g) | Body weight gain (g) | Absolute liver weight (g) | Relative liver weight | Absolute gWAT weight (g) | Relative gWAT weight |
|---|---|---|---|---|---|---|---|
| 24 | Vehicle | 12.1±1.9 | 0.5±0.6 | 0.74±0.103 | 0.061±0.002 | 0.04±0.02 | 0.0035±0.0011 |
| TCDD | 12.8±0.9 | -0.2±0.8 | 0.80±0.095 | 0.063±0.007 | 0.05±0.01 | 0.0040±0.0009 | |
| 72 | Vehicle | 14.5±0.9 | 1.6±0.2 | 0.79±0.051 | 0.055±0.001 | 0.08±0.02 | 0.0055±0.0013 |
| TCDD | 14.0±0.9 | 1.4±0.1 | 0.94±0.074* | 0.067±0.003* | 0.06±0.03 | 0.0039±0.0019 | |
| 168 | Vehicle | 15.3±0.7 | 3.3±1.1 | 0.85±0.070 | 0.055±0.002 | 0.06±0.01 | 0.0041±0.0006 |
| TCDD | 15.2±0.6 | 3.4±1.0 | 1.04±0.060* | 0.068±0.002* | 0.07±0.02 | 0.0044±0.0010 |
Note. Whole liver weights were normalized to whole body weight at sacrifice.
*p < 0.05 for TCDD compared with vehicle.
Liver, Adipose, and Serum FA Composition in Fasted Mice
Similar to fed mice (Angrish et al., 2011), GC-MS FA analysis of hepatic lipid composition in fasted mice identified that TCDD increased mean (µmol/g) total fatty acids (TFAs; 1.7-fold), saturated fatty acids (SFAs; 1.25-fold), monounsaturated fatty acids (MUFAs; 3.1-fold), and polyunsaturated fatty acids (PUFAs; 1.5-fold) (Table 2, Fig. 1). However, TCDD decreased mean mol% palmitate (16:0) and stearate (18:0), whereas palmitate (16:1n7) and oleate (18:1n9) increased, consistent with the 2.9-fold induction of the hepatic Scd1 activity index (Table 2). Eicosanoic acid (20:1n9), a downstream product of SFA desaturation and elongation, also increased with treatment.
TABLE 2.
Liver, gWAT, and Serum Lipid Content
| Treatment | Liver (µmol/g) | gWAT (µmol/g) | Serum (nmol/ml) | |
|---|---|---|---|---|
| Total FA | Vehicle | 237±26 | 3408±1280.9 | 413±104 |
| TCDD | 392±58* | 3928±945.2 | 411±100 | |
| Total SFA | Vehicle | 89±6.8 | 1251±435.3 | 147±37 |
| TCDD | 113±10* | 1476±413.2 | 137±39 | |
| Total MUFA | Vehicle | 34±4.2 | 901±338.2 | 63±17 |
| TCDD | 106±22* | 1033±214.6 | 74±19 | |
| Total PUFA | Vehicle | 114±15 | 1257±513.0 | 204±53 |
| TCDD | 173±28* | 1420±323.6 | 200±47 | |
| 18:1n9/18:0 | Vehicle | 0.8±0.1 | 1.5±0.2 | 1.3±0.0 |
| TCDD | 2.2±0.3* | 1.4±0.3 | 1.8±0.3* | |
| 20:4n6/18:2n6 | Vehicle | 0.8±0.1* | 0.022±0.010 | 0.24±0.04 |
| TCDD | 0.5±0.1 | 0.027±0.004 | 0.21±0.05 | |
| 20:5n3/18:3n3 | Vehicle | 1.0±0.03* | nda | ndb |
| TCDD | 0.4±0.1 | nda | ndb |
Note. nd, not detected.
a20:5n3 was not detected in gWAT.
b20:5n3 and 18:3n3 were not detected in serum.
* p < 0.05 for TCDD compared with vehicle.
FIG. 1.
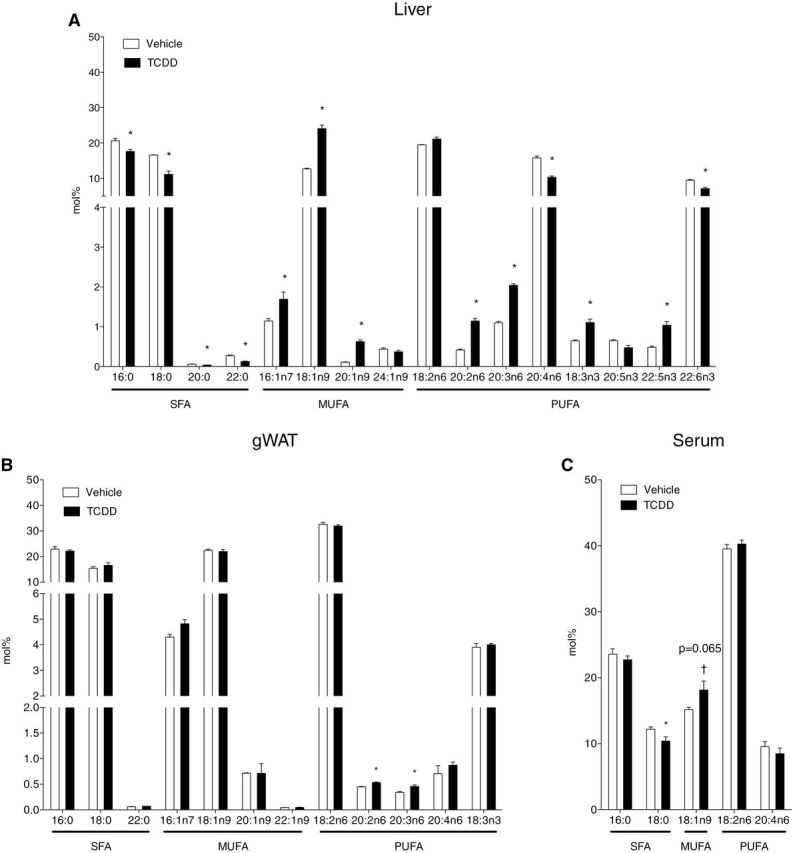
TFA composition in (A) liver (µmol/g), (B) gWAT, aka peripheral fat pad (µmol/g), and (C) serum (nmol/g) at 168h post 30 µg/kg TCDD or sesame oil vehicle dose. TFAs were extracted by Folch method and quantified by GC-MS. *p < 0.05 for TCDD compared with vehicle. Bars represent mean + SEM. Liver, n = 4; adipose and serum, n = 5.
n-3 and n-6 PUFAs are derived from the diet and via modification of the essential FAs linoleic (18:2n6) and α-linolenic (18:3n3) acids (Marszalek and Lodish, 2005). Both n-3 and n-6 pathway intermediates exhibited mixed responses to TCDD (Fig. 1A). Although 18:2n6 levels were not altered, its derivatives, eicosadienoic acid (20:2n6) and dihomo-γ-linolenic acid (20:3n6), increased. AA (20:4n6), another downstream product of linoleic acid that can be further metabolized into bioactive products promoting proinflammatory conditions (Bui et al., 2012; Yashodhara et al., 2009), decreased in TCDD-treated mice. α-Linolenic acid (18:3n3), the precursor for all n-3 FAs, was also increased by TCDD (Fig. 1A). The n-3 intermediate timnodonic acid (20:5n3) was decreased, whereas docosapentaenoic acid (22:5n3) was increased. Docosahexaenoic acid (22:6n3), required for proper infant growth and neurodevelopment (Marszalek and Lodish, 2005), was decreased by TCDD.
Increased 20:2n6, 20:3n6, and 22:5n3 are consistent with Elovl5 induction (Angrish et al., 2011). Although lower 20:4n6 and 20:5n3 levels suggest decreased ∆5 desaturase activity (Guillou et al., 2010), its mRNA levels were unaffected by TCDD (data not shown). Decreases in n-3 and n-6 pathway product/precursor ratios (20:5n3/18:3n3 decreased 57% and 20:4n6/18:2n6 decreased 40%, Table 2) are possibly due to PUFA conversion into anti- and proinflammatory signaling molecules (Bui et al., 2012; Kraemer et al., 1996).
In contrast, TaFA, SFA, MUFA, and PUFA levels were unaffected by TCDD in serum and gWAT extracts. In serum, 16:0, 18:0, 18:1n9, 18:2n6, and 20:4n6 (Fig. 1C) were detected. These FAs are the predominant species in Harlan Teklad F6 rodent diet 7964 as well as lipoprotein glycerolipids, cholesteryl esters, and phospholipids (Vance and Vance, 2006). TCDD induced a 1.4-fold increase in the serum desaturation index corresponding with a modest decrease in 18:0 and increase in 18:1n9 (Table 2), which is associated with hyperlipidemia in humans (Attie et al., 2002). In gWAT extracts, TCDD only induced modest increases in 20:2n6 and 20:3n6 PUFA levels (Fig. 1B).
Alterations in Serum Lipids
A 20% decrease in total CHOL, LDL CHOL (decreased 30%), and HDL CHOL (decreased 20%) was detected in treated mice (Fig. 2A). Decreased LDL, a modification product of VLDL (Vance and Vance, 2006), suggests reduced VLDL secretion consistent with the 4.3-fold decrease in serum Apob100 protein levels (Figs. 2B and 2C). Apob100 is the major nonexchangeable lipoprotein found in VLDL and LDL particles produced by the liver. Apob48, a truncated form of Apob100, is the primary scaffold protein used for chylomicron assembly. It is expressed exclusively in the small intestine of most mammals (Vance and Vance, 2006), except in mice, which can also produce hepatic Apob48 following posttranscriptional editing (Higuchi et al., 1992). TCDD decreased serum Apob48 protein levels 2.8-fold (Figs. 2B and 2D). Serum-free FA, -free CHOL, TAG, and Apob mRNA levels were not affected by treatment in fasted mice (data not shown).
FIG. 2.

Serum CHOL and Apob100 and Apob48 levels in mice treated with 30 µg/kg TCDD or sesame oil vehicle. (A) Effect of TCDD on total CHOL, LDL, and HDL levels at 168h postdose. Serum lipids (n = 8) were measured by commercial assay (WAKO Diagnostics) and are presented as mg/dl. (B) Serum Apob100 and Apob48 protein levels detected by Western blot at 72h (n = 3). (C–D) Densitometry (determined with ImageJ) identified a TCDD-dependent 4.4- and 2.2-fold decrease in Apob100 (C) and Apob48 (D) band intensity, respectively. *p < 0.05 for TCDD compared with vehicle. Bars represent mean + SEM.
Differential Hepatic and Adipose Gene Expression by TCDD
To further examine the effect of TCDD on lipid metabolism, hepatic and gWAT gene expression was examined using QRTPCR. Similar to fed mice (Angrish et al., 2011), TCDD decreased hepatic Fasn mRNA levels −2.3-fold whose gene product controls the rate-limiting step in fatty acid synthesis (Fig. 3A). Similarly diacylglycerol acyltransferase (Dgat2), responsible for synthesizing TAGs from diacylglycerol and fatty acyl-CoA, decreased −2.8-fold in the livers of fasted, TCDD-treated mice (Fig. 3B). No effect in Mogat1-2 or Dgat1 mRNA levels were detected (not shown).
FIG. 3.

Differential expression of (A–E) hepatic CHOL metabolism genes and (F–J) gWAT lipid metabolism and transport genes in mice orally gavaged with 30 µg/kg TCDD or sesame oil vehicle for 24h. Total mRNA levels were normalized to the geometric mean of Hprt, Actb, and Gapdh. Genes are indicated by official gene symbols. *Represents p < 0.05 for TCDD compared with vehicle. Bars represent mean + SEM, n = 5 biological replicates.
Decreases in serum CHOL levels suggest TCDD alters hepatic CHOL transport and/or biosynthesis. QRTPCR analysis identified a 2.1- and 2.3-fold decrease in hepatic Hmgcs1 and Hmgcr (Figs. 3C and 3D) whose gene products catalyze the initial condensation and reduction reactions, respectively, in the CHOL biosynthetic pathway (Vance and Vance, 2006). Apolipoprotein A1 (Apoa1) is the primary HDL apolipoprotein expressed in the liver, and to a lesser extent in the intestine. Apoa1 is also a cofactor for lecithin cholesterolacyltransferase (Lcat), an enzyme that produces the bulk of plasma CHOL esters. TCDD decreased hepatic Apoa1 1.7-fold, whereas Lcat was increased 2-fold (Figs. 3E and 3F). The lipoprotein transporter Ldlr, involved in lipoprotein endocytosis and reverse CHOL transport, was increased 3.6-fold by TCDD (Fig. 3G). Increased Lcat and Ldlr expression are consistent with TCDD-mediated increases in hepatic CHOL levels (Forgacs et al., 2011), whereas decreased CHOL synthesis gene expression suggests feedback inhibition.
In addition to the minimal changes in gWAT lipid composition, TCDD altered the expression of several genes involved in FA metabolism and transport. In contrast to hepatic expression, TCDD increased Dgat1 mRNA levels 2.0-fold (Fig. 3H), whereas Fasn, Dgat2, and Mogat1-2 were not significantly altered. Slc27a1, a fatty acid transporter that translocates to the plasma membrane in response to insulin (Wu et al., 2006), was induced 7.5-fold, and triglyceride lipase Pnpla3 was repressed 2.4-fold (Figs. 3I and 3J). Interestingly, TCDD induced Adipoq 1.6-fold, whose gene product adiponectin exhibits hormonal regulation of lipid and glucose metabolism (Fig. 3K). Furthermore, TCDD induced Cyp1a1 mRNA levels (Fig. 3L), and Scd2, the predominant adipose Δ9 desaturase (Fig. 3M), consistent with AhR-mediated regulation of Δ9 desaturase activity (Angrish et al., 2011).
DISCUSSION
The current study integrates hepatic, serum, and adipose FA analyses along with serum lipid assessment to examine the systemic effects of acute TCDD exposure on FA metabolism in fasted mice. The results provide further evidence that dietary fat is the major source of lipids in TCDD-elicited steatosis (Angrish et al., forthcoming). More specifically, TCDD increases hepatic MUFA levels, consistent with AhR-mediated induction in Scd1 activity (Angrish et al., 2011) and dietary fat uptake (Angrish et al., forthcoming), and alters PUFA levels due to Elovl5, Cyp1a1, Cyp1a2, and Cyp1b1 induction (Bui et al., 2012; Wang et al., 2008). These changes were accompanied by altered serum lipid profiles, and are consistent with a systemic AhR-mediated response involving the digestive, circulatory, and hepatic systems resulting in TCDD-elicited steatosis.
TCDD-elicited peripheral fat mobilization has also been implicated in hepatic fatty acid accumulation (Albro et al., 1978; Lakshman et al., 1991; Pohjanvirta et al., 1990). Previous studies report that TCDD-dependent increases in serum 16:0, 18:1, 18:2, and 18:3 levels were due to adipose FA mobilization. However, these FAs are not only present in adipose tissue (Christie and Moore, 1970, 1972; Christie et al., 1971, 1972) but are also the predominant FAs in rodent chow (Angrish et al., 2012). In addition, the minimal effects of a single bolus dose of TCDD on gWAT FA levels and composition are consistent with dietary fat as the primary source of lipids for hepatic fat accumulation in these studies (Angrish et al., 2012).
Comparing lipid composition profiles in fasted and fed animals further supports dietary lipids as the source of fat in TCDD-elicited steatosis. In this study using fasted animals, total free FA and TAG levels in serum were not altered by TCDD. Yet, TCDD increased total free FA and TAG levels in the serum of fed mice (Boverhof et al., 2005, 2006; Gasiewicz and Neal, 1979; McConnell et al., 1978a,b), suggesting free access to chow is necessary for TCDD-elicited hyperlipidemia. In the fasted state, serum lipids also reflect lipid metabolic transformations (Boron and Boulpaep, 2008). Specifically, the 18:1n9/18:0 ratio, a functional measure of Scd1 activity, was induced in the liver and serum. Elevated 18:1n9/18:0 ratios are associated with hyperlipidemia in humans (Attie et al., 2002) suggesting the 18:1n9/18:0 serum ratio as a potential biomarker for hepatic steatosis.
Liver lipids are not only stored, but also packaged into lipoproteins for systemic delivery. TCDD-dependent decreases in serum Apob48 and Apob100, LDL, HDL, and CHOL suggest disrupted lipid transport. In humans, Apob48 and Apob100 are the primary apolipoproteins in intestinal chylomicron and hepatic VLDL particles, respectively. In contrast, mice also express hepatic Apob48 following posttranscriptional editing of Apob100 (Higuchi et al., 1992). Decreases in Apob48 and Apob100 as well as LDL levels (products of metabolic VLDL transformation) (Vance and Vance, 2006) in fasted mice, suggest TCDD inhibits hepatic lipid efflux, consistent with the absence of effects on hepatic Apob gene expression and reported TCDD-mediated decreases in serum VLDL secretion rates in fed mice (Lee et al., 2010).
TCDD-mediated reductions in serum lipoprotein content are concurrent with decreased serum CHOL and HDL levels. Although decreases in serum CHOL have been attributed to the inhibition of CHOL biosynthesis genes (Tanos et al., 2012), increased intracellular CHOL levels induced by TCDD (Forgacs et al., 2011) suggest that decreased Hmgcr and Hmgcs expression may be due to feedback inhibition. In addition, increased hepatic CHOL may initially stimulate bile acid production, consistent with the 1.7-fold induction of Cyp7a1 at 24h (Dere et al., 2011), the rate-limiting enzyme in bile acid synthesis. However, Cyp7a1 is repressed at later time points (2.0-fold repressed at 72–168h; Dere et al., 2011), further contributing to hepatic CHOL accumulation (Forgacs et al., 2011) and exacerbating hepatic steatosis.
The integration of gene expression and lipidomic studies in fed (Angrish et al., forthcoming) and fasted animals suggests TCDD-elicited hepatic steatosis involves a coordinated AhR-mediated response involving the digestive, circulatory, and hepatic systems. Potential lipid sources include the mobilization of fats stored in adipose tissue, de novo fatty acid synthesis, and serum fatty acids originating from endogenous and/or dietary sources. Although previous studies indicate that TCDD inhibits de novo fatty acid synthesis, β-oxidation, and VLDL secretion (Lakshman et al., 1988, 1989, 1991; Lee et al., 2010), they fail to specify the source(s) responsible for hepatic lipid accumulation. The negligible to minimal effects on gWAT and serum FA composition in fasted mice suggest that TCDD-elicited mobilization of peripheral fat is not a significant contributor in this study, further implicating dietary fat as the primary lipid source in TCDD-elicited hepatic steatosis following acute exposure in mice. However, additional studies are required to determine the role of ligand-, dose- and species-dependent effects on fat source utilization in AhR-mediated hepatic steatosis.
FUNDING
National Institute of Environmental Health Sciences Superfund Research Program (P42ES04911).
ACKNOWLEDGMENTS
We thank Dr Dan Jones for technical support and Dr Anna Kopec for critical review.
REFERENCES
- Alberti K. G., Eckel R. H., Grundy S. M., Zimmet P. Z., Cleeman J. I., Donato K. A., Fruchart J. C., James W. P., Loria C. M., Smith S. C., Jr., et al. (2009). Harmonizing the metabolic syndrome: A joint interim statement of the International Diabetes Federation Task Force on Epidemiology and Prevention; National Heart, Lung, and Blood Institute; American Heart Association; World Heart Federation; International Atherosclerosis Society; and International Association for the Study of Obesity. Circulation 120, 1640–1645. [DOI] [PubMed] [Google Scholar]
- Albro P. W., Corbett J. T., Harris M., Lawson L. D. (1978). Effects of 2,3,7,8-tetrachlorodibenzo-p-dioxin on lipid profiles in tissue of the Fischer rat. Chem. Biol. Interact. 23, 315–330. [DOI] [PubMed] [Google Scholar]
- Alexander D. L., Ganem L. G., Fernandez-Salguero P., Gonzalez F., Jefcoate C. R. (1998). Aryl-hydrocarbon receptor is an inhibitory regulator of lipid synthesis and of commitment to adipogenesis. J. Cell Sci. 111(Pt 22),3311–3322. [DOI] [PubMed] [Google Scholar]
- Alonso-Magdalena P., Ropero A. B., Carrera M. P., Cederroth C. R., Baquie M., Gauthier B. R., Nef S., Stefani E., Nadal A., et al. (2008). Pancreatic insulin content regulation by the estrogen receptor ER alpha. PLoS ONE 3, e2069. [DOI] [PMC free article] [PubMed] [Google Scholar]
- Angrish M. M., Jones A. D., Harkema J. R., Zacharewski T. R. (2011). Aryl hydrocarbon receptor-mediated induction of stearoyl-CoA desaturase 1 alters hepatic fatty acid composition in TCDD-elicited steatosis. Toxicol. Sci. 124, 299–310. [DOI] [PMC free article] [PubMed] [Google Scholar]
- Angrish M. M., Mets B. D., Jones A. D., Zacharewski T. R. (2012). Dietary fat is a lipid source in 2,3,7,8-tetrachlorodibenzo-rho-dioxin (TCDD)-elicited hepatic steatosis in C57BL/6 mice. Toxicol. Sci. 128, 377–386. [DOI] [PMC free article] [PubMed] [Google Scholar]
- Apelberg B. J., Witter F. R., Herbstman J. B., Calafat A. M., Halden R. U., Needham L. L., Goldman L. R., et al. (2007). Cord serum concentrations of perfluorooctane sulfonate (PFOS) and perfluorooctanoate (PFOA) in relation to weight and size at birth. Environ. Health Perspect. 115, 1670–1676. [DOI] [PMC free article] [PubMed] [Google Scholar]
- Attie A. D., Krauss R. M., Gray-Keller M. P., Brownlie A., Miyazaki M., Kastelein J. J., Lusis A. J., Stalenhoef A. F., Stoehr J. P., Hayden M. R., et al. (2002). Relationship between stearoyl-CoA desaturase activity and plasma triglycerides in human and mouse hypertriglyceridemia. J. Lipid Res. 43, 1899–1907. [DOI] [PubMed] [Google Scholar]
- Boron W., Boulpaep E. (2008). Medical Physiology. Saunders/Elsevier, Philadelphia, PA. [Google Scholar]
- Boverhof D. R., Burgoon L. D., Tashiro C., Chittim B., Harkema J. R., Jump D. B., Zacharewski T. R, et al. (2005). Temporal and dose-dependent hepatic gene expression patterns in mice provide new insights into TCDD-Mediated hepatotoxicity. Toxicol. Sci. 85, 1048–1063. [DOI] [PubMed] [Google Scholar]
- Boverhof D. R., Burgoon L. D., Tashiro C., Sharratt B., Chittim B., Harkema J. R., Mendrick D. L., Zacharewski T. R., et al. (2006). Comparative toxicogenomic analysis of the hepatotoxic effects of TCDD in Sprague Dawley rats and C57BL/6 mice. Toxicol. Sci. 94, 398–416. [DOI] [PubMed] [Google Scholar]
- Bui P., Solaimani P., Wu X., Hankinson O. (2012). 2,3,7,8-Tetrachlorodibenzo-p-dioxin treatment alters eicosanoid levels in several organs of the mouse in an aryl hydrocarbon receptor-dependent fashion. Toxicol. Appl. Pharmacol. 259, 143–151. [DOI] [PMC free article] [PubMed] [Google Scholar]
- Casals-Casas C., Desvergne B. (2011). Endocrine disruptors: From endocrine to metabolic disruption. Annu. Rev. Physiol. 73, 135–162. [DOI] [PubMed] [Google Scholar]
- Casals-Casas C., Feige J. N., Desvergne B. (2008). Interference of pollutants with PPARs: Endocrine disruption meets metabolism. Int. J. Obes. (Lond). 32(Suppl. 6),S53–S61. [DOI] [PubMed] [Google Scholar]
- Chen J. Q., Brown T. R., Russo J. (2009). Regulation of energy metabolism pathways by estrogens and estrogenic chemicals and potential implications in obesity associated with increased exposure to endocrine disruptors. Biochim. Biophys. Acta 1793, 1128–1143. [DOI] [PMC free article] [PubMed] [Google Scholar]
- Cheung O., Sanyal A. J. (2010). Recent advances in nonalcoholic fatty liver disease. Curr. Opin. Gastroenterol. 26, 202–208. [DOI] [PubMed] [Google Scholar]
- Christie W. W., Jenkinson D. M., Moore J. H. (1972). Variation in lipid composition through the skin and subcutaneous adipose tissue of pigs. J. Sci. Food Agric. 23, 1125–1129. [DOI] [PubMed] [Google Scholar]
- Christie W. W., Moore J. H. (1970). A comparison of the structures of triglycerides from various pig tissues. Biochim. Biophys. Acta 210, 46–56. [DOI] [PubMed] [Google Scholar]
- Christie W. W., Moore J. H. (1972). The structures of adipose tissue and heart muscle triglycerides in the domestic chicken (Gallus gallus). J. Sci. Food Agric. 23, 73–77. [DOI] [PubMed] [Google Scholar]
- Christie W. W., Moore J. H., Lorimer A. R., Lawrie T. D. (1971). The structures of triglycerides from atherosclerotic plaques and other human tissues. Lipids 6, 854–856. [DOI] [PubMed] [Google Scholar]
- Cimafranca M. A., Hanlon P. R., Jefcoate C. R. (2004). TCDD administration after the pro-adipogenic differentiation stimulus inhibits PPARgamma through a MEK-dependent process but less effectively suppresses adipogenesis. Toxicol. Appl. Pharmacol. 196, 156–168. [DOI] [PubMed] [Google Scholar]
- Denison M. S., Fisher J. M., Whitlock J. P., Jr (1988). Inducible, receptor-dependent protein-DNA interactions at a dioxin-responsive transcriptional enhancer. Proc. Natl. Acad. Sci. U.S.A. 85, 2528–2532. [DOI] [PMC free article] [PubMed] [Google Scholar]
- Denison M. S., Nagy S. R. (2003). Activation of the aryl hydrocarbon receptor by structurally diverse exogenous and endogenous chemicals. Annu. Rev. Pharmacol. Toxicol. 43, 309–334. [DOI] [PubMed] [Google Scholar]
- Dere E., Lo R., Celius T., Matthews J., Zacharewski T. R. (2011). Integration of genome-wide computation DRE search, AhR ChIP-chip and gene expression analyses of TCDD-elicited responses in the mouse liver. BMC Genomics 12, 365. [DOI] [PMC free article] [PubMed] [Google Scholar]
- Donnelly K. L., Smith C. I., Schwarzenberg S. J., Jessurun J., Boldt M. D., Parks E. J. (2005). Sources of fatty acids stored in liver and secreted via lipoproteins in patients with nonalcoholic fatty liver disease. J. Clin. Invest. 115, 1343–1351. [DOI] [PMC free article] [PubMed] [Google Scholar]
- Ford E. S., Li C., Zhao G. (2010). Prevalence and correlates of metabolic syndrome based on a harmonious definition among adults in the US. J. Diabetes 2, 180–193. [DOI] [PubMed] [Google Scholar]
- Forgacs A. L., Kent M. N., Makley M. K., Mets B., Delraso N., Jahns G. L., Burgoon L. D., Reo N. V., Zacharewski T. R., et al. (2011). Comparative metabolomic and genomic analyses of TCDD-elicited metabolic disruption in mouse and rat liver. Toxicol. Sci. 125, 41–55. [DOI] [PMC free article] [PubMed] [Google Scholar]
- Gasiewicz T. A., Neal R. A. (1979). 2,3,7,8-Tetrachlorodibenzo-p-dioxin tissue distribution, excretion, and effects on clinical chemical parameters in guinea pigs. Toxicol. Appl. Pharmacol. 51, 329–339. [DOI] [PubMed] [Google Scholar]
- Grun F., Blumberg B. (2009a). Endocrine disrupters as obesogens. Mol. Cell Endocrinol. 304, 19–29. [DOI] [PMC free article] [PubMed] [Google Scholar]
- Grun F., Blumberg B. (2009b). Minireview: The case for obesogens. Mol. Endocrinol. 23, 1127–1134. [DOI] [PMC free article] [PubMed] [Google Scholar]
- Guillou H., Zadravec D., Martin P. G., Jacobsson A. (2010). The key roles of elongases and desaturases in mammalian fatty acid metabolism: Insights from transgenic mice. Prog. Lipid Res. 49, 186–199. [DOI] [PubMed] [Google Scholar]
- Hankinson O. (1995). The aryl hydrocarbon receptor complex. Annu. Rev. Pharmacol. Toxicol. 35, 307–340. [DOI] [PubMed] [Google Scholar]
- Hatch E. E., Nelson J. W., Stahlhut R. W., Webster T. F. (2010). Association of endocrine disruptors and obesity: Perspectives from epidemiological studies. Int. J. Androl. 33, 324–332. [DOI] [PMC free article] [PubMed] [Google Scholar]
- Higuchi K., Kitagawa K., Kogishi K., Takeda T. (1992). Developmental and age-related changes in apolipoprotein B mRNA editing in mice. J. Lipid Res. 33, 1753–1764. [PubMed] [Google Scholar]
- Kang H. K., Dalager N. A., Needham L. L., Patterson D. G., Jr, Lees P. S., Yates K., Matanoski G. M., et al. (2006). Health status of Army Chemical Corps Vietnam veterans who sprayed defoliant in Vietnam. Am. J. Ind. Med. 49, 875–884. [DOI] [PubMed] [Google Scholar]
- Kern P. A., Said S., Jackson W. G., Jr, Michalek J. E. (2004). Insulin sensitivity following agent orange exposure in Vietnam veterans with high blood levels of 2,3,7,8-tetrachlorodibenzo-p-dioxin. J. Clin. Endocrinol. Metab. 89, 4665–4672. [DOI] [PubMed] [Google Scholar]
- Kopec A. K., Boverhof D. R., Burgoon L. D., et al. (2008). Comparative toxicogenomic examination of the hepatic effects of PCB126 and TCDD in immature, ovariectomized C57BL/6 mice. Toxicol. Sci. 102, 61–75. [DOI] [PubMed] [Google Scholar]
- Kraemer S. A., Arthur K. A., Denison M. S., Smith W. L., DeWitt D. L. (1996). Regulation of prostaglandin endoperoxide H synthase-2 expression by 2,3,7,8,-tetrachlorodibenzo-p-dioxin. Arch. Biochem. Biophys. 330, 319–328. [DOI] [PubMed] [Google Scholar]
- Lakshman M. R., Campbell B. S., Chirtel S. J., Ekarohita N. (1988). Effects of 2,3,7,8-tetrachlorodibenzo-p-dioxin (TCDD) on de novo fatty acid and cholesterol synthesis in the rat. Lipids 23, 904–906. [DOI] [PubMed] [Google Scholar]
- Lakshman M. R., Chirtel S. J., Chambers L. L., Coutlakis P. J. (1989). Effects of 2,3,7,8-tetrachlorodibenzo-p-dioxin on lipid synthesis and lipogenic enzymes in the rat. J. Pharmacol. Exp. Ther. 248, 62–66. [PubMed] [Google Scholar]
- Lakshman M. R., Ghosh P., Chirtel S. J. (1991). Mechanism of action of 2,3,7,8-tetrachlorodibenzo-p-dioxin on intermediary metabolism in the rat. J. Pharmacol. Exp. Ther. 258, 317–319. [PubMed] [Google Scholar]
- Lee J. H., Wada T., Febbraio M., He J., Matsubara T., Lee M. J., Gonzalez F. J., Xie W., et al. (2010). A novel role for the dioxin receptor in fatty acid metabolism and hepatic steatosis. Gastroenterology 139, 653–663. [DOI] [PMC free article] [PubMed] [Google Scholar]
- Marszalek J. R., Lodish H. F. (2005). Docosahexaenoic acid, fatty acid-interacting proteins, and neuronal function: Breastmilk and fish are good for you. Annu. Rev. Cell Dev. Biol. 21, 633–657. [DOI] [PubMed] [Google Scholar]
- McConnell E. E., Moore J. A., Dalgard D. W. (1978a). Toxicity of 2,3,7,8-tetrachlorodibenzo-p-dioxin in rhesus monkeys (Macaca mulatta) following a single oral dose. Toxicol. Appl. Pharmacol. 43, 175–187. [DOI] [PubMed] [Google Scholar]
- McConnell E. E., Moore J. A., Haseman J. K., Harris M. W. (1978b). The comparative toxicity of chlorinated dibenzo-p-dioxins in mice and guinea pigs. Toxicol. Appl. Pharmacol. 44, 335–356. [DOI] [PubMed] [Google Scholar]
- Nguyen L. P., Bradfield C. A. (2008). The search for endogenous activators of the aryl hydrocarbon receptor. Chem. Res. Toxicol. 21, 102–116. [DOI] [PMC free article] [PubMed] [Google Scholar]
- Olufadi R., Byrne C. D. (2008). Clinical and laboratory diagnosis of the metabolic syndrome. J. Clin. Pathol. 61, 697–706. [DOI] [PubMed] [Google Scholar]
- Park S. K., Son H. K., Lee S. K., Kang J. H., Chang Y. S., Jacobs D. R., Lee D. H. (2010). Relationship between serum concentrations of organochlorine pesticides and metabolic syndrome among non-diabetic adults. J. Prev. Med. Public Health 43, 1–8. [DOI] [PubMed] [Google Scholar]
- Pelclova D., Fenclova Z., Preiss J., Prochazka B., Spacil J., Dubska Z., Okrouhlik B., Lukas E., Urban P., et al. (2002). Lipid metabolism and neuropsychological follow-up study of workers exposed to 2,3,7,8- tetrachlordibenzo-p-dioxin. Int. Arch. Occup. Environ. Health 75 Suppl.),S60–S66. [DOI] [PubMed] [Google Scholar]
- Pelclova D., Fenclova Z., Urban P., Ridzon P., Preiss J., Kupka K., Malik J., Dubska Z., Navratil T., et al. (2009). Chronic health impairment due to 2,3,7,8-tetrachloro-dibenzo-p-dioxin exposure. Neuro Endocrinol. Lett. 30(Suppl. 1),219–224. [PubMed] [Google Scholar]
- Pohjanvirta R., Sankari S., Kulju T., Naukkarinen A., Ylinen M., Tuomisto J. (1990). Studies on the role of lipid peroxidation in the acute toxicity of TCDD in rats. Pharmacol. Toxicol. 66, 399–408. [DOI] [PubMed] [Google Scholar]
- Pollenz R. S., Sattler C. A., Poland A. (1994). The aryl hydrocarbon receptor and aryl hydrocarbon receptor nuclear translocator protein show distinct subcellular localizations in Hepa 1c1c7 cells by immunofluorescence microscopy. Mol. Pharmacol. 45, 428–438. [PubMed] [Google Scholar]
- Rubin M. M. (2007). Antenatal exposure to DES: Lessons learned...future concerns. Obstet. Gynecol. Surv. 62, 548–555. [DOI] [PubMed] [Google Scholar]
- Shimba S., Todoroki K., Aoyagi T., Tezuka M. (1998). Depletion of arylhydrocarbon receptor during adipose differentiation in 3T3-L1 cells. Biochem. Biophys. Res. Commun. 249, 131–137. [DOI] [PubMed] [Google Scholar]
- Smink A., Ribas-Fito N., Garcia R., Torrent M., Mendez M. A., Grimalt J. O., Sunyer J., et al. (2008). Exposure to hexachlorobenzene during pregnancy increases the risk of overweight in children aged 6 years. Acta Paediatr. 97, 1465–1469. [DOI] [PubMed] [Google Scholar]
- Stahlhut R. W., van Wijngaarden E., Dye T. D., Cook S., Swan S. H. (2007). Concentrations of urinary phthalate metabolites are associated with increased waist circumference and insulin resistance in adult U.S. males. Environ. Health Perspect. 115, 876–882. [DOI] [PMC free article] [PubMed] [Google Scholar]
- Swedenborg E., Ruegg J., Makela S., Pongratz I. (2009). Endocrine disruptive chemicals: Mechanisms of action and involvement in metabolic disorders. J. Mol. Endocrinol. 43, 1–10. [DOI] [PubMed] [Google Scholar]
- Tanos R., Patel R. D., Murray I. A., Smith P. B., Patterson A. D., Perdew G. H. (2012). Ah receptor regulates the cholesterol biosynthetic pathway in a dioxin response element-independent manner. Hepatology. 55, 1994–2004. [DOI] [PMC free article] [PubMed] [Google Scholar]
- Trauner M., Arrese M., Wagner M. (2010). Fatty liver and lipotoxicity. Biochim. Biophys. Acta 1801, 299–310. [DOI] [PubMed] [Google Scholar]
- Turyk M., Anderson H., Knobeloch L., Imm P., Persky V. (2009). Organochlorine exposure and incidence of diabetes in a cohort of Great Lakes sport fish consumers. Environ. Health Perspect. 117, 1076–1082. [DOI] [PMC free article] [PubMed] [Google Scholar]
- Unger R. H. (2003). Lipid overload and overflow: Metabolic trauma and the metabolic syndrome. Trends Endocrinol. Metab. 14, 398–403. [DOI] [PubMed] [Google Scholar]
- Unger R. H., Zhou Y. T. (2001). Lipotoxicity of beta-cells in obesity and in other causes of fatty acid spillover. Diabetes 50,(Suppl. 1)S118–S121. [DOI] [PubMed] [Google Scholar]
- Vance D. E., Vance J. E. Biochemistry of Lipids, Lipoproteins and Membranes. 4th ed. Elsevier, Amsterdam, The Netherlands; (2006). [Google Scholar]
- Vandesompele J., De Preter K., Pattyn F., Poppe B., Van Roy N., De Paepe A., Speleman F. (2002). Accurate normalization of real-time quantitative RT-PCR data by geometric averaging of multiple internal control genes. Genome Biol. 3, 34. [DOI] [PMC free article] [PubMed] [Google Scholar]
- Vanni E., Bugianesi E., Kotronen A., De Minicis S., Yki-Jarvinen H., Svegliati-Baroni G. (2010). From the metabolic syndrome to NAFLD or vice versa?. Dig. Liver Dis. 42, 320–330. [DOI] [PubMed] [Google Scholar]
- Wang Y., Torres-Gonzalez M., Tripathy S., Botolin D., Christian B., Jump D. B. (2008). Elevated hepatic fatty acid elongase-5 activity affects multiple pathways controlling hepatic lipid and carbohydrate composition. J. Lipid Res. 49, 1538–1552. [DOI] [PMC free article] [PubMed] [Google Scholar]
- Wu Q., Ortegon A. M., Tsang B., Doege H., Feingold K. R., Stahl A. (2006). FATP1 is an insulin-sensitive fatty acid transporter involved in diet-induced obesity. Mol. Cell Biol. 26, 3455–3467. [DOI] [PMC free article] [PubMed] [Google Scholar]
- Yao E. F., Denison M. S. (1992). DNA sequence determinants for binding of transformed Ah receptor to a dioxin-responsive enhancer. Biochemistry 31, 5060–5067. [DOI] [PubMed] [Google Scholar]
- Yashodhara B. M., Umakanth S., Pappachan J. M., Bhat S. K., Kamath R., Choo B. H. (2009). Omega-3 fatty acids: A comprehensive review of their role in health and disease. Postgrad. Med. J. 85, 84–90. [DOI] [PubMed] [Google Scholar]