Abstract
In the rat, p53 promotes tubular apoptosis after ischemic AKI. Acute pharmacologic inhibition of p53 is protective in this setting, but chronic inhibition enhances fibrosis, demonstrating that the role of p53 in ischemic AKI is incompletely understood. Here, we investigated whether genetic absence of p53 is also protective in ischemic AKI. Surprisingly, p53-knockout mice (p53−/−) had worse kidney injury, compared with wild-type mice, and exhibited increased and prolonged infiltration of leukocytes after ischemia. Acute inhibition of p53 with pifithrin-α in wild-type mice mimicked the observations in p53−/− mice. Chimeric mice that lacked p53 in leukocytes sustained injury similar to p53−/− mice, suggesting an important role for leukocyte p53 in ischemic AKI. Compared with wild-type mice, a smaller proportion of macrophages in the kidneys of p53−/− and pifithrin-α–treated mice after ischemic injury were the anti-inflammatory M2 phenotype. Ischemic kidneys of p53−/− and pifithrin-α–treated mice also showed reduced expression of Kruppel-like factor-4. Finally, models of peritonitis in p53−/− and pifithrin-α–treated mice confirmed the anti-inflammatory role of p53 and its effect on the polarization of macrophage phenotype. In summary, in contrast to the rat, inflammation characterizes ischemic AKI in mice; leukocyte p53 is protective by reducing the extent and duration of this inflammation and by promoting the anti-inflammatory M2 macrophage phenotype.
Human AKI is a grave clinical condition frequently seen in the setting of nephrotoxic insults, sepsis, and hemodynamic compromise. Despite decades of clinical and laboratory studies, there are no established therapeutic modalities that are known to alter the course of AKI. Consequently, treatment for AKI to date is supportive and focused on the maintenance of body homeostasis through the control of fluids and electrolytes with modalities as aggressive as dialysis.1,2 In addition, human AKI unfortunately carries significant morbidity and mortality and can frequently result in long-term loss of function, especially when superimposed on preexisting kidney disease.3–5
Renal artery or pedicle clamp models of ischemia-reperfusion injury (IRI) in mice and rats have primarily been utilized to study the pathophysiologic pathways involved in ischemic AKI. The emerging picture of this pathophysiology is that of a complex and often interrelated array of signaling events triggered primarily by hypoxia, reactive oxygen and nitrogen species, and nucleotide depletion. These triggering events in turn can activate or suppress a myriad of secondary effectors such as transcription factors, chemokines, and cytokines.1 The ultimate result is tubular cell death in the form of apoptosis and necrosis, endothelial alterations, and infiltration of inflammatory cells. The final phenotype of AKI is likely dependent on the particular injury model used and possibly the animal species under investigation.
The tumor suppressor p53 has emerged as an important player in various forms of AKI.6–11 This transcription factor primarily responds to cellular stress and DNA damage by halting the cell cycle and by promoting apoptosis in extreme cases of cell stress.12,13 Whereas the primary role of p53 activation is to safeguard the genome and prevent malignant transformation, its role in AKI is less straightforward and can be detrimental inasmuch as it can trigger cell death in sublethally injured tubular cells. Indeed, we previously showed that inhibition of p53 with pifithrin-α or small interfering RNA in rat models of ischemic AKI reduces tubular apoptosis and conveys significant functional protection.8,14 This protection entailed interference with both transcriptional and transcription-independent effects of p53 and occurred despite the persistence of moderate inflammation. These studies underscore the importance of tubular apoptosis in rat kidney IRI as a primary process leading to AKI. However, and contrary to expectations, the acute kidney protective effects of p53 inhibition did not translate into long-term protection. In fact, the prolonged administration of pifithrin-α led to increased kidney fibrosis at 4–8 weeks after ischemic injury to the rat kidney.9
In this article, we examine the effects of the genetic absence of p53 in a mouse model of ischemic AKI to further explore the role of p53 in ischemic kidney injury. Surprisingly, p53−/− mice sustained more severe histologic and functional injury after IRI. Furthermore, inhibition of p53 with pifithrin-α in the mouse mimicked the effects of the genetic absence of p53. We utilized bone marrow transplantation to produce chimeric mice lacking p53 in leukocytes, as well as phenotype analysis of macrophages to demonstrate that, contrary to our findings in rats, inflammation plays a central role in mouse ischemic AKI and that p53 activation acts to mitigate this inflammatory response. These studies underscore the importance of better characterizing human ischemic AKI and determining whether it is better modeled in the rat or the mouse.
Results
Absence or Inhibition of p53 Results in Worse Functional Injury after Mouse Kidney IRI
Baseline serum creatinine was identical between background control (WT) and p53−/− mice. Twenty-four hours after IRI, untreated WT mice sustained a 2.5-fold increase in serum creatinine. In contrast, pifithrin-α–treated WT and p53−/− mice exhibited between a 5-fold and 6-fold increase in creatinine compared with controls (Figure 1A). Whereas all groups showed some functional recovery with time, serum creatinine of p53−/− mice remained significantly elevated 1 week after IRI. (Figure 1, B and C). We also note that pifithrin-α had no effect on serum creatinine of p53−/− mice before or after IRI (data not shown).
Figure 1.
Effect of p53 absence or inhibition on serum creatinine after kidney IRI. Serum creatinines are shown for sham mice (WT mice treated with vehicle control and p53−/− mice at baseline are combined as there was no difference) and mice after IRI either treated with vehicle control (WT) or pifithrin-α, as well as p53−/− mice after IRI at 24 hours (A), 1 week (B), and 2 weeks (C). n=5 for all groups. I/R, ischemia-reperfusion injury; pif, pifithrin-α.
Absence or Inhibition of p53 Causes More Severe Morphologic Damage after Kidney IRI
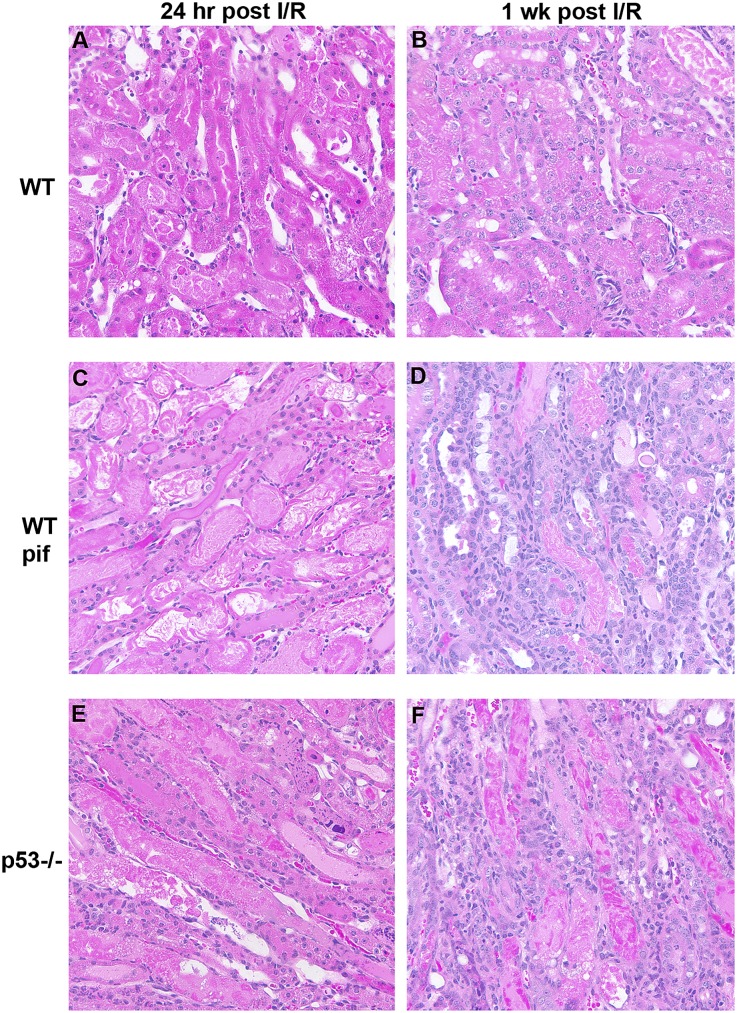
Twenty-four hours after IRI, p53−/− and pifithrin-α–treated WT showed more severe morphologic damage compared with untreated WT mice. In particular, indices of tubular necrosis and cast formation were all more prominent in the pifithrin-α and p53−/− groups (Figure 2, A, C, and E). One week after IRI, pifithrin-α–treated and p53−/− mice showed less morphologic recovery compared with untreated WT and exhibited markedly increased cellular infiltration (Figure 2, B, D, and F).
Figure 2.
Effect of p53 absence or inhibition on kidney morphology after IRI. Representative hematoxylin and eosin staining is shown for WT mice treated with vehicle control (A and B) or pifithrin-α (C and D), as well as p53−/− mice (E and F) after IRI at time points indicated. Tubular necrosis is increased in p53−/− (49%±6%; P=0.01) and WT mice treated with pifithrin-α (49%±9%; P=0.03) compared with vehicle control-treated WT mice (29%±6%). In addition, tubular cast formation is increased in p53−/− (26%±3%; P=0.001) and WT mice treated with pifithrin-α (27%±14%; P=0.07) compared with vehicle control-treated WT mice (7%±3%). I/R, ischemia-reperfusion injury; pif, pifithrin-α.
Absence or Inhibition of p53 Causes Increased Inflammatory Cell Infiltration after Kidney IRI
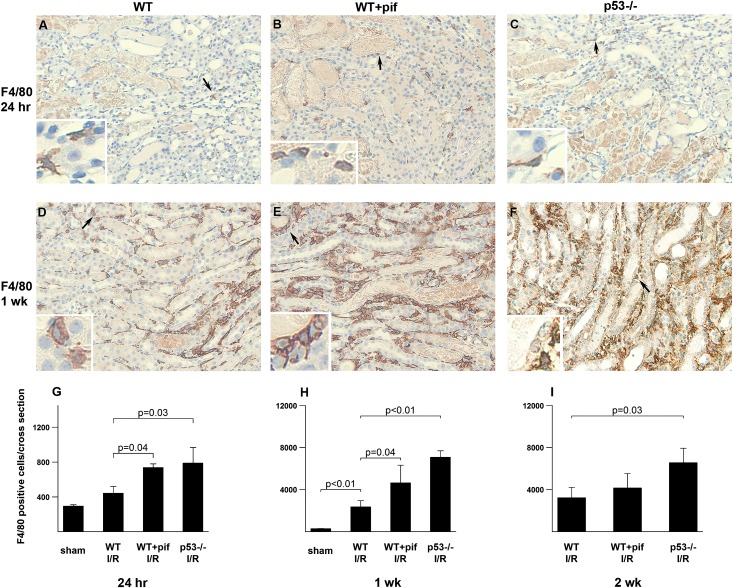
Twenty-four hours after kidney IRI, p53−/− and pifithrin-α–treated mice showed a 1.5-fold to 2-fold increase in leukocyte esterase-positive cells infiltrating the kidney compared with untreated WT (Figure 3, A–C). These are predominantly neutrophils as shown by Gr-1 staining (Figure 3, D–F). Whereas the number of leukocyte esterase-positive cells decreased in all groups at 1 and 2 weeks after IRI, the number remained higher in the p53−/− and pifithrin-α–treated mice compared with untreated WT (Figure 3, G–I). We also stained for F4/80, a marker of macrophages. All groups had an increase in F4/80-positive cells starting at 24 hours and up to 2 weeks after IRI. At all time points, p53−/− and pifithrin-α–treated animals had significantly higher numbers of F4/80-positive cells compared with untreated WT (Figure 4). This was further confirmed with FACS analysis (Supplemental Figure 1). We note that pifithrin-α had no effect on neutrophil and macrophage numbers in p53−/− mice (data not shown).
Figure 3.
Effect of p53 absence or inhibition on neutrophil infiltration after kidney IRI. Representative leukocyte esterase staining (pink, arrowheads) and Gr-1 staining (brown, arrows) are shown for WT mice treated with vehicle control (A and D) or pifithrin-α (B and E), as well as p53−/− mice (C and F) after 24 hours of IRI. Arrowheads indicate magnified areas in the insets of each panel. (G–I) Quantitation of esterase-positive cells per total cross-sectional area in kidneys from the different groups after IRI at the indicated time points. Note the y-axis scale difference at various time points. n=4 per group per time point. I/R, ischemia-reperfusion injury; pif, pifithrin-α.
Figure 4.
Effect of p53 absence or inhibition on macrophage infiltration after kidney IRI. Representative images of F4/80 staining (brown) are shown for WT mice treated with vehicle control (A and D) or pifithrin-α (B and E), as well as p53−/− mice (C and F) after IRI at the indicated time points. Hematoxylin (blue) is used as a counterstain. Arrows indicate magnified areas in the insets of each panel. (G–I) Quantitation of F4/80-positive cells per total cross-sectional area in kidneys at the indicated time points. Note the y-axis scale difference at various time points. n=4 per group per time point. I/R, ischemia-reperfusion injury.
Kidney Injury Correlates Best with the Functional Status of p53 in Leukocytes
We next investigated the relative importance of p53 in inflammatory cells versus renal tubular cells in determining the functional injury after IRI. To this end, we created chimeric mice by transplanting p53−/− bone marrow into irradiated WT mice (p53−/−/WT). The degree of chimerism exceeded 90% after 8 weeks. The p53−/−/WT chimera showed a 2-fold higher creatinine after IRI compared with WT/WT chimera (Figure 5). In fact, the increase in serum creatinine of the p53−/−/WT chimera was comparable with that of the total p53−/− (compare with Figure 1A). These data suggest that p53 absence from inflammatory cells is sufficient to explain the increased inflammation and injury observed in the p53−/− mice. The reverse chimera, in which bone marrow from WT mice was transplanted into p53−/− mice, was not successful, achieving <50% chimerism at 8 weeks. This was because p53−/− mice were resistant to irradiation-induced bone marrow cell death, a process highly dependent on active p53 (Supplemental Figure 2).
Figure 5.
Serum creatinine in WT/WT and p53−/−/WT bone morrow chimera mice after kidney IRI. Bone marrow cells from WT or p53−/− mice are transferred to irradiated WT recipient mice. The chimera mice are subjected to kidney IRI 8–10 weeks after the transfer procedure. Serum creatinine 24 hours after IRI is shown. n=4 per group. I/R, ischemia-reperfusion injury; pif, pifithrin-α.
Absence or Inhibition of p53 Influences Cytokine Production and Leukocyte Apoptosis
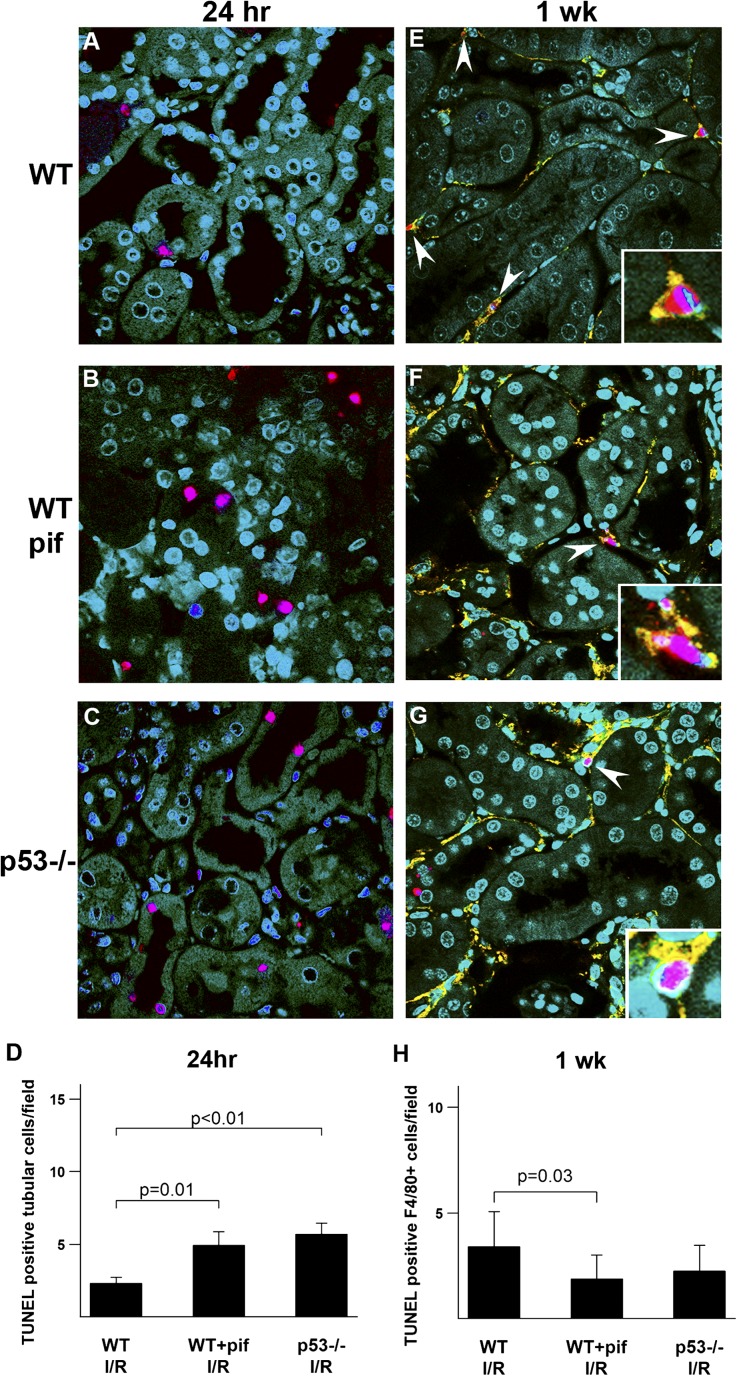
To further examine the effect of inhibition or absence of p53 on the inflammatory response, we examined cytokine and chemokine production 24 hours after kidney IRI. Representative cytokines and chemokines were all significantly elevated in pifithrin-α–treated and p53−/− mice (Supplemental Figure 3). To further investigate the mechanism of increased leukocyte infiltration in pifithrin-α–treated and p53−/− mice after IRI, we examined leukocyte apoptosis. Twenty-four hours after IRI, leukocyte apoptosis was minimal and there was no difference between control, pifithrin-α–treated, and p53−/− mice (Supplemental Figure 4). Therefore, decreased leukocyte apoptosis does not account for the early increase in infiltrating leukocytes observed in the pifithrin-α–treated and p53−/− mice. This early increase in leukocytes could be explained by an increased influx due to the augmented chemokine response that we observed. In contrast, 1 week after IRI, leukocyte apoptosis was readily observed and localized primarily to infiltrating F4/80-positive cells in all groups. Importantly, pifithrin-α–treated and p53−/− mice had a lower terminal deoxynucleotidyl transferase–mediated digoxigenin-deoxyuridine nick-end labeling (TUNEL) index (normalized to the number of infiltrating leukocytes) compared with untreated WT (Figure 6, E–H and Supplemental Figure 4). Consequently, the absence or inhibition of p53 from leukocytes can reduce leukocyte apoptosis, thus ultimately increasing and prolonging the inflammatory response.
Figure 6.
Effect of p53 absence or inhibition on tubular and inflammatory cell apoptosis after kidney IRI. Representative images of TUNEL staining (red) are shown for WT mice treated with vehicle control (A and E) or pifithrin-α (B and F), as well as p53−/− mice (C and G) after IRI at the indicated time points. At 1 week, the TUNEL is colabeled with anti-F4/80 antibody (yellow). DAPI (blue) is used as a counterstain, and green represents tubular autofluorescence. (A–C) Twenty-four hours after IRI, TUNEL staining localizes predominantly to tubular cells. (D) Quantitation of TUNEL-positive cells at 24 hours. (E–G) One week after IRI, TUNEL staining is readily detected in F4/80-positive cells (arrowheads). (H) Pifithrin-α–treated and p53−/− mice have a 2-fold to 3-fold increase in the number of infiltrating F4/80-positive cells and the TUNEL number per field is normalized to the number of infiltrating cells, thus yielding a TUNEL index that can be used to compare groups. n=4 per group per time point. DAPI, 4',6-diamidino-2-phenylindole; I/R, ischemia-reperfusion injury; pif, pifithrin-α.
Absence or Inhibition of p53 Paradoxically Results in Increased Tubular Cell Apoptosis
On the basis of our previous observations in the rat,8,14 the inhibition of p53 is expected to protect tubular cells from apoptosis. Twenty-four hours after IRI, apoptosis (TUNEL-positive stain) was almost entirely observed in tubular cells in all experimental groups. Surprisingly, more tubular cell apoptosis was observed in p53−/− and pifithrin-α–treated mice compared with untreated WT (Figure 6, A–D). This is likely secondary to p53-independent cell death, which can proceed via the extrinsic apoptotic pathway. This pathway can be driven by proinflammatory cytokines. Indeed, as discussed above, proinflammatory cytokines were increased in the pifithrin-treated and p53−/− mouse (Supplemental Figure 3). Increased tubular apoptosis was persistent up to 1 week after IRI, especially in the p53−/− mouse (data not shown).
Absence or Inhibition of p53 Alters Macrophage Phenotype after Kidney IRI
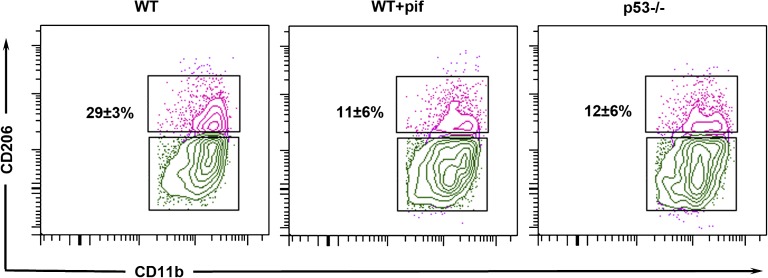
The dramatic increase in the number of infiltrating inflammatory cells prompted us to examine whether p53 also had an effect on kidney macrophage phenotype, specifically the polarization favoring proinflammatory M1 versus anti-inflammatory M2 subtypes. One week after IRI, 29%±3% of macrophages from untreated WT mice exhibited the noninflammatory M2 phenotype. In contrast, kidney macrophages from pifithrin-α–treated and p53−/− mice had significantly fewer M2 macrophages (11%±6% and 12%±6% M2, respectively; P<0.05 versus WT IRI) (Figure 7). Baseline M2 macrophage population of WT and p53−/− mice under the sham condition was comparable (14%±6%). The gating strategy used to analyze macrophage phenotype is shown in Supplemental Figure 5. We also examined other leukocyte profiles in the kidney including CD4+ T, CD8+ T, B, and natural killer (NK) cells. Although NK cells tended to be lower in p53−/− mice, there was no statistical difference between the groups with respect to other infiltrating inflammatory cell (Supplemental Figure 6). Due to significant overlap among conventional dendritic cell and macrophage markers on the kidney leukocytes,15,16 we were unable to resolve dendritic cells by cell surface markers (Supplemental Figure 7).
Figure 7.
Effect of p53 absence or inhibition on kidney macrophage phenotype after IRI. Analysis by flow cytometry of CD11b+F4/80+ macrophages isolated from WT mice treated with vehicle control (WT) or pifithrin-α (WT+pif), as well as p53−/− mice 1 week after IRI. CD206 (mannose receptor 1) is a marker of M2 macrophage phenotype, thus indicated percentages are the M2 phenotype population. n=4 per group. P<0.05 for WT versus WT+pif or p53−/− mice. I/R, ischemia-reperfusion injury; pif, pifithrin-α.
Absence or Inhibition of p53 Alters Kruppel-Like Factor-4 Expression in Renal Tubules and Infiltrating Macrophages
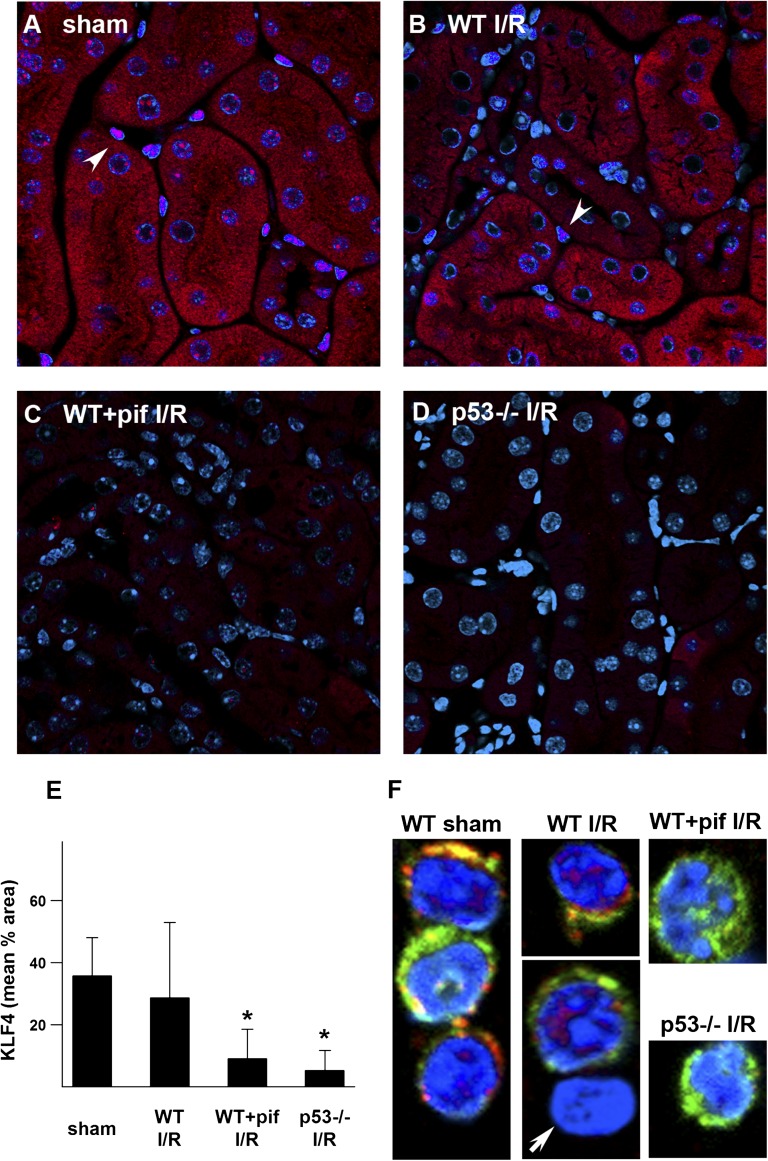
The observation that p53 can influence macrophage polarization is novel and its mechanism is unknown. Kruppel-like factor-4 (KLF4) is an important transcriptional regulator of cell differentiation and was recently shown to affect macrophage polarization.17–19 KLF4 is also known to interact with p53.20 We therefore examined whether KLF4 could mediate in part the effects of p53. In WT and p53−/− sham kidney tissues, there was a robust cytoplasmic and nuclear signal in tubular cells, as well as a strong nuclear signal in interstitial cells (Figure 8A and Supplemental Figure 8). One week after IRI, kidneys from WT mice still showed strong KLF4 staining (Figure 8B). In contrast, KLF4 expression was significantly reduced in pifithrin-α–treated and p53−/− mice (Figure 8, C and D). Similarly, in macrophages isolated from the kidneys of WT mice under the sham condition or 1 week after IRI, KLF4 localized both to the cytoplasm and nucleus. In contrast, KLF4 could not be detected in renal macrophages isolated from pifithrin-α–treated and p53−/− mice (Figure 8F).
Figure 8.
KLF4 expression after kidney IRI. Representative images of KLF4 staining (red; DAPI, blue) are shown for WT mice treated with vehicle control (A and B) or pifithrin-α (C), as well as p53−/− mice (D) under indicated conditions. Arrowheads indicate nuclear KLF4 stain in interstitial cells. (E) Quantitation of tissue KLF4 staining. *P<0.05 versus sham or WT IRI. (F) F4/80+CD11b+ macrophages enriched from kidneys of mice under sham condition or 1 week after IRI are stained for KLF4 (red), CD11b (green), and DAPI (blue). Arrow indicates CD11b negative cell (nonmacrophage) that also lacks KLF4 staining. DAPI, 4',6-diamidino-2-phenylindole; I/R, ischemia-reperfusion injury; pif, pifithrin-α.
Absence or Inhibition of p53 Potentiates Inflammation in Mouse Models of Peritonitis
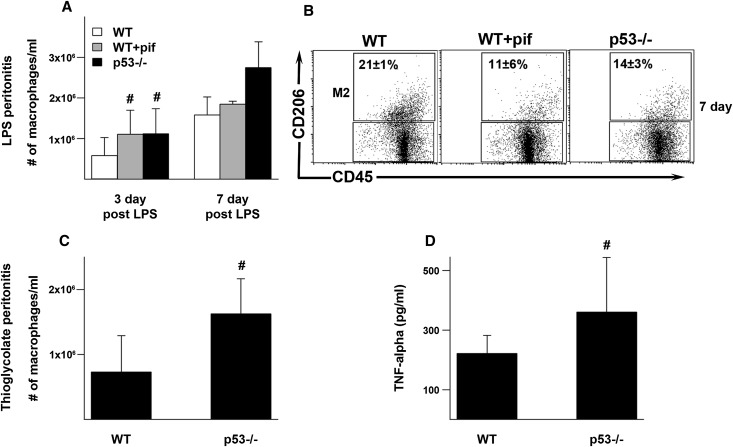
To determine whether p53 can also have anti-inflammatory roles in other conditions, we examined models of endotoxin and chemical (sodium thioglycolate) peritonitis in the mouse. In endotoxin-induced peritonitis, there was a significantly greater accumulation of peritoneal macrophages in the pifithrin-α–treated and p53−/− mice compared with WT. Furthermore, macrophages from pifithrin-α–treated and p53−/− mice had significantly less M2 polarization compared with WT (11%±6% and 14%±3%, respectively, versus 21%±1%; P<0.05) (sham animals, 15%±4%) (Figure 9, A and B). These findings are similar to those observed in the ischemic kidney. In the thioglycolate model, there was also a greater accumulation of peritoneal macrophages in p53−/− mice compared with WT mice (Figure 9C). Furthermore, peritoneal macrophages collected from thioglycolate-stimulated p53−/− mice secreted more TNF-α after in vitro exposure to endotoxin compared with WT (Figure 9D). The effects of pifithrin-α could not be examined in the thioglycolate model possibly due to chemical-physical interactions between pifithrin-α and thioglycolate in the peritoneal cavity.
Figure 9.
Effect of p53 on the inflammatory response in models of endotoxin and chemical peritonitis. WT, pifithrin-α–treated WT, and p53−/− mice are intraperitoneally injected with endotoxin. (A) Macrophages were collected and counted in peritoneal fluid 3 or 7 days after endotoxin injection. (B) F4/80+CD45+ macrophages collected 7 days after endotoxin injection were also studied by flow cytometry. Percentages indicated are M2 phenotype (CD206+). n=3 per group. P<0.05 for WT versus WT+pif or p53−/−. (C) WT and p53−/− mice are also treated with intraperitoneal thioglycolate and macrophages counted in peritoneal fluid 3 days after injection. (D) Harvested macrophages are stimulated with 100 ng/ml of endotoxin in vitro for 4 hours and the supernatant is collected for TNFα measurement. #P< 0.05. I/R, ischemia-reperfusion injury; pif, pifithrin-α.
Absence or Inhibition of p53 Exacerbates the Long-Term Sequelae after Ischemic AKI
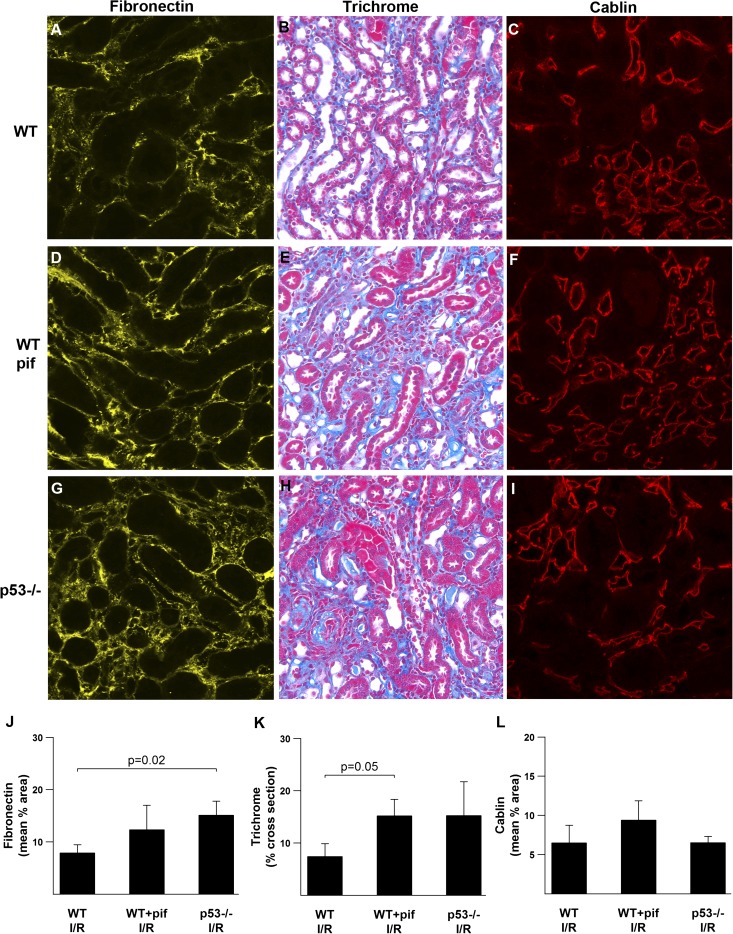
We recently reported dissociation between the acute protective effect of p53 inhibition and long-term fibrosis in the postischemic rat kidney.9 In contrast, we show that in the mouse kidney the deleterious acute effects from the absence or inhibition of p53 during IRI are accompanied by increased long-term fibrosis and fibronectin deposition as might be expected after a more severe acute injury (Figure 10, J and K). p53−/− into WT bone marrow chimeric mice also tended to have more fibronectin deposition compared with WT into WT chimeric mice (Supplemental Figure 9). We also show a lack of correlation between fibrosis and vascular rarefaction (Figure 10L), a finding similar to what we reported in the rat.
Figure 10.
Effects of p53 on the long-term sequelae of kidney IRI. Representative images of tissue stained for fibronectin, with trichrome, and for cablin 8 weeks after IRI are shown for the indicated conditions (A–I), as well as the associated quantitation (J–L). n=4. I/R, ischemia-reperfusion injury; pif, pifithrin-α.
Discussion
In this article, we show for the first time that p53 inhibition can in fact be detrimental in the setting of kidney IRI. Indeed, our results in the mouse are in sharp contrast to the known protective effects of p53 inhibition in the ischemic rat kidney.8,14 However, this apparent paradox stems primarily from differences in the nature of ischemic kidney injury between the two species rather than differences in p53 function. In the rat model, tubular cell apoptosis seems to be the major contributor to functional injury. Consequently, inhibition of p53 conveys an overall protective effect by mitigating tubular cell death. In the mouse kidney, comparable ischemic injury causes a more robust inflammatory response. Because immune cells typically undergo activation-induced apoptosis, the inhibition or absence of p53 serves mostly to prolong their survival and increase their potential for cytokine secretion. These events in turn can result in secondary inflammation-induced tubular damage that outweighs the direct beneficial effects of p53 inhibition in tubular cells.
The importance of the injury model and animal species in determining the role of p53 is further highlighted by the following observations. In the ischemic rat kidney, we recently reported that p53 inhibition can lead to long-term fibrosis despite acute functional protection. This was related in part to prolonged survival of infiltrating macrophages that, although not affecting acute injury, likely contributed to long-term fibrosis.9 Therefore, in a rat model of ischemic AKI, the inhibition of p53 in tubular cells seems to determine the immediate functional protection and p53 inhibition in immune cells prolongs their survival and causes long-term effects. In a mouse model of ischemic AKI, the inflammatory response is of such large magnitude that p53 inhibition in infiltrating cells effects both acute and long-term outcomes. Another model in which p53 inhibition or absence affects outcomes is cisplatin-induced AKI. Despite the presence of an inflammatory response, tubular apoptosis appears to be a dominant finding in this model, even in the mouse, because p53 inhibition uniformly results in functional protection across species.6
The anti-inflammatory effects of p53 seem to be universal and have been observed in various injury models.13,21,22 In fact, we show in this article that p53 can also mitigate inflammation in two models of peritonitis. Traditionally, the anti-inflammatory effects of p53 have been ascribed to its role in activation-induced apoptosis of immune cells. This role of p53 serves to control inflammatory processes by limiting the lifespan of activated immune cells. Indeed, our failure to eradicate the bone marrow of p53−/− mice with irradiation underscores the important role of p53 in determining immune cell survival. Another mechanism for the anti-inflammatory effects of p53 relates to its inhibition of NFκB, which is a major determinant of inflammatory cytokine production.23 In fact, we demonstrate in this article that the absence of p53 results in increased proinflammatory cytokine production in the IRI and peritonitis models. Finally, it is also possible that p53 directly or indirectly alters mobility, adhesion, or chemotaxis of immune cells and thus can have effects on the net influx and/or efflux rates of these cells from or into the site of inflammation. These mechanisms likely account for the early increase in leukocytes that could not be explained by differences in leukocyte apoptosis.
Of relevance to our current article is a recent study by Mulay et al. that examines the post-translational regulation of p53 by murine double minute 2 (Mdm2) during IRI of the kidney.11 In this study, nutlin is used to inhibit Mdm2 and subsequently increase p53 activity. Mulay et al. found increased injury in nutlin-treated WT mice 5 days after IRI. On the surface, their data would appear to partially contradict our 1-week findings with regard to inflammation but not apoptosis. However, there are some important aspects in their experimental design that merit closer scrutiny. First they examined a unilateral IRI model compared with the bilateral IRI model used in our study. Perhaps more importantly is the dosing regimen they used for nutlin. Achieving a sustained response with a single dose of nutlin is difficult because Mdm2 is activated by p53; although nutlin stabilizes p53 initially, it in turn increases Mdm2 levels that eventually overcome nutlin inhibition and ultimately downregulate p53.24 Indeed, Mdm2 levels increased with nutlin at day 5; therefore, these data should be interpreted with caution. In addition, these authors do not report on the effects of ischemia in p53 null mice that were not treated with nutlin.
A novel finding in our study is the role of p53 in altering macrophage polarization between the M1 and M2 phenotypes. It is generally accepted that M1 is a more inflammatory macrophage phenotype, whereas M2 serves to end inflammation and might also have a role in long-term fibrosis.15,25–29 The absence or inhibition of p53 favored polarization toward the M1 phenotype, which might have contributed to the increased inflammation and damage observed. The fact that we observed this phenomenon both in a model of ischemic AKI and models of peritonitis suggests that this effect might be an important and universal property of p53. The mechanisms by which p53 alters macrophage phenotype remain to be determined, but KLF4 might be a downstream effector. Indeed, KLF4 has recently been shown to be one determinant of macrophage phenotypic transition and could mediate in part the effects of p53 on this transition that we observed.19
In summary, we show that p53 has strong mitigating effects on inflammation that can determine the final outcome of injury. Inhibition or absence of p53 can lead to increased immune cell survival and cytokine secretion, resulting in more severe injury. p53 also can alter KLF4 expression and influence macrophage phenotype polarization. The net effects of interference with p53 signaling are primarily determined by the phenotype of various injury models and the particular animal species.
Concise Methods
Animals and Surgical Protocols
All animal protocols were approved by the Indiana University Institutional Animal Care Committee and conform to the National Institutes of Health Guide for the Care and Use of Laboratory Animals. Male mice strains B6.SJL-Ptpcra Pepcb/BoyJ and B6.129S2-Trp53tm1Tyj/J (p53−/−) were obtained from the Jackson Laboratory. Mice were aged 8–12 weeks and weighed 20–30 g. Mice were subjected to a 19-minute bilateral renal pedicle clamp followed by reperfusion. In experiments involving pharmacologic inhibition of p53, pifithrin-α was administered daily as an intraperitoneal injection for a total of 1 or 7 days (2.5 mg/kg per day, dissolved in DMSO, Calbiochem; the first dose was given at the end of clamping). Untreated mice received an equivalent dose of DMSO vehicle. Kidneys were harvested at the time of sacrifice and subsequently processed for biochemical and microscopy studies as described below. Measurement of serum and urine creatinine concentrations was performed at the University of Texas Southwestern O’Brien Kidney Research Core Center. Serum cytokines (1:6 diluted, under sham condition or 24 hours after IRI) were analyzed using mouse antibody array (MA6320; Affymetrix) following the manufacturer’s instructions.
Models of peritonitis were induced in the various mouse groups by injecting 60 μg of LPS once intraperitoneally (Escherichia coli serotype 0128:B12; Sigma), or 1.5 ml of sodium thioglycolate 4% wt/vol once intraperitoneally (Fluka Analytical). Peritoneal cell count was determined manually using an optical cytometer grid. In the pifithrin-α–treated group, 2.5 mg/kg of pifithrin-α was given daily intraperitoneally for 3 or 7 days. In the LPS protocol, collected macrophages were also examined by flow cytometry for macrophage phenotype (see the flow cytometry section below). In the thioglycate model, harvested macrophages were stimulated with 100 ng/ml of LPS in vitro. TNFα in the supernatant was measured with a murine TNFα ELISA kit (Abcam).
Isolation of Cells from Kidneys and Flow Cytometry
Kidneys were harvested, homogenized, and incubated with collagenase type IA (Sigma) in Hanks balanced salt solution with Ca and Mg.30 The digested tissue suspension was passed through a 70-μm strainer (BD Falcon). A density separation medium (Lympholyte-M; Cedarlane) was used to eliminate erythrocytes as per the manufacturer’s instructions. After blocking nonspecific Fc binding with anti-mouse CD16/32 (Clone 93; eBioscience), suspensions were incubated with CD45 (30-F11; BD Pharmingen) and F4/80 (BM8; eBioscience) followed by goat anti-rat IgG microbeads (Miltenyi Biotec) for macrophage phenotype analysis and CD45 (30-F11; BD Pharmingen) alone for other leukocyte subset analysis. CD45+F4/80+ cell fraction was enriched using MACS (Miltenyi Biotec) according to the manufacturer’s protocol. After the enrichment procedure, the following primary antibodies were added in various combinations: anti-mouse CD11b (M1/70; eBioscience), CD206 (MR5D3; AbD Serotec), CD11c (N418; eBioscience), F4/80 (BM8; eBioscience), CD4 (RM4–5; eBioscience), CD8 (53–6.7; BD Pharmingen), NK1.1 (PK136; eBioscience), CD19 (1D3; eBioscience), CD3 (17A2; eBioscience), B220 (RA3–6B2; eBioscience), and MHC class II (I-1/I-E, M5/114.15.2; eBioscience). These antibodies were conjugated with eFluor 450, FITC, phycoerythrin (PE), PE-Cy7, Alexa 647, allophycocyanin (APC), or APC-Cy7 in various combinations and their concentrations were titrated before use. Propidium iodide was also used to eliminate dead cells. Detection of the cell surface antigens by flow cytometry was performed on a LSR 561 (Becton Dickinson) or FACS Calibur instrument (Becton Dickinson) with analysis using Flow Jo (Tree Star Inc.) or Cell Quest (Becton Dickinson) software. A gating strategy to analyze M1 and M2 phenotypes is shown in Supplemental Figure 5.
Creation of Chimeric Mice
The procedure was performed at the Wells Cancer Center at Indiana University. Recipient mice are irradiated via a 139-Cs source with 1100 cGy total given in two divided doses. Approximately 1 million bone marrow cells obtained from the long bones of donor mice were transplanted via the lateral tail vein as described previously.31 Eight weeks after bone marrow transfer, the degree of chimerism was assessed by flow cytometry using CD45.1 (BoyJ) and CD45.2 (p53−/−) antibodies (Becton Dickinson; Supplemental Figure 2).
Immunohistochemical Analyses
Tissues were fixed with 4% paraformaldehyde and subsequently processed for immunofluorescence staining or standard histochemistry. The following primary antibodies were used for immunostaining: cablin (rabbit ani-human polyclonal IgG), fibronectin (rabbit anti-rat polyclonal IgG; MD Biosciences), Gr-1 (NIMP-R14; Abcam), and F4/80 (Clone CI:A3–1; AbD Serotec). Leukocyte esterase staining was performed using a naphthol AS-D chloroacetate (specific esterase) kit (Sigma-Aldrich) as per the manufacturer’s instructions. TUNEL staining was performed using a ApopTag Red in situ Apoptosis Detection Kit (Millipore) on paraffin-embedded tissues with antigen retrieval as described previously.32 TUNEL staining was also performed on frozen sections and costained with F4/80 (CL:A3–1; AbD Serotec) after antigen retrieval (1% SDS for 3 minutes). Cytospin preparation (Shandon) was conducted after enrichment of a CD11b+F4/80+ cell fraction from kidneys with MACS as above; and the cells were costained with 4',6-diamidino-2-phenylindole and antibodies to KLF4 and CD11b. All images were collected using an Olympus FV1000 MPE or Nikon Microphot-SA equipped with SPOT RT Slider camera (Diagnostic Instruments Inc) as described previously.9,31 Esterase+ or F4/80+ cells were quantified by counting the number of stained cells per field. We collected 25–30 images of a kidney from each animal at ×20 magnification. For KLF4, fibronectin, and cablin staining, the percentage of area per cross-section staining positive for the antibody of interest was determined with Metamorph (Universal Imaging) as described previously.9
Statistical Analyses
Data were analyzed for statistical significance with R software, using ANOVA and pairwise t tests. All data are reported as means with SDs. Significance was set at P<0.05.
Disclosures
None.
Supplementary Material
Acknowledgments
This work was supported by National Institutes of Health (NIH) Grants R01 DK077124 and DK079312, a Paul Teschan Research grant from Dialysis Clinics Inc. to T.A.S., Grant R01 DK080067 (NIH) to P.C.D., Grant R01 CA134777 (NIH) to R.J.C., and Grant DK79328 (NIH) to the University of Texas Southwestern O'Brien Kidney Research Core Center.
Footnotes
This article contains supplemental material online at http://jasn.asnjournals.org/lookup/suppl/doi:10.1681/ASN.2012050469/-/DCSupplemental.
References
- 1.Bonventre JV, Yang L: Cellular pathophysiology of ischemic acute kidney injury. J Clin Invest 121: 4210–4221, 2011 [DOI] [PMC free article] [PubMed] [Google Scholar]
- 2.Sharfuddin AA, Molitoris BA: Pathophysiology of ischemic acute kidney injury. Nat Rev Nephrol 7: 189–200, 2011 [DOI] [PubMed] [Google Scholar]
- 3.Uchino S, Kellum JA, Bellomo R, Doig GS, Morimatsu H, Morgera S, Schetz M, Tan I, Bouman C, Macedo E, Gibney N, Tolwani A, Ronco C, Beginning and Ending Supportive Therapy for the Kidney (BEST Kidney) Investigators : Acute renal failure in critically ill patients: A multinational, multicenter study. JAMA 294: 813–818, 2005 [DOI] [PubMed] [Google Scholar]
- 4.Murugan R, Kellum JA: Acute kidney injury: What’s the prognosis? Nat Rev Nephrol 7: 209–217, 2011 [DOI] [PMC free article] [PubMed] [Google Scholar]
- 5.Hoste EA, De Corte W: Clinical consequences of acute kidney injury. Contrib Nephrol 174: 56–64, 2011 [DOI] [PubMed] [Google Scholar]
- 6.Wei Q, Dong G, Yang T, Megyesi J, Price PM, Dong Z: Activation and involvement of p53 in cisplatin-induced nephrotoxicity. Am J Physiol Renal Physiol 293: F1282–F1291, 2007 [DOI] [PMC free article] [PubMed] [Google Scholar]
- 7.Zhou L, Fu P, Huang XR, Liu F, Lai KN, Lan HY: Activation of p53 promotes renal injury in acute aristolochic acid nephropathy. J Am Soc Nephrol 21: 31–41, 2010 [DOI] [PMC free article] [PubMed] [Google Scholar]
- 8.Molitoris BA, Dagher PC, Sandoval RM, Campos SB, Ashush H, Fridman E, Brafman A, Faerman A, Atkinson SJ, Thompson JD, Kalinski H, Skaliter R, Erlich S, Feinstein E: siRNA targeted to p53 attenuates ischemic and cisplatin-induced acute kidney injury. J Am Soc Nephrol 20: 1754–1764, 2009 [DOI] [PMC free article] [PubMed] [Google Scholar]
- 9.Dagher PC, Mai EM, Hato T, Lee SY, Anderson MD, Karozos SC, Mang HE, Knipe NL, Plotkin Z, Sutton TA: The p53 inhibitor pifithrin-α can stimulate fibrosis in a rat model of ischemic acute kidney injury. Am J Physiol Renal Physiol 302: F284–F291, 2012 [DOI] [PMC free article] [PubMed] [Google Scholar]
- 10.Homsi E, Mota da Silva S, Jr, Machado de Brito S, Bouçada Inácio Peixoto E, Butori Lopes de Faria J, Janino P: p53-Mediated oxidative stress and tubular injury in rats with glycerol-induced acute kidney injury. Am J Nephrol 33: 49–59, 2011 [DOI] [PubMed] [Google Scholar]
- 11.Mulay SR, Thomasova D, Ryu M, Anders HJ: MDM2 (murine double minute-2) links inflammation and tubular cell healing during acute kidney injury in mice. Kidney Int 81: 1199–1211, 2012 [DOI] [PubMed] [Google Scholar]
- 12.Vousden KH, Prives C: Blinded by the light: The growing complexity of p53. Cell 137: 413–431, 2009 [DOI] [PubMed] [Google Scholar]
- 13.Gudkov AV, Komarova EA: Pathologies associated with the p53 response. Cold Spring Harb Perspect Biol 2: a001180, 2010 [DOI] [PMC free article] [PubMed] [Google Scholar]
- 14.Kelly KJ, Plotkin Z, Vulgamott SL, Dagher PC: P53 mediates the apoptotic response to GTP depletion after renal ischemia-reperfusion: Protective role of a p53 inhibitor. J Am Soc Nephrol 14: 128–138, 2003 [DOI] [PubMed] [Google Scholar]
- 15.Nelson PJ, Rees AJ, Griffin MD, Hughes J, Kurts C, Duffield J: The renal mononuclear phagocytic system. J Am Soc Nephrol 23: 194–203, 2012 [DOI] [PMC free article] [PubMed] [Google Scholar]
- 16.Hashimoto D, Miller J, Merad M: Dendritic cell and macrophage heterogeneity in vivo. Immunity 35: 323–335, 2011 [DOI] [PMC free article] [PubMed] [Google Scholar]
- 17.McConnell BB, Yang VW: Mammalian Krüppel-like factors in health and diseases. Physiol Rev 90: 1337–1381, 2010 [DOI] [PMC free article] [PubMed] [Google Scholar]
- 18.Feinberg MW, Wara AK, Cao Z, Lebedeva MA, Rosenbauer F, Iwasaki H, Hirai H, Katz JP, Haspel RL, Gray S, Akashi K, Segre J, Kaestner KH, Tenen DG, Jain MK: The Kruppel-like factor KLF4 is a critical regulator of monocyte differentiation. EMBO J 26: 4138–4148, 2007 [DOI] [PMC free article] [PubMed] [Google Scholar]
- 19.Liao X, Sharma N, Kapadia F, Zhou G, Lu Y, Hong H, Paruchuri K, Mahabeleshwar GH, Dalmas E, Venteclef N, Flask CA, Kim J, Doreian BW, Lu KQ, Kaestner KH, Hamik A, Clément K, Jain MK: Krüppel-like factor 4 regulates macrophage polarization. J Clin Invest 121: 2736–2749, 2011 [DOI] [PMC free article] [PubMed] [Google Scholar]
- 20.Rowland BD, Peeper DS: KLF4, p21 and context-dependent opposing forces in cancer. Nat Rev Cancer 6: 11–23, 2006 [DOI] [PubMed] [Google Scholar]
- 21.Merched AJ, Williams E, Chan L: Macrophage-specific p53 expression plays a crucial role in atherosclerosis development and plaque remodeling. Arterioscler Thromb Vasc Biol 23: 1608–1614, 2003 [DOI] [PubMed] [Google Scholar]
- 22.Komarova EA, Krivokrysenko V, Wang K, Neznanov N, Chernov MV, Komarov PG, Brennan ML, Golovkina TV, Rokhlin OW, Kuprash DV, Nedospasov SA, Hazen SL, Feinstein E, Gudkov AV: p53 is a suppressor of inflammatory response in mice. FASEB J 19: 1030–1032, 2005 [DOI] [PubMed] [Google Scholar]
- 23.Gudkov AV, Gurova KV, Komarova EA: Inflammation and p53: A tale of two stresses. Genes Cancer 2: 503–516, 2011 [DOI] [PMC free article] [PubMed] [Google Scholar]
- 24.Purvis JE, Karhohs KW, Mock C, Batchelor E, Loewer A, Lahav G: p53 dynamics control cell fate. Science 336: 1440–1444, 2012 [DOI] [PMC free article] [PubMed] [Google Scholar]
- 25.Mosser DM, Edwards JP: Exploring the full spectrum of macrophage activation. Nat Rev Immunol 8: 958–969, 2008 [DOI] [PMC free article] [PubMed] [Google Scholar]
- 26.Gordon S, Martinez FO: Alternative activation of macrophages: Mechanism and functions. Immunity 32: 593–604, 2010 [DOI] [PubMed] [Google Scholar]
- 27.Lee S, Huen S, Nishio H, Nishio S, Lee HK, Choi BS, Ruhrberg C, Cantley LG: Distinct macrophage phenotypes contribute to kidney injury and repair. J Am Soc Nephrol 22: 317–326, 2011 [DOI] [PMC free article] [PubMed] [Google Scholar]
- 28.Li L, Okusa MD: Macrophages, dendritic cells, and kidney ischemia-reperfusion injury. Semin Nephrol 30: 268–277, 2010 [DOI] [PMC free article] [PubMed] [Google Scholar]
- 29.Ricardo SD, van Goor H, Eddy AA: Macrophage diversity in renal injury and repair. J Clin Invest 118: 3522–3530, 2008 [DOI] [PMC free article] [PubMed] [Google Scholar]
- 30.Kinsey GR, Sharma R, Huang L, Li L, Vergis AL, Ye H, Ju ST, Okusa MD: Regulatory T cells suppress innate immunity in kidney ischemia-reperfusion injury. J Am Soc Nephrol 20: 1744–1753, 2009 [DOI] [PMC free article] [PubMed] [Google Scholar]
- 31.Kalakeche R, Hato T, Rhodes G, Dunn KW, El-Achkar TM, Plotkin Z, Sandoval RM, Dagher PC: Endotoxin uptake by S1 proximal tubular segment causes oxidative stress in the downstream S2 segment. J Am Soc Nephrol 22: 1505–1516, 2011 [DOI] [PMC free article] [PubMed] [Google Scholar]
- 32.Kelly KJ, Sandoval RM, Dunn KW, Molitoris BA, Dagher PC: A novel method to determine specificity and sensitivity of the TUNEL reaction in the quantitation of apoptosis. Am J Physiol Cell Physiol 284: C1309–C1318, 2003 [DOI] [PubMed] [Google Scholar]
Associated Data
This section collects any data citations, data availability statements, or supplementary materials included in this article.


