

Abstract
The photosensitizer, methylene blue (MB), generates singlet oxygen that irreversibly inhibits Torpedo californica acetylcholinesterase (TcAChE). In the dark, it inhibits reversibly. Binding is accompanied by a bathochromic absorption shift, used to demonstrate displacement by other acetylcholinesterase inhibitors interacting with the catalytic “anionic” subsite (CAS), the peripheral “anionic” subsite (PAS), or bridging them. MB is a noncompetitive inhibitor of TcAChE, competing with reversible inhibitors directed at both “anionic” subsites, but a single site is involved in inhibition. MB also quenches TcAChE's intrinsic fluorescence. It binds to TcAChE covalently inhibited by a small organophosphate (OP), but not an OP containing a bulky pyrene. Differential scanning calorimetry shows an ∼8° increase in the denaturation temperature of the MB/TcAChE complex relative to native TcAChE, and a less than twofold increase in cooperativity of the transition. The crystal structure reveals a single MB stacked against Trp279 in the PAS, oriented down the gorge toward the CAS; it is plausible that irreversible inhibition is associated with photooxidation of this residue and others within the active-site gorge. The kinetic and spectroscopic data showing that inhibitors binding at the CAS can impede binding of MB are reconciled by docking studies showing that the conformation adopted by Phe330, midway down the gorge, in the MB/TcAChE crystal structure, precludes simultaneous binding of a second MB at the CAS. Conversely, binding of ligands at the CAS dislodges MB from its preferred locus at the PAS. The data presented demonstrate that TcAChE is a valuable model for understanding the molecular basis of local photooxidative damage.
Keywords: acetylcholinesterase, singlet oxygen, photosensitizer, methylene blue, tryptophan, radiation damage
Introduction
An important category of photosensitized compounds are those that generate reactive oxygen species (ROS).1, 2 Light excitation of such compounds raises them to an excited state (singlet or triplet), which stimulates generation of the ROS by one or both of two mechanisms. Superoxide radical (O2·−) and hydroxyl radical (HO·) are generated by electron transfer and singlet oxygen (1O2) by energy transfer.3 ROS can produce damage to cells by various mechanisms, including lipid peroxidation,4, 5 DNA degradation,6, 7 and chemical modification of proteins.8–10 Photosensitized compounds are utilized in a clinical context for photodynamic therapy (PDT) of malignancies,11 and are often targeted to specific “addresses” by conjugation with antibodies or peptide hormones.3, 12, 13 Photoactivated inhibitors can similarly serve as valuable tools for selective modification of enzymes and other proteins,14 both in vitro and in situ, by binding specifically to their active sites before photoactivation. For optimal utilization of photosensitizers in PDT, it is necessary to understand how they interact with their targets, whether nonspecifically or specifically, the pathway(s) taken by the reactive species generated by photoexcitation, the molecular targets, and the specific chemical damage produced. These issues are both under active investigation and discussion.15
We earlier showed that Torpedo californica acetylcholinesterase (TcAChE) provides a useful model for studying the effects of ROS. Thus, HO· radicals generated by the Fenton reaction16 mimic the effects produced by oxidative stress, namely, peptide bond cleavage and conversion of the native TcAChE dimer to an inactive partially unfolded molten globule state17 with structural features typical of a molten globule.18, 19 Furthermore, the photosensitive reagent, hypericin,20 was shown to specifically target the molten globule state of TcAChE, and to crosslink it by generation of 1O2.21, 22 In addition, we were able to identify specific disulfide bond cleavage by X-irradiation.23 Thus, TcAChE has served as a valuable model protein for studying the molecular processes underlying radiation damage.
The photosensitizer, rose Bengal, as well as other xanthene dyes, are reversible inhibitors of acetylcholinesterase (AChE) that act as irreversible inhibitors under illumination.24, 25 Another photosensitive dye, methylene blue (MB)26 (see Scheme 1 for the structures of MB and of other compounds used in this study), was shown to act as a reversible inhibitor of bovine erythrocyte AChE27 and Electrophorus electricus AChE,28 as well as of human and horse serum buytrylcholinesterase.27–29 Ozer and Küçükkilinç reported that their kinetic studies of the inhibition of BChE by MB and related compounds revealed more than one binding site and cooperative binding, whereas the inhibition of AChE was consistent with a single binding site, with no evidence for cooperativity.28
Scheme 1.
Recently, we showed that MB acts as an irreversible inhibitor of TcAChE under illumination, due to the action of 1O2 generated by its photosensitizing action.10 Plausible targets for this irreversible action effect are the tryptophan (Trp) residues within the active-site gorge, associated with either the anionic subsite of the catalytic anionic site (CAS), near the bottom of the active-site gorge, Trp84, or with the peripheral anionic site (PAS), near the entrance to the gorge, Trp279.30 To further explore the mode of interaction of MB with TcAChE and the site(s) with which it interacts, we studied its reversible inhibition of the enzyme in the dark. In addition, we used a repertoire of steady state spectroscopic methods, differential scanning calorimetry (DSC), computer docking and X-ray crystallography to characterize the reversible MB/TcAChE complex. These data provide a valuable molecular platform for investigating the pathways and possible targets of 1O2 generated in situ.
Results
Photodynamic inactivation of TcAChE
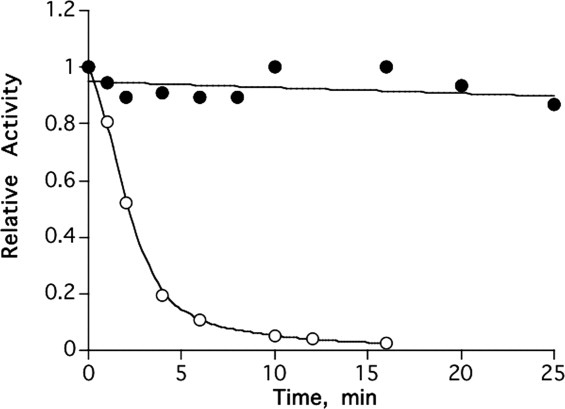
Figure 1(A) shows that TcAChE undergoes time- and concentration-dependent irreversible inactivation by MB under irradiation. Similar rates of photoinactivation were obtained if white light was used or if illumination at wavelengths below 600 nm was cut off by a red-light filter (not shown). Detailed evidence demonstrating that this irreversible inactivation involves generation of singlet oxygen (1O2) was presented earlier.10
Figure 1.
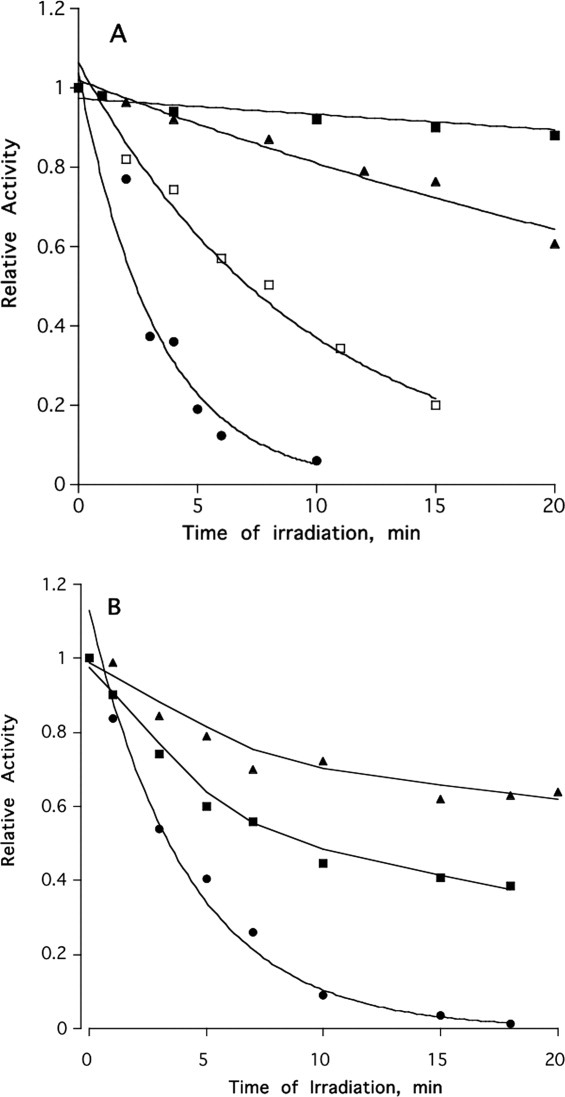
(A) Irreversible photoinactivation of TcAChE stimulated by MB. TcAChE samples were incubated in the presence of various concentrations of MB under illumination, as described under Materials and Methods, with aliquots being withdrawn for assay at the appropriate times. The TcAChE concentration was 2 μM in buffer 1, at 23°C. ▴, 0.2 μM MB; □, 5 μM MB; •, 10 μM MB; ▪, 5 μM MB in the absence of illumination. (B) Effects of reversible AChE inhibitors on the photoinactivation of TcAChE stimulated by MB. TcAChE, 1.5 μm; MB, 1 μm; EDR, 20 μm; BW, 20 μm. •, MB; ▪, MB + EDR; ▴, MB + BW.
As mentioned in the Introduction, MB has been shown to act as a reversible inhibitor of Electrophorus AChE.28 It is, thus, plausible that it binds reversibly within the active site-gorge of TcAChE at the “anionic” subsite of the CAS, near the bottom of the active-site gorge, and/or at the PAS near the entrance to the gorge. This assumption was supported by the fact that various reversible inhibitors of TcAChE, known to bind at the CAS (edrophonium, EDR), at the PAS (propidium, PROP), or to span the active-site gorge, BW284c51 (BW), were shown to retard MB-stimulated photoinactivation [Fig. 1(B)]. Furthermore, kinetic studies recently showed that MB displays essentially complete competition with thioflavin (ThT) T,31 which has been shown to be bound at the PAS in its crystalline complex with TcAChE.32
Accordingly, we decided to carefully study the reversible binding of MB to TcAChE by both steady-state spectroscopy and kinetics, under conditions in which irreversible photoinactivation was practically excluded (see Materials and Methods section).
Spectroscopic monitoring of the interaction of MB with TcAChE
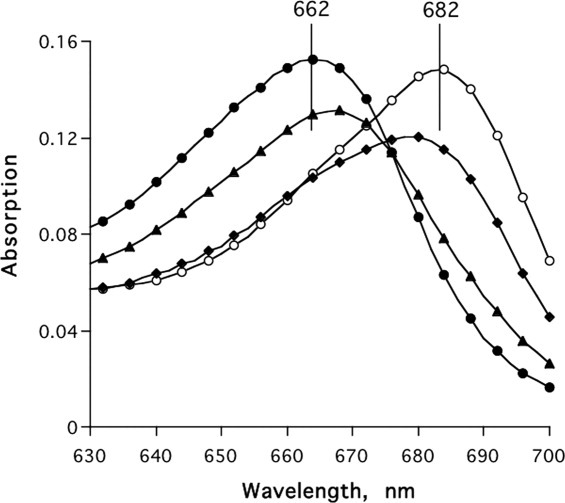
Figure 2(A) shows the effect of increasing concentrations of TcAChE on the absorption spectrum of MB. The absorption maximum is shifted from 662 to 682 nm, with an isosbestic point at ∼671 nm. Figure 2(B) displays a plot showing the dependence of the concentration of bound MB on the TcAChE concentration.
Figure 2.
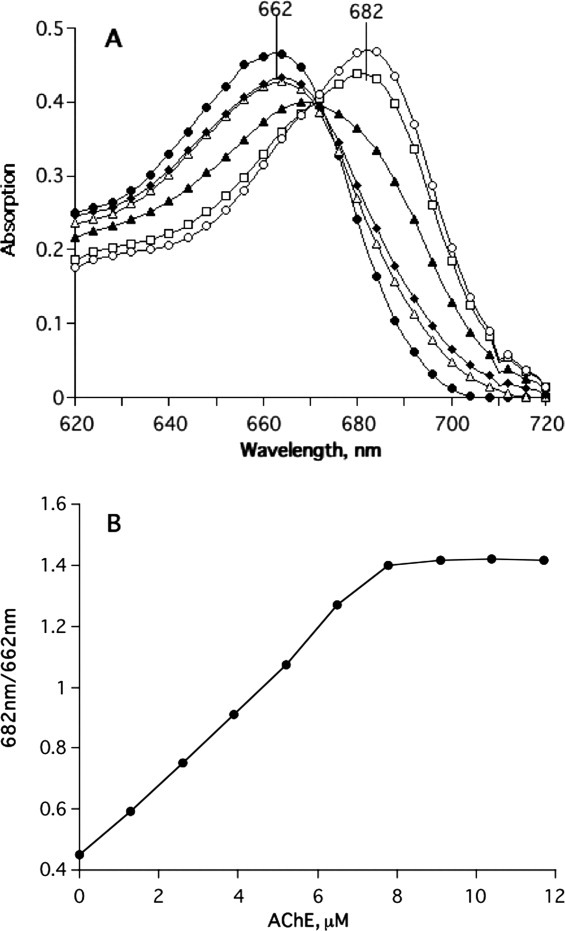
Binding of MB to TcAChE monitored by absorption spectroscopy. (A) The spectra shown monitor titration of 5-μM MB in buffer 1, with a concentrated solution of TcAChE in the same buffer. The values given represent the final concentrations of TcAChE; under the conditions used, the dilution of MB is negligible, as is evident from the sharp isosbestic point. •, no TcAChE; ▵, 0.65 μM TcAChE; ♦, 1.3 μM TcAChE; ▴, 3.9 μM TcAChE; □, 6.5 μM TcAChE; ○, 9.2 μM TcAChE. (B) Saturation curve calculated using spectroscopic data similar to those presented in (A).
As mentioned above, binding of MB to TcAChE could be occurring at the CAS, at the PAS, or at both. We used our finding of the large optical shift (20 nm) between free and bound MB as a tool to monitor the displacement of MB by ligands whose binding-site within the active-site gorge of TcAChE had already been identified. Accordingly, we examined the influence on the spectrum of the MB/TcAChE complex of a CAS inhibitor, EDR,30 of a PAS inhibitor, PROP,33 and of a bifunctional inhibitor, BW, which spans the active-site gorge, binding at both the CAS and PAS simultaneously.34
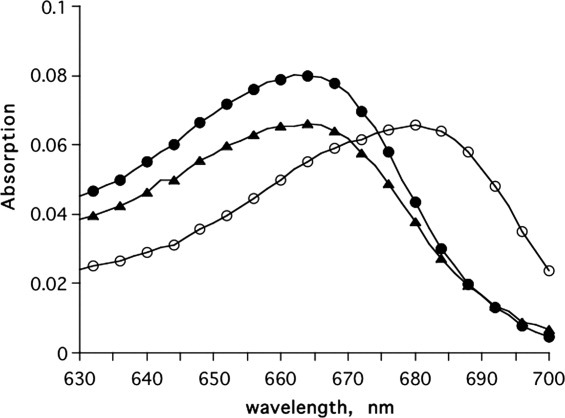
Figure 3(A,B) shows that neither a large excess of the CAS inhibitor alone, nor of the PAS inhibitor alone, completely reverses the change in the spectrum of MB produced by TcAChE, but that both together, or the gorge-spanning ligand, are capable of doing so [Fig. 3(C)].
Figure 3.
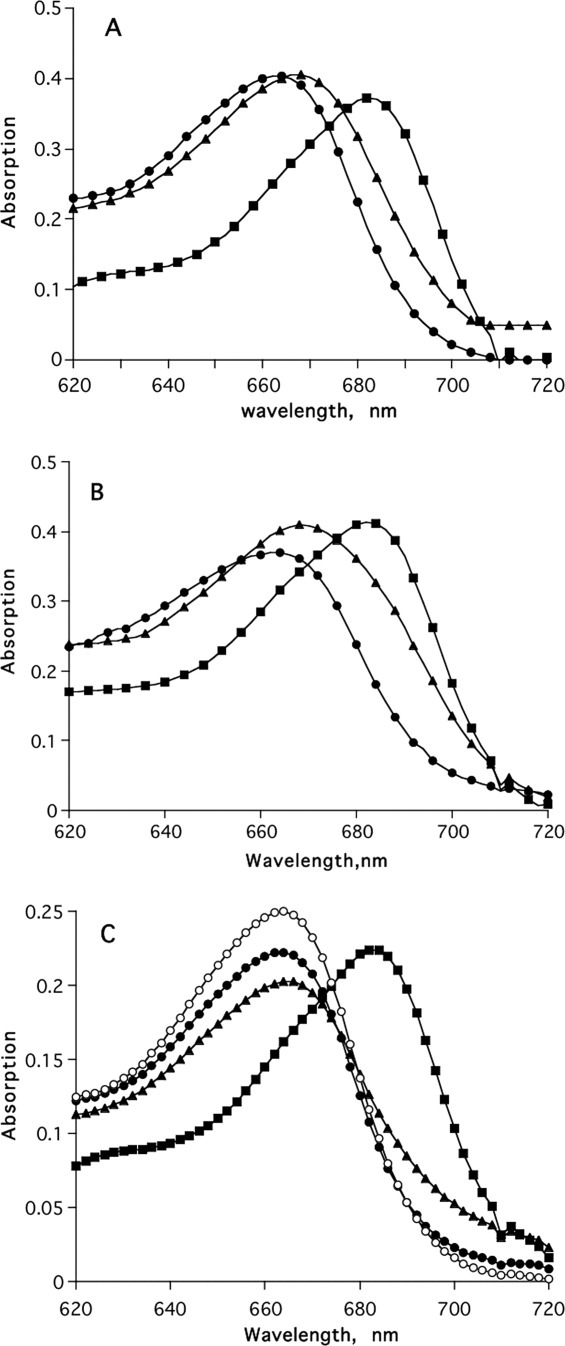
Effect of reversible AChE inhibitors on the binding of MB to TcAChE as monitored by absorption spectroscopy. (A) Displacement of MB by EDR. Concentrations were TcAChE, 12 μM; MB, 5 μM; EDR, 60 μM. •, MB; ▪, MB + TcAChE; ▴, MB + TcAChE + EDR. (B) Displacement of MB by PROP. Concentrations were TcAChE, 12 μM; MB, 5 μM; PROP, 60 μM. •, MB; ▪, MB + TcAChE; ▴, MB + TcAChE + PROP. (C) Displacement of MB by EDR+PROP or by BW. Concentrations were TcAChE, 5.2 μM; MB, 2.5 μM; EDR, 60 μM; PROP, 60 μM; BW, 40 μM. •, MB; ▪, MB + TcAChE; ▴, MB + TcAChE + EDR + PROP; ○, MB + TcAChE + BW.
Figure 4 shows an experiment in which, initially, TcAChE was titrated to saturation with MB. Upon subsequent titration with EDR, the ratio of the absorbance at 682 nm to that at 661 nm decreased from a maximum of ∼1.45 to a plateau level of ∼0.8, due to displacement of the MB from the active-site gorge of the enzyme by EDR. But upon addition of PROP, the ratio further decreased to ∼0.5, approaching the value of 0.42 characteristic of free MB. In a control experiment, it was shown that if EDR was added first, MB that was added subsequently displaced the bound EDR.
Figure 4.
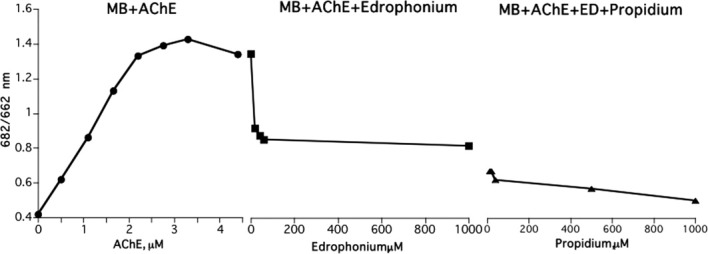
Sequential displacement of MB from TcAChE by EDR and PROP. A 5-μM solution of MB in buffer 1 was titrated with a concentrated solution of TcAChE until a plateau value of the 682 nm/662 nm ratio was reached. Subsequent titration with concentrated EDR reduced the ratio to a lower plateau, and further titration with PROP reduced the ratio further.
The spectroscopic data thus suggest that MB can bind both to the PAS of TcAChE and, with much lower affinity, to the CAS. It is possible, however, that the apparent weak binding in fact reflects an allosteric effect of its binding to the PAS.
Kinetics of reversible inhibition of TcAChE by MB
Kinetic data have been used extensively to investigate the interaction of inhibitors with the CAS and PAS of AChE.35 Accordingly, we decided to complement the spectroscopic data presented above for the interaction of MB with TcAChE by kinetic measurements.
The reciprocal plots of 1/V versus 1/S, in the presence of increasing fixed concentrations of MB per plot, show that the inhibitor does not change the Km of acetylthiocholine iodide (ATC), but decreases Vmax (Supporting Information Fig. S1). MB seems, therefore, to act as a classical noncompetitive inhibitor of TcAChE; thus, ATC maintains the same substrate affinity for the [E][MB] complex as for the free enzyme, and MB binds to the [E][S] complex with the same affinity as it binds to the free enzyme. Vmax decreases with increasing MB concentration, most likely due to increasing formation of a nonproductive ternary [E][MB][S] complex of the enzyme with ATC and MB. Similar values were obtained for KI, 35.6 nM, and for αKI, 33.1 nM, derived, respectively, from secondary plots of 1/Vmax versus [MB], and from the slopes of the reciprocal plots of 1/V versus 1/S against [MB]. These observations are consistent with the equilibrium scheme shown for noncompetitive inhibition in Scheme 2, where α ≍ 1.
Scheme 2.
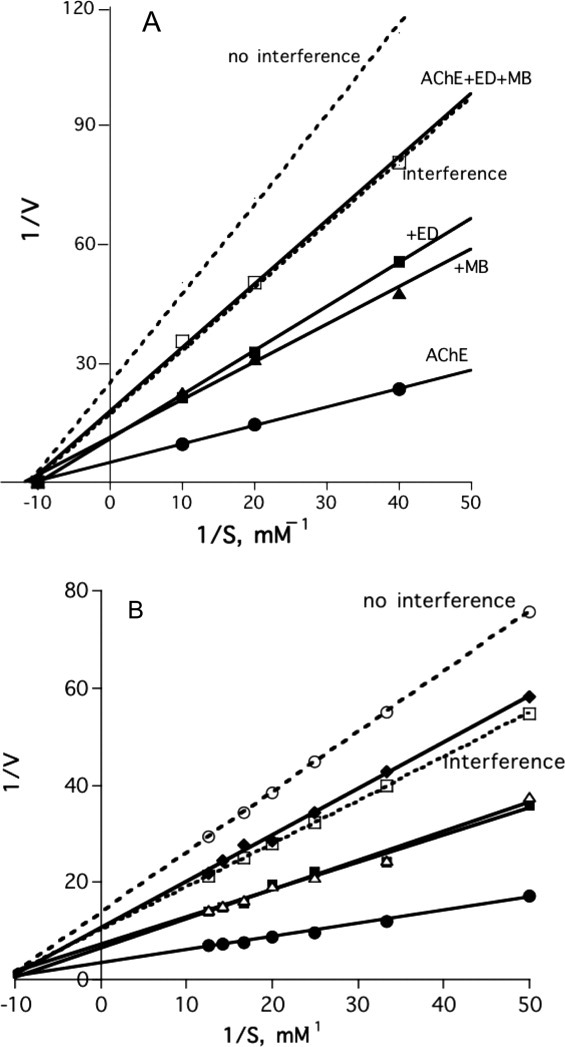
The Lineweaver–Burk plots displayed in Figure 5(A,B)36 show that EDR and PROP, respectively, both compete with MB for binding to TcAChE, even though the former binds at the CAS, and latter at the PAS.
Figure 5.
Lineweaver–Burk plots for hydrolysis of ATC by TcAChE in the presence and absence of reversible inhibitors. (A) Lineweaver–Burk plots demonstrating the interference of EDR with binding of MB. The dotted lines represent the theoretical plots for no interference of EDR with binding of MB and for interference, namely, complete competition for the same binding site. •, TcAChE alone; ▴, TcAChE + 0.5 nM MB; ▪, TcAChE + 5 nM EDR; □, TcAChE + 0.5 nM MB + 5 nM EDR. (B) Lineweaver–Burk plots demonstrating the interference of PROP with the binding of MB. The dotted lines represent the theoretical plots for no interference of PROP with binding of MB and for interference, namely, complete competition for the same binding site. •, TcAChE alone; ▪, TcAChE + 0.5 nM MB; ▵, TcAChE + 5 nM PROP; ♦, TcAChE + 0.5 nM MB + 5 nM PROP.
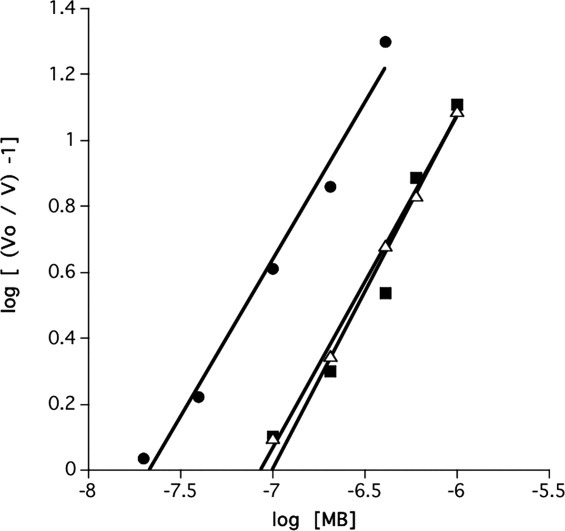
The number of MB binding sites involved in the inhibition of TcAChE was determined by plotting log [(V0/V) – 1] versus log [MB] at a fixed concentration of the substrate, ATC, in accordance with the following equation,36 that is analogous to the Hill equation for determining the number of substrate-binding sites37:
| (1) |
where V0 and V are the velocities in absence and presence of MB, respectively, and the slope of the line, n, is the number of binding sites. Figure 6 shows that the plots are linear for a wide range of fixed ATC concentrations per plot, and for the increasing MB concentrations used. The average number of MB binding sites obtained on its basis, for an ATC concentration range of 0.02–1.5 mM, is 1.06 ± 0.07 (SD; n = 6). As the Km of TcAChE for ATC, as determined by us, is ∼0.08 mM, the level of occupancy of the enzyme by the substrate clearly does not influence the number of binding sites for MB that inhibits enzyme activity. The value obtained for the number of binding sites for MB in the Torpedo enzyme is in agreement with that reported earlier for electric eel AChE.28
Figure 6.
Inhibition of hydrolysis of ATC by TcAChE as a function of the MB concentration. Double logarithmic plots are displayed at three ATC concentrations. The slopes of these plots yield the number of binding sites for MB on the catalytic subunit involved in inhibition of enzymic activity.36 •, 0.1 mM ATC; ▵, 0.5 mM ATC; ▪, 1.0 mM ATC.
Fluorescence spectroscopy
MAC is a competitive inhibitor of AChE that binds at the catalytic site of the enzyme with concomitant concentration-dependent quenching of the fluorescence of both ligand and enzyme.38, 39 Figure 7(A) shows the quenching of MAC fluorescence by increasing concentrations of TcAChE. Figure 7(B) shows that quenching of the fluorescence of MAC is reduced significantly by both MB and BW, proving that, as might be predicted, they can both displace MAC from the CAS. Figure 8(A) shows that MB itself can fully quench the intrinsic fluorescence of TcAChE. Figure 8(B) shows that BW also quenches the intrinsic fluorescence, but less efficiently than MB, because the quenching produced by 10 μM MB alone is reduced in the presence of BW.
Figure 7.
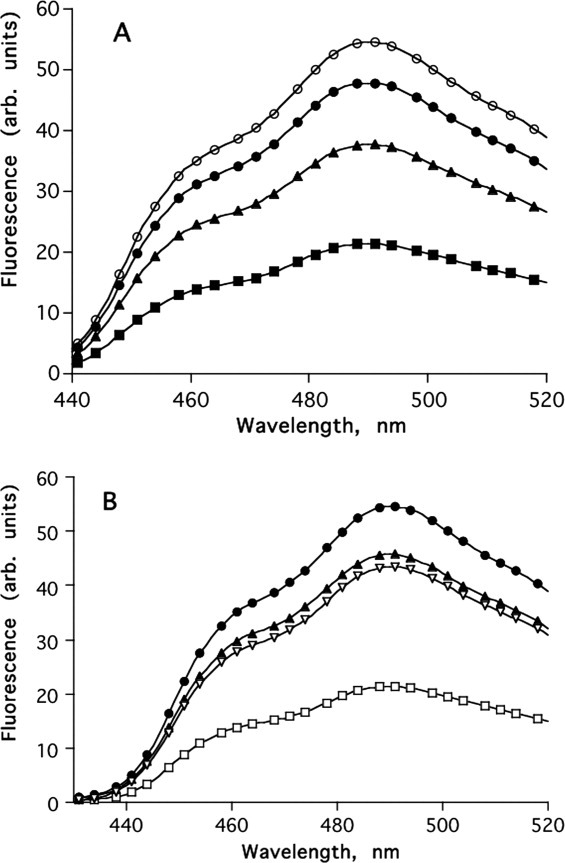
(A) Quenching of N-MAC fluorescence by TcAChE. ○, 20 μM N-MAC; •, 20 μM N-MAC + 1.5 μM TcAChE; ▴, + 3 μM TcAChE; ▪, + 6 μM TcAChE; (B) Displacement of N-MAC from TcAChE by MB and by BW. •, 20 μM N-MAC; □, 20 μM N-MAC + 6 μM TcAChE; ▿, 20 μM N-MAC + 6 μM TcAChE + 0.200 μM BW; ▴, 20 μM N-MAC + 6 μM TcAChE + 20 μM MB.
Figure 8.
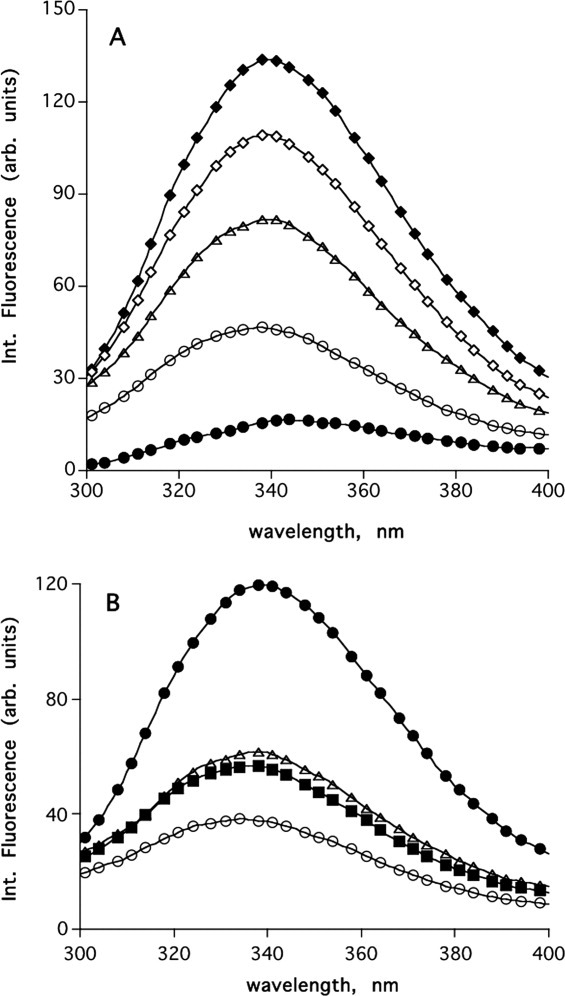
(A) Quenching of intrinsic fluorescence of TcAChE by MB. ♦, 1.5 μM TcAChE; □, 1.5 μM TcAChE + 0.5 mM MB; ▵, + 1 mM MB; ○, + 10 mM MB; •, + 10 mM MB. (B) Competition of MB and BW. •, 1.5 μM TcAChE; ○, 1.5 μM TcAChE + 20 μM MB; ▵, 1.5 μM TcAChE + 100 μM BW; ▪, 1.5 μM TcAChE + 20 μM MB + 100 μM BW.
Figure 9 displays the effect of two organophosphate (OP) inhibitors of AChE on the interaction of MB with TcAChE. The two OP inhibitors shown in Scheme 1, paraoxon and pyrenebutyl ethyl phosphorofluoridate (PBEPF),40 both inhibit AChE irreversibly, by covalent reaction with its active-site serine, S200; but the pyrenebutyl ethyl phosphoryl moiety of the conjugate produced by PBEPF is much bulkier than the diethylphosphoryl moiety in the conjugate obtained by reaction with paraoxon. Addition of the diethylphosphoryl-TcAChE conjugate to MB produces a large “red” shift in its absorption maximum, to a value (∼678 nm) approaching that produced by the free enzyme; in contrast, addition of the PBEP-TcAChE conjugate only slightly shifts the absorption maximum (∼667 nm), suggesting a substantial decrease in the affinity of MB for the PBEPF/TcAChE conjugate.
Figure 9.
Effects of paraoxon and PBEPF on binding of MB to TcAChE. •, 5 μM MB; ○, 5 μM MB + 6 μM TcAChE; ♦, 5 μM MB + 6 μM paraoxon/TcAChE conjugate; ▴, 5 μM MB + 6 μM PBEPF/TcAChE conjugate. The conjugates were prepared as described under Materials and Methods section.
The mamba venom polypeptide toxin, fasciculin II (FasII) is a very potent inhibitor of vertebrate AChEs.41 It exerts its action by binding tightly to the PAS, thus blocking entrance of substrate to the active-site gorge.42, 43 Figure 10 shows that FasII completely prevents interaction of MB with TcAChE.
Figure 10.
Effect of FasII on the binding of MB to TcAChE. •, 1 μM MB; ○, 1 μM MB + 2 μM TcAChE; ▴, 1 μM MB + 2 μM TcAChE + 2 μM FasII.
Thermal inactivation and differential scanning calorimetry of the MB/TcAChE complex
We earlier showed that thermal denaturation irreversibly transforms TcAChE into a molten globule.44, 45 DSC permitted quantitative characterization of this transition,44, 45 as well as of the thermal stabilization conferred by inhibitors, osmolytes, and divalent cations.22, 46
Figure 11 shows that MB, like other reversible AChE inhibitors,46 provides effective protection of TcAChE against thermal inactivation.
Figure 11.
Protection of TcAChE from thermal inactivation by MB. ○, Incubation of 1.5 μM TcAChE at 39°C; •, Incubation of 1.5 μM TcAChE + 50 μM MB at 39°C.
Thermal denaturation of the MB/TcAChE complex, as of native TcAChE, gives rise to well-defined DSC transitions (Fig. 12). As we showed earlier for the native enzyme,44 the value of the temperature of the excess heat capacity maximum (Tm) is dependent on the temperature scan rate (not shown). Thermal denaturation of TcAChE, under the experimental conditions used, is always calorimetrically irreversible, since on reheating of the same protein sample no thermal effect is observed. Such behavior is characteristic of an irreversible, kinetically controlled process.47, 48 Accordingly, analysis of the DSC transitions under these conditions utilized a simple two-state irreversible model (see Materials and Methods). The results of the fitting of the experimental data to this model are displayed in Figure 12 (solid lines) and in Table I. As can be seen, a good approximation was achieved.
Figure 12.
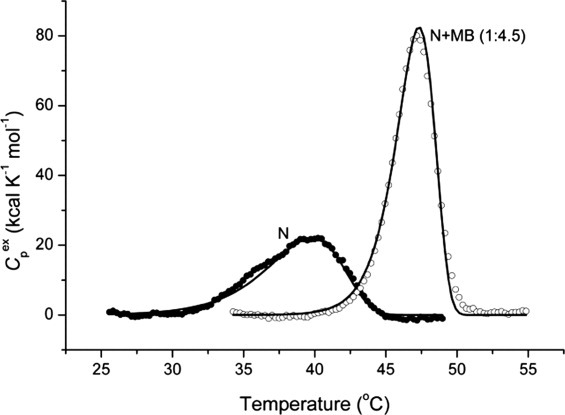
Temperature dependence of the excess molar heat capacity of TcAChE (N) and of the MB/TcAChE complex (N+MB) at a scan rate of 60 K h−1 in 0.1M NaCl/10 mM HEPES, pH 7.5. Solid lines represent the best fit for each experimental curve to a simple two-state model of protein denaturation (see Materials and Methods section). The enzyme concentration was 6.9 μM, and the concentration of MB in the solution of the complex was 31 μM.
Table I.
Arrhenius Equation Parameter Estimates for TcAChE and for Its Complex with MB
| Function | TcAChE | MB/TcAChE (1:4.5) |
|---|---|---|
| ΔH (kcal mol−1) | 544.4 ± 4.2 | 765.8 ± 5.2 |
| EA (kcal mol−1) | 74.4 ± 1.6 | 146.8 ± 1.8 |
| T* (°C) | 42.6 ± 0.2 | 47.9 ± 0.1 |
| R | 0.9992 | 0.9985 |
The correlation coefficient (r), used as a criterion for fitting accuracy, was calculated according to the equation,  , where yi and y
 are, respectively, the experimental and calculated values of the measurable parameter; y
 is the mean of the experimental values of the measurable parameter and n the number of points.
It is clear that binding of MB to TcAChE substantially sharpens the cooperativity of the transition (more than twofold) as measured by the ratio Tm/ΔT, where ΔT is the temperature range at the half-maximum of the DSC transition: namely, 6.1 for native TcAChE and 13.5 for the MB/TcAChE complex.
Crystal structure of the MB/TcAChE complex
The kinetic and spectroscopic data presented above showed that both ligands that bind at the catalytic site and those that bind at the PAS, as well as gorge-spanning ligands, can interfere with the binding of MB. We decided to use X-ray crystallography to identify the site of interaction of MB with the enzyme at the atomic level. Accordingly, MB was soaked into trigonal crystals of TcAChE, and data collection for the complex obtained, to 2.4 Å resolution, followed by solution of its structure by molecular replacement, and subsequent refinement, as described under Materials and Methods.
The crystal structure revealed a single molecule of MB, bound at the PAS, near the entrance of the active-site gorge (Fig. 13, upper panels). The MB molecule is surrounded by six aromatic residues at a distance of <4 Å: Tyr70, Tyr121, Tyr334, Trp279, Phe330, and Phe331, all six of which are among the 14 conserved aromatic residues which line the active-site gorge49 (Fig. 13, lower left). In particular, MB forms a π–π stacking interaction with the indole ring of Trp 279, with a distance of 3.7 Å between the rings. Superposition of the MB/TcAChE structure on that of native TcAChE (PDB code 1EA5) shows that all the gorge main chains and side chains maintain their native conformation in the complex (data not shown).
Figure 13.
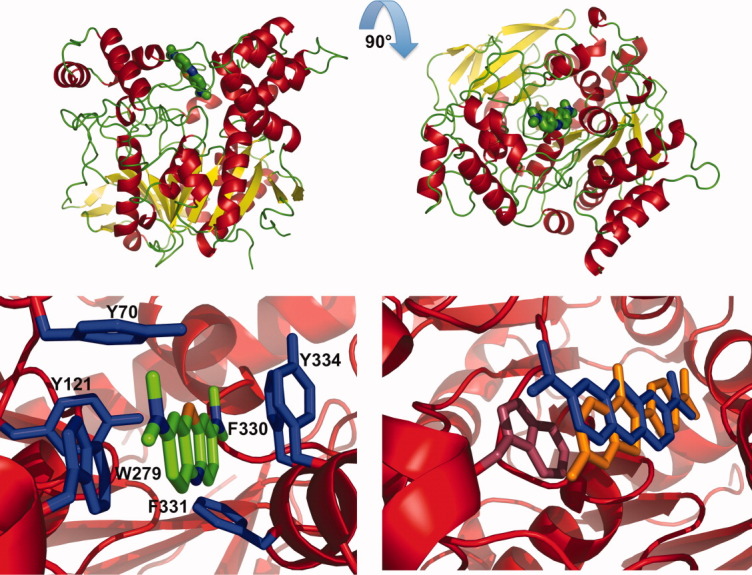
Crystal structure of the MB/TcAChE complex. Upper left: overall view of the complex. The TcAChE molecule is oriented with the entrance to the active-site gorge at the top. MB is seen in the PAS, where it is stacked against W279. MB carbon atoms are displayed in green, α-helices in red, β-sheets in yellow, and turns in green; upper right, same representation as upper left, but rotated by 90° around the x-axis so that the viewer is looking down the active-site gorge; lower left: view of the PAS in the MB/TcAChE complex. The enzyme is shown as a red ribbon, MB as a stick model with carbon atoms in green, nitrogen in blue and oxygen in red, and aromatic side chains as blue sticks. MB is within 4 Å of the six conserved aromatic residues displayed; lower right: superposition of the PAS regions of the MB/TcAChE and ThT/TcAChE complexes. MB is shown as blue sticks, ThT as orange sticks, and TcAChE in a red ribbon representation. The side chain of Trp279 is displayed in raspberry color. As the conformation of TcAChE in the crystal structures of the two complexes is practically identical, only that of the ThT/TcAChE structure (PDB code 2J3Q) is shown.
The structure of the MB/TcAChE complex was compared to that of the ThT/TcAChE complex,32 in which a single molecule of ThT is similarly bound at the PAS. The lower right panel in Figure 13 shows that the ThT and MB molecules in their respective complexes are almost superimposed, as had earlier been predicted.31 These structures differ from that obtained for the complex with TcAChE of tacrine, whose chemical structure is quite similar to that of MB (see Scheme 1). In the tacrine/TcAChE complex, the single tacrine molecule bound is stacked against both Trp 84 and Phe330 at the CAS.30, 46
Thus, while the kinetic and spectroscopic data obtained in solution showed that both PAS and CAS inhibitors could prevent binding of MB to TcAChE, suggesting that it might bind at both the CAS and the PAS, the X-ray data revealed only a single MB molecule, bound at the PAS.
Discussion
The use of photosensitizers for selective inactivation of targets in a clinical context is a rapidly developing area.14 In particular, PDT is providing novel therapeutic approaches to the treatment of malignancies.11 We earlier showed that TcAChE serves as a valuable model system for studying the effects of irradiative damage by nonspecific generation of ROS, namely, OH· radical16 and 1O2.21 Recently, we reported that MB produces targeted inactivation of TcAChE under irradiation.10
In this study, we have shown that MB is a strong reversible inhibitor in the dark, and utilized an extensive arsenal of techniques to characterize its binding properties and to clarify its site(s) of interaction.
As expected, binding of MB to TcAChE substantially raised its thermal stability (Fig. 11), and DSC measurements showed an increase in the temperature of the thermal transition, accompanied by a substantial increase in cooperativity (Fig. 12). This effect is similar to that observed with other reversible inhibitors binding at either the CAS or the PAS or spanning the two.46
Our main concern was to reconcile the data generated by the variety of experimental tools used, and to put forward a unified interpretation. As described under Results, binding of MB to TcAChE enzyme could be readily monitored spectroscopically, as it is accompanied by a 20-nm red shift in the absorption maximum of the probe [Fig. 2(A)]. This red shift could be reversed by displacement of the bound MB by a reversible inhibitor specific for the CAS, EDR, and by one specific for the PAS, PROP. However, neither inhibitor alone completely reversed the red shift. This could, however, be achieved by addition of the CAS and PAS inhibitors together, or by the potent gorge-spanning inhibitor, BW.34 The spectroscopic experiments in which MB was titrated with TcAChE irreversibly inhibited by either paraoxon or PBEPF also support binding of MB at the PAS, as the paraoxon conjugate produced a large red shift in MB, whereas the pyrenebutyl conjugate had a much more limited effect (Fig. 9). It is plausible that the bulky pyrene moiety stacks against W279 and impedes association of the conjugate with MB.
Data showing that MB could displace ligands binding at the TcAChE active site were also obtained using the fluorescent probe, MAC [Fig. 7(A,B)]. Moreover, MB itself strongly quenched the intrinsic Trp fluorescence that is believed to be associated with the Trp residue at the active site,39 which is now known to be Trp84 (Torpedo numbering).
The data obtained in the kinetic interference experiments in which MB competes with either EDR or with PROP on binding to TcAChE indicate that both CAS and PAS ligands affect the binding of MB to TcAChE. Thus, a mixture of either of these ligands with MB generated a Lineweaver–Burk plot that resembled the theoretical plot36 calculated on the assumption of mutual interference between the ligand and MB, whether at the CAS or PAS.
In view of the 1:1 stoichiometric ratio established for the inhibition of TcAChE by MB (Fig. 7), simultaneous binding of the ligand at the CAS and PAS is unlikely to occur. Strong support is provided by the crystal structure of the MB/TcAChE complex (Fig. 13, upper and lower left panels), which clearly shows a single MB molecule bound at the PAS, stacked against W279, in a position very similar to that assumed by ThT in its corresponding TcAChE complex32 (Fig. 13, lower right panel). This complex is further stabilized by a cation-π interaction with F330 (Fig. 13, lower left panel). In this conformation, the F330 should also hinder the binding of a second MB at the CAS. Conversely, if, using Autodock, MB is docked at the CAS, the F330 phenyl ring stacks against it in the model structure very similarly to F330 in the tacrine/TcAChE crystal structure (Fig. 14). Overall, the crystal structure of the MB/TcAChE, together with the docking data, do not seem to favor two MB molecules residing simultaneously within the active-site gorge of TcAChE, a conclusion consistent with the 1:1 stoichiometry of MB inhibition of enzymic activity.
Figure 14.
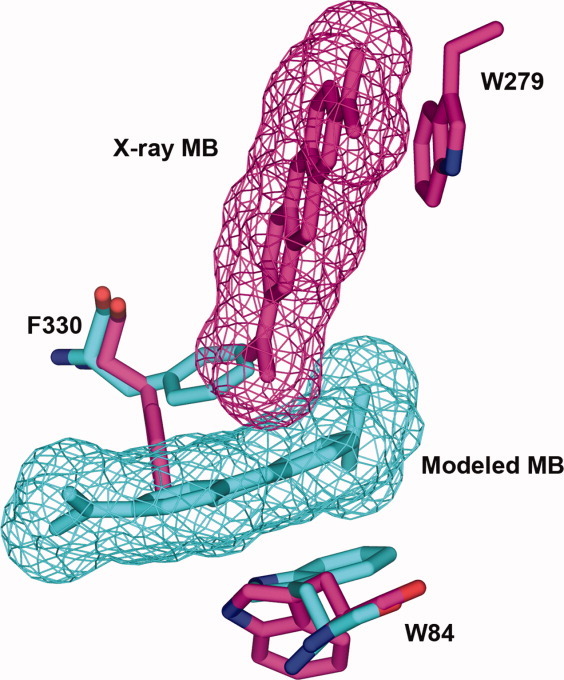
Overlay of the crystal structure of the MB/TcAChE complex and of a model structure in which MB is docked within the CAS. The overlay shows that the MB bound at the PAS (magenta) precludes simultaneous binding of a second MB at the CAS (cyan) due to its effect on the orientation of the phenyl group of F330.
In the EDR-TcAChE complex (2ACK.pdb), the phenyl group of F330 is not in close contact with either the quaternary nitrogen or the aromatic ring of EDR.30 Nevertheless, it is rotated 90° relative to its orientation in the native crystal structure (1EA5.pdb). Furthermore, replacement of the homologous aromatic residue by Ala in both human and mouse AChE, that is, generation of the Y337A mutant, decreases the affinity for EDR 10-15-fold.50, 51 Thus, in aqueous solution, F330 seems to influence the binding of EDR. As MB stacks against F330, and this interaction most likely contributes to the stabilization of the MB-TcAChE complex, it is plausible that at a sufficiently high concentration, EDR will interact preferentially with the phenyl ring of F330 in the MB-TcAChE complex, thus displacing MB from its location as seen in the crystal structure. Yet EDR does not completely displace MB from the gorge, and it may be conjectured that MB remains stacked against the indole ring of W279 in an altered orientation, from which it can only be completely displaced by PROP. Conversely, PROP cannot completely remove the bound MB due to the latter's interaction with F330. Thus, under the experimental conditions utilized, and the ligand concentrations used, only a mixture of EDR and PROP, or a gorge-spanning ligand, such as BW, can achieve the complete removal of MB from the active-site gorge. The fluorescence data displayed in Figures 7 and 8, which show that N-MAC is displaced by MB, can also be explained in structural terms. N-MAC may be assumed to bind at the CAS sandwiched between W84 and F330,39 analogously to tacrine.30 The conformation adopted by the phenyl ring of F330 in the MB complex should thus impede binding of N-MAC at the CAS just as it inhibits binding of a second MB molecule.
In a cellular environment, it is well documented that 1O2 reacts close to its site of generation.15 The data that we have presented here show that MB is acting within the active-site gorge of TcAChE, and suggest W279 as a likely target. It is, of course, important to know which other residues are photooxidized, and for this purpose, mass spectrometry provides a powerful tool.52
In conclusion, we have presented kinetic, physicochemical, structural, and computational evidence that the photosensitizing agent, MB, which is a potent reversible and irreversible inhibitor of TcAChE, as well as of other ChEs, exerts its effect(s) by binding to the PAS of the enzyme.
Materials and Methods
Materials
TcAChE was the dimeric (G2) glycosylphosphatidylinositol-anchored form from T. californica electric organ tissue, purified by affinity chromatography subsequent to solubilization with phosphatidylinositol-specific phospholipase C,53 as described earlier.46 Concentrations of stock solutions were determined by titration with paraoxon (O,O-diethyl-O-[4-nitrophenyl]phosphate.54
MB was obtained from Merck KGaA (Darmstadt, Germany), and recrystallized from ethyl acetate. ATC, 5,5′-dithiobis-(2-nitrobenzoic acid) (DTNB), sodium azide, PEG 200, 2-(N-morpholino)ethanesulfonic acid (MES), and bovine serum albumin were purchased from Sigma (St. Louis, MO), as were the reversible AChE inhibitors, EDR, decamethonium bromide, tacrine hydrochloride, d-tubocurarine chloride, and BW284c51 (BW), and the irreversible OP inhibitor, paraoxon. Propidium ethiodide was obtained from Calbiochem (San Diego, CA). FasII was purchased from Alomone Laboratories (Jerusalem, Israel). 1-PBEPF was prepared according to Amitai and coworkers.40 The chemical formulae of the principal probes used in this study are displayed in Scheme 1.
Determination of inhibition constants and number of binding sites
All inhibition studies of TcAChE by MB and other reversible ligands were performed in a 1-mL cuvette containing ∼0.025 nM TcAChE in 0.1M NaCl/10 mM sodium phosphate, pH 7.0 (buffer 1), containing 0.01% gelatin, at 25°C. The inhibition constant, KI, for inhibition of TcAChE by MB was determined by preincubating the enzyme with increasing concentrations of the ligand (10–90 nM) for 2 min in a dark compartment before measurement of residual enzymic activity. Measurement of activity was initiated by adding DTNB and ATC to final concentrations of 0.6 and 0.02–0.1 mM, respectively, in accordance with the protocol of Ellman and coworkers,55 followed by monitoring the increase in absorbance at 412 nm for 1.2 min.
Preparation of conjugates of PBEPF and paraoxon with TcAChE
An aliquot of 6 μL of 5 mM PBEPF in dry dioxane was added to 0.5 mL of 30 μm TcAChE in buffer 1 at room temperature. After 5 min, an Ellman assay revealed >99% inhibition. The solution was passed over a 10-mL Biogel P-6 to separate the enzyme conjugate from free PBEPF and its hydrolysis products. The peak protein fractions were pooled, and concentrated in a Cetnricon apparatus to a final concentration of 23 μm PBEP-TcAChE.
A diethylphosphoryl-TcAChE conjugate was prepared similarly by the addition of 10 μL of 2 × 10⁻⁵M paraoxon in ethanol to 0.5 mL of 23 μm TcAChE in buffer 1. As for the PBEP-TcAChE conjugate, >99% inhibition was obtained within 5 min. Gel filtration, followed by concentration of the pooled protein fractions, were also performed similarly, to yield a stock solution of 15-μm diethylphosphoryl-TcAChE.
Examination of competition between MB and other reversible inhibitors for binding to TcAChE
The competition between MB and two classical cationic ligands, EDR, which binds specifically at the CAS, located deep in the catalytic gorge, and PROP, a ligand specific for the peripheral anionic-site (PAS), was examined by comparing the Lineweaver–Burk plots of AChE activity versus ATC concentration under the following experimental conditions: (a) in the absence of inhibitor; (b) in the presence of a fixed concentration of MB; (c) in presence of a fixed concentration of the CAS or PAS ligand; (d) in presence of a mixture of the same concentrations of MB and of the same CAS and PAS ligands as used in (b) and (c). The Lineweaver–Burk plots obtained were compared with two theoretically distinguishable lines suggested by Krupka36 for two cases: (a) MB competes with the second ligand for the same binding site (interference); (b) Simultaneous binding of MB and the second ligand does not involve any steric overlap (no interference).
Photooxidation
Irreversible inactivation of TcAChE by photooxidation in the presence of MB was performed as described.10
Steady state spectroscopy
Absorption spectroscopy utilized a Uvikon 940 spectrophotometer (Kontron AG, Munich, Germany), and fluorescence measurements were performed on a Jasco FP-750 spectrofluorometer (Jasco, Easton, MD). All spectroscopic measurements were performed in buffer 1 at room temperature.
Differential scanning calorimetry
Calorimetric experiments utilized a MicroCal MC-2D differential scanning microcalorimeter (MicroCal, Northampton, MA) as described previously.22 All solutions were degassed by stirring under vacuum before scanning, and an overpressure of 2 atm of dry nitrogen was maintained over the liquid within the cell throughout the scan. The reversibility of the thermal transitions was checked by performing a second scan on the same sample, immediately after it had been cooled to room temperature. The molar excess heat capacity curves were smoothed and plotted using the Windows-based ORIGIN software package supplied by MicroCal (Northampton, MA), as described previously.46, 56
In our earlier study,44 we showed that thermal denaturation of TcAChE could only be adequately described by a two-state model,  , which considers only two significantly populated macroscopic states, the initial or native state (N) and the final or denatured (D) state, where k is a first-order kinetic constant that changes with temperature, as given by the Arrhenius equation: k = exp[EA(1/T* − 1/T)/R], where EA is the energy of activation, and T* is the temperature at which the rate constant equals 1 min−1 (for details see Ref. 47).
X-Ray crystallography
Trigonal crystals of TcAChE49 were soaked for 20 h at 4°C in 2 μL of 2.5 mM MB dissolved in the crystallization solution [46% PEG 200 (v/v)/100 mM MES, pH 6.5], using the hanging drop procedure.57 The crystals were then transferred to cryoprotectant oil and flash cooled in a stream of liquid nitrogen, using a Oxford Cryosystems apparatus.
Data collection was performed “in-house,” using a RIGAKU RU-H3R running at 50 kV/100 mA with Osmic blue confocal optics at 120 K. Diffraction images were recorded on a RAXIS-IV++. DENZO and SCALEPACK were used to integrate and scale the data.58 Data were truncated with the CCP4 program TRUNCATE,59 and 5.2% of the reflections were randomly used as test reflections.
A model of MB was constructed using the GaussView 3.09 program (Gaussian, Carnegie, PA), and converted to a pdb file format using Babel.60
Rigid body refinement in CCP461 was based on a previously solved trigonal crystal form of native TcAChE (PDB code 1EA5), excluding water molecules and carbohydrates. Initial 2Fo–Fc and Fo–Fc electron density maps were calculated using 30–2.4 Å data, and the initial Fo–Fc map was used, with the aid of the program Coot,62 to fit MB into positive density at the entrance to the active-site gorge of the enzyme, and to add 101 water molecules. Subsequent rounds of restrained refinement with overall B-factor refinement were performed, and 56 carbohydrate atoms were added, until convergence to values of Rwork = 19.96% and Rfree = 24.54% (Rfree was as defined by Brunger63). As analyzed by Molprobity,64 96.0% of all residues are in favored regions, and 99.6% in allowed regions of the Ramachandran plot, the only outliers being Asp380 and Asn457, which are both glycosylated surface residues. Table II displays the data collection and refinement statistics. The crystal structure of the MB/TcAChE complex has been deposited in the PDB with access code 2W9I.
Table II.
Data Collection and Refinement Statistics for the MB/TcAChE Complex
| Data collection | |
| Space group | P3121 |
| Cell parameters (Å) | a = 111.1 |
| b = 111.4 | |
| c = 137.1 | |
| Molecules (a.u.) | 1 |
| Resolution (Å) | 30–2.43 |
| Total reflections | 848,294 |
| Unique reflections | 35,368 |
| Completeness (%)a | 99.9 (97.2) |
| Avg. I/σ(I) | 34.8 (5.55) |
| Rmerge (%)b | 5.6 |
| Refinement statistics | |
| R (%)c | 19.96 |
| Rfree (%) | 24.54 (5.2% of data) |
| RMSD, bond lengths (Å) | 0.019 |
| RMSD, bond angles (°) | 1.98 |
| PDB code 2w9i | |
Values in parentheses relate to the highest resolution shell, 2.52–2.43 Å.
Rmerge = Σ|I − 〈I〉|/ΣI, where I is the observed intensity, and 〈I〉 is the average intensity obtained from multiple observations of symmetry-related reflections after rejections.
R = Σ||Fo| − ||Fc||/Σ|Fo|, where Fo and Fc are the observed and calculated structure factors, respectively.
Computer docking and MD simulations
MB was docked into the protein conformation extracted from the X-ray structure of the tacrine/TcAChE complex (pdb code 1ACJ)30 by use of the AutoDock program.65, 66 The docked MB overlaid well at the location of tacrine in the complex. As the conformation of the protein during the docking process is fixed, and MB is larger than tacrine, an MD simulation was performed based on the docked MB/TcAChE complex. The complex, together with the crystal water molecules included in the 1ACJ structure were inserted into a box of dimensions 10.6 × 10.6 × 10.6 nm3, with the minimal distance of the protein from its walls being 2.0 nm. This box was solvated by use of a simple point-charge water model,67 and the resulting solvated box then submitted to energy minimization. Counterions were subsequently added, to provide a neutral simulation system. Energy minimization was then repeated on the whole system. After convergence had been reached, the solvent, the counterions and the protein, as well as MB, were coupled separately to a temperature bath at 300 K. The whole system was then equilibrated for 10 ns. MD simulations were carried out with the GROMACS package68, 69 as described earlier.70
Acknowledgments
JLS is the Morton and Gladys Pickman Professor of structural biology.
Supplementary material
Additional Supporting Information may be found in the online version of this article.
References
- 1.Bonnett R. Photosensitizers of the porphyrin and phthakocyanine series for photodynamic therapy. Chem Soc Rev. 1995;24:19–33. [Google Scholar]
- 2.Lavie G, Kaplinsky C, Toren A, Aizman I, Meruelo D, Mazur Y, Mandel M. A photodynamic pathway to apoptosis and necrosis induced by dimethyl tetrahydroxy helianthrone and hypericin in leukemic cells. Possible relevance to photodynamic therapy. Br J Cancer. 1999;79:423–432. doi: 10.1038/sj.bjc.6690066. [DOI] [PMC free article] [PubMed] [Google Scholar]
- 3.Rahimipour S, Gescheidt G, Bilkis I, Fridkin M, Weiner L. Towards the efficiency of pharmacologically active quinoid compounds: electron transfer and formation of reactive oxygen species formation. Appl Magn Reson. 2010;37:629–648. [Google Scholar]
- 4.Adibhatla RM, Hatcher JF. Lipid oxidation and peroxidation in CNS health and disease: from molecular mechanisms to therapeutic opportunities. Antioxid Redox Signal. 2010;12:125–169. doi: 10.1089/ars.2009.2668. [DOI] [PubMed] [Google Scholar]
- 5.Avery SV. Molecular targets of oxidative stress. Biochem J. 2011;434:201–210. doi: 10.1042/BJ20101695. [DOI] [PubMed] [Google Scholar]
- 6.Hertzberg RP, Dervan PB. Cleavage of double helical DNA by (methidiumpropyl-EDTA)iron(II) J Am Chem Soc. 1982;104:313–315. [Google Scholar]
- 7.Weiner LM. Oxygen radicals generation and DNA scission by anticancer and synthetic quinones. Methods Enzymol. 1994;233:92–105. doi: 10.1016/s0076-6879(94)33011-5. [DOI] [PubMed] [Google Scholar]
- 8.Stadtman ER. Oxidation of free amino acids and amino acid residues in proteins by radiolysis and by metal-catalyzed reactions. Ann Rev Biochem. 1993;62:797–821. doi: 10.1146/annurev.bi.62.070193.004053. [DOI] [PubMed] [Google Scholar]
- 9.Davies MJ. The oxidative environment and protein damage. Biochim Biophys Acta. 2005;1703:93–109. doi: 10.1016/j.bbapap.2004.08.007. [DOI] [PubMed] [Google Scholar]
- 10.Weiner L, Roth E, Silman I. Targeted oxidation of Torpedo californica acetylcholinesterase by singlet oxygen. Photochem Photobiol. 2011;87:308–316. doi: 10.1111/j.1751-1097.2010.00857.x. [DOI] [PubMed] [Google Scholar]
- 11.Dougherty TJ. Photosensitizers: therapy and detection of malignant tumors. Photochem Photobiol. 1987;45:879–889. doi: 10.1111/j.1751-1097.1987.tb07898.x. [DOI] [PubMed] [Google Scholar]
- 12.Kreitman RJ. Immunotoxins for targeted cancer therapy. AAPS J. 2006;18:E532–E551. doi: 10.1208/aapsj080363. [DOI] [PMC free article] [PubMed] [Google Scholar]
- 13.Lev-Goldman V, Mester B, Ben-Aroya N, Hanoch T, Rupp B, Stanoeva T, Gescheidt G, Seger R, Koch Y, Weiner L, Fridkin M. Conjugates of gonadotropin releasing hormone (GnRH) with carminic acid: synthesis, generation of reactive oxygen species (ROS) and biological evaluation. Bioorg Med Chem. 2008;16:6789–6798. doi: 10.1016/j.bmc.2008.05.057. [DOI] [PubMed] [Google Scholar]
- 14.Lee J, Udugamasooriya DG, Lim H-S, Kodadek T. Potent and selective photo-inactivation of proteins with peptoid-ruthenium conjugates. Nat Chem Biol. 2010;10:258–260. doi: 10.1038/nchembio.333. [DOI] [PMC free article] [PubMed] [Google Scholar]
- 15.Ogilby PR. Singlet oxygen: there is indeed something new under the sun. Chem Soc Rev. 2010;39:3181–3209. doi: 10.1039/b926014p. [DOI] [PubMed] [Google Scholar]
- 16.Lloyd RV, Hanna PM, Mason RP. The origin of the hydroxyl radical oxygen in the Fenton reaction. Free Radic Biol Med. 1997;22:885–888. doi: 10.1016/s0891-5849(96)00432-7. [DOI] [PubMed] [Google Scholar]
- 17.Weiner L, Kreimer D, Roth E, Silman I. Oxidative stress transforms acetylcholinesterase to a molten-globule-like state. Biochem Biophys Res Commun. 1994;198:915–922. doi: 10.1006/bbrc.1994.1130. [DOI] [PubMed] [Google Scholar]
- 18.Dolginova EA, Roth E, Silman I, Weiner LM. Chemical modification of Torpedo acetylcholinesterase by disulfides: appearance of a “molten globule” state. Biochemistry. 1992;31:12248–12254. doi: 10.1021/bi00163a039. [DOI] [PubMed] [Google Scholar]
- 19.Kreimer DI, Dolginova EA, Raves M, Sussman JL, Silman I, Weiner L. A metastable state of Torpedo californica acetylcholinesterase generated by modification with organomercurials. Biochemistry. 1994;33:14407–14418. doi: 10.1021/bi00252a006. [DOI] [PubMed] [Google Scholar]
- 20.Miskovsky P. Hypericin—a new antiviral and antitumor photosensitizer: mechanism of action and interaction with biological macromolecules. Curr Drug Targets. 2002;3:55–84. doi: 10.2174/1389450023348091. [DOI] [PubMed] [Google Scholar]
- 21.Weiner L, Roth E, Mazur Y, Silman I. Targeted cross-linking of a molten globule form of acetylcholinesterase by the virucidal agent hypericin. Biochemistry. 1999;38:11401–11405. doi: 10.1021/bi991147+. [DOI] [PubMed] [Google Scholar]
- 22.Millard CB, Shnyrov VL, Newstead S, Shin I, Roth E, Silman I, Weiner L. Stabilization of a metastable state of Torpedocalifornica acetylcholinesterase by chemical chaperones. Protein Sci. 2003;12:2337–2347. doi: 10.1110/ps.03110703. [DOI] [PMC free article] [PubMed] [Google Scholar]
- 23.Weik M, Ravelli RBG, Kryger G, McSweeney S, Raves ML, Harel M, Gros P, Silman I, Kroon J, Sussman JL. Specific chemical and structural damage to proteins by synchrotron radiation. Proc Natl Acad Sci USA. 2000;97:623–628. doi: 10.1073/pnas.97.2.623. [DOI] [PMC free article] [PubMed] [Google Scholar]
- 24.Tomlinson GM, Cummings D, Hryshko L. Photoinactivation of acetylcholinesterase by erythrosin B and related compounds. Biochem Cell Biol. 1986;64:515–522. doi: 10.1139/o86-072. [DOI] [PubMed] [Google Scholar]
- 25.Allen MT, Lynch M, Lagos A, Redmond RW, Kochevar IE. A wavelength dependent mechanism for rose bengal-sensitized photoinhibition of red cell acetylcholinesterase. Biochim Biophys Acta. 1991;1075:42–49. doi: 10.1016/0304-4165(91)90072-o. [DOI] [PubMed] [Google Scholar]
- 26.Mellish KJ, Cox RD, Vernon DI, Griffiths J, Brown SB. In vitro photodynamic activity of a series of methylene blue analogues. Photochem Photobiol. 2002;75:392–397. doi: 10.1562/0031-8655(2002)075<0392:ivpaoa>2.0.co;2. [DOI] [PubMed] [Google Scholar]
- 27.Augustinsson K-B. Methylene blue as an inhibitor of acetylcholine-esterase. Acta Chem Scand. 1950;4:536–542. [Google Scholar]
- 28.Küçükkilinç T, Ozer I. Multi-site inhibition of human plasma cholinesterase by cationic phenoxazine and phenothiazine dyes. Arch Biochem Biophys. 2007;461:294–298. doi: 10.1016/j.abb.2007.02.029. [DOI] [PubMed] [Google Scholar]
- 29.Yücel YY, Tacal O, Ozer I. Comparative effects of cationic triarylmethane, phenoxazine and phenothiazine dyes on horse serum butyrylcholinesterase. Arch Biochem Biophys. 2008;478:201–205. doi: 10.1016/j.abb.2008.07.006. [DOI] [PubMed] [Google Scholar]
- 30.Harel M, Schalk I, Ehret-Sabatier L, Bouet F, Goeldner M, Hirth C, Axelsen PH, Silman I, Sussman JL. Quaternary ligand binding to aromatic residues in the active-site gorge of acetylcholinesterase. Proc Natl Acad Sci USA. 1993;90:9031–9035. doi: 10.1073/pnas.90.19.9031. [DOI] [PMC free article] [PubMed] [Google Scholar]
- 31.Wildman SA, Zheng X, Sept D, Auletta JT, Rosenberry TL, Marshall GR. Drug-like leads for steric discrimination between substrate and inhibitors of human acetylcholinesterase. Chem Biol Drug Des. 2011;78:495–504. doi: 10.1111/j.1747-0285.2011.01157.x. [DOI] [PubMed] [Google Scholar]
- 32.Harel M, Sonoda LK, Silman I, Sussman JL, Rosenberry TL. Crystal structure of thioflavin T bound to the peripheral site of Torpedo californica acetylcholinesterase reveals how thioflavin T acts as a sensitive fluorescent reporter of ligand binding to the acylation site. J Am Chem Soc. 2008;130:7856–7861. doi: 10.1021/ja7109822. [DOI] [PMC free article] [PubMed] [Google Scholar]
- 33.Bourne Y, Taylor P, Radic Z, Marchot P. Structural insights into ligand interactions at the acetylcholinesterase peripheral anionic site. EMBO J. 2003;22:1–12. doi: 10.1093/emboj/cdg005. [DOI] [PMC free article] [PubMed] [Google Scholar]
- 34.Felder CE, Harel M, Silman I, Sussman JL. Structure of a complex of the potent and specific inhibitor BW284C51 with Torpedo californica acetylcholinesterase. Acta Crystallogr D. 2002;58:1765–1771. doi: 10.1107/s0907444902011642. [DOI] [PubMed] [Google Scholar]
- 35.Rosenberry TL. Strategies to resolve the catalytic mechanism of acetylcholinesterase. J Mol Neurosci. 2010;40:32–39. doi: 10.1007/s12031-009-9250-3. [DOI] [PubMed] [Google Scholar]
- 36.Krupka RM. Fluoride inhibition of acetylcholinesterase. Mol Pharmacol. 1966;2:558–569. [PubMed] [Google Scholar]
- 37.Segel IH. Biochemical calculations. New York, NY: Wiley; 1976. [Google Scholar]
- 38.Mooser G, Schulman H, Sigman DS. Fluorescent probes of acetylcholinesterase. Biochemistry. 1972;11:1595–1602. doi: 10.1021/bi00759a008. [DOI] [PubMed] [Google Scholar]
- 39.Shinitzky M, Dudai Y, Silman I. Spectral evidence for the presence of tryptophan in the binding site of acetylcholinesterase. FEBS Lett. 1973;30:125–128. doi: 10.1016/0014-5793(73)80633-7. [DOI] [PubMed] [Google Scholar]
- 40.Amitai G, Ashani Y, Gafni A, Silman I. Novel pyrene-containing organophosphates as fluorescent probes for studying aging-induced conformational changes in organophosphate inhibited acetylcholinesterase. Biochemistry. 1982;21:2060–2069. doi: 10.1021/bi00538a013. [DOI] [PubMed] [Google Scholar]
- 41.Cerveñansky C, Dajas F, Harvey AL, Karlsson E. Fasciculins, anticholinesterase toxins from snake venoms: biochemistry and pharmacology. In: Harvey AL, editor. Snake toxins. New York, NY: Pergamon Press; 1991. pp. 131–164. [Google Scholar]
- 42.Bourne Y, Taylor P, Marchot P. Acetylcholinesterase inhibition by fasciculin: crystal structure of the complex. Cell. 1995;83:503–512. doi: 10.1016/0092-8674(95)90128-0. [DOI] [PubMed] [Google Scholar]
- 43.Harel M, Kleywegt GJ, Ravelli RBG, Silman I, Sussman JL. Crystal structure of an acetylcholinesterase-fasciculin complex: interaction of a three-fingered toxin from snake venom with its target. Structure. 1995;3:1355–1366. doi: 10.1016/s0969-2126(01)00273-8. [DOI] [PubMed] [Google Scholar]
- 44.Kreimer DI, Shnyrov VL, Villar E, Silman I, Weiner L. Irreversible thermal denaturation of Torpedo californica acetylcholinesterase. Protein Sci. 1995;4:2349–2357. doi: 10.1002/pro.5560041113. [DOI] [PMC free article] [PubMed] [Google Scholar]
- 45.Kreimer DI, Shin I, Shnyrov VL, Villar E, Silman I, Weiner L. Two partially unfolded states of Torpedo californica acetylcholinesterase. Protein Sci. 1996;5:1852–1864. doi: 10.1002/pro.5560050911. [DOI] [PMC free article] [PubMed] [Google Scholar]
- 46.Weiner L, Shnyrov VL, Konstaninovskii L, Roth E, Ashani Y, Silman I. Stabilization of Torpedo californica acetylcholinesterase by reversible inhibitors. Biochemistry. 2009;48:563–574. doi: 10.1021/bi801196y. [DOI] [PubMed] [Google Scholar]
- 47.Kurganov BI, Lyubarev AE, Sanchez-Ruiz JM, Shnyrov VL. Analysis of differential scanning calorimetry data for proteins. Criteria of validity of one-step mechanism of irreversible protein denaturation. Biophys Chem. 1997;69:125–135. doi: 10.1016/s0301-4622(97)80552-2. [DOI] [PubMed] [Google Scholar]
- 48.Sanchez-Ruiz JM. Protein kinetic stability. Biophys Chem. 2010;148:1–15. doi: 10.1016/j.bpc.2010.02.004. [DOI] [PubMed] [Google Scholar]
- 49.Sussman JL, Harel M, Frolow F, Oefner C, Goldman A, Toker L, Silman I. Atomic structure of acetylcholinesterase from Torpedo californica: a prototypic acetylcholine-binding protein. Science. 1991;253:872–879. doi: 10.1126/science.1678899. [DOI] [PubMed] [Google Scholar]
- 50.Ordentlich A, Barak D, Kronman C, Flashner Y, Leitner M, Segall Y, Ariel N, Cohen S, Vela B, Shafferman A. Dissection of the human acetylcholinesterase active center determinants of substrate specifity. Identification of residues constituting the anionic site, the hydrophobic site, and the acyl pocket. J Biol Chem. 1993;268:17083–17095. [PubMed] [Google Scholar]
- 51.Radic Z, Pickering NA, Vellom DC, Camp S, Taylor P. Three distinct domains in the cholinesterase molecule confer selectivity for acetyl- and butyrylcholinesterase inhibitors. Biochemistry. 1993;32:12074–12084. doi: 10.1021/bi00096a018. [DOI] [PubMed] [Google Scholar]
- 52.Triquigneaux M, Ehrenshaft M, Weiner L, Roth E, Silman I, Mason R, Deterding L. 2011. Specific oxidation of Torpedo californica acetylcholinesterase by singlet oxygen: identification of N-formyl-kynurenine tryptophan derivatives by mass spectrometry. Abstracts 18th Annual Meeting SFRBM, Atlanta, GA, Nov 2011. [DOI] [PMC free article] [PubMed]
- 53.Sussman JL, Harel M, Frolow F, Varon L, Toker L, Futerman AH, Silman I. Purification and crystallization of a dimeric form of acetylcholinesterase from Torpedo californica subsequent to solubilization with phosphatidylinositol-specific phospholipase C. J Mol Biol. 1988;203:821–823. doi: 10.1016/0022-2836(88)90213-6. [DOI] [PubMed] [Google Scholar]
- 54.Ralston JS, Rush RS, Doctor BP, Wolfe AD. Acetylcholinesterase from fetal bovine serum. Purification and characterization of soluble G4 enzyme. J Biol Chem. 1985;260:4312–4318. [PubMed] [Google Scholar]
- 55.Ellman GL, Courtney KD, Andres V, Jr, Featherstone RM. A new and rapid colorimetric determination of acetylcholinesterase activity. Biochem Pharmacol. 1961;7:88–95. doi: 10.1016/0006-2952(61)90145-9. [DOI] [PubMed] [Google Scholar]
- 56.Zamorano LS, Pina DG, Arellano JB, Bursakov SA, Zhadan AP, Calvete JJ, Sanz L, Nielsen PR, Villar E, Gavel O, Roig MG, Watanabe L, Polikarpov I, Shnyrov VL. Thermodynamic characterization of the palm tree Roystonea regia peroxidase stability. Biochimie. 2008;90:1737–1749. doi: 10.1016/j.biochi.2008.07.010. [DOI] [PubMed] [Google Scholar]
- 57.McPherson A. Preparation and analysis of protein crystals. New York, NY: Wiley; 1982. [Google Scholar]
- 58.Otwinowski Z, Minor W. Processing of x-ray diffraction data collected in oscillation mode. Methods Enzymol. 1997;276:307–326. doi: 10.1016/S0076-6879(97)76066-X. [DOI] [PubMed] [Google Scholar]
- 59.French GS, Wilson KS. On treatment of negative intensity observations. Acta Crystallogr A. 1978;34:517–525. [Google Scholar]
- 60.Walters P, Stahl M. Babel, version 1.1. Tucson, AZ: Department of Chemistry, University of Arizona; 1994. [Google Scholar]
- 61.The CCP4 suite: programs for protein crystallography. Acta Crystallogr D. 1994;50:760–763. doi: 10.1107/S0907444994003112. [DOI] [PubMed] [Google Scholar]
- 62.Emsley P, Cowtan K. Coot: model-building tools for molecular graphics. Acta Crystallogr D. 2004;60:2126–2132. doi: 10.1107/S0907444904019158. [DOI] [PubMed] [Google Scholar]
- 63.Brunger AT. Assessment of phase accuracy by cross validation: the free R value. Methods and applications. Acta Crystallogr D. 1993;49:24–36. doi: 10.1107/S0907444992007352. [DOI] [PubMed] [Google Scholar]
- 64.Davis IW, Leaver-Fay A, Chen VB, Block JN, Kapral GJ, Wang X, Murray LW, Arendall WB, III, Snoeyink J, Richardson JS, Richardson DC. MolProbity: all-atom contacts and structure validation for proteins and nucleic acids. Nucleic Acids Res. 2007;35:W375–W383. doi: 10.1093/nar/gkm216. [DOI] [PMC free article] [PubMed] [Google Scholar]
- 65.Goodsell DS, Olson AJ. Automated docking of substrate to proteins by simulated annealing. Proteins: Struct Funct Genet. 1990;8:195–202. doi: 10.1002/prot.340080302. [DOI] [PubMed] [Google Scholar]
- 66.Morris GM, Goodsell DS, Halliday RS, Huey R, Hart WE, Belew RK, Olson AJ. Automated docking using a Lamarckian genetic algorithm and an empirical binding free energy function. J Comp Chem. 1998;19:1639–1662. [Google Scholar]
- 67.Berendsen HJC, Postma JPM, van Gunsteren WF, Hermans J. In: Intermolecular forces. Pullman B, editor. Dordrecht, Holland: Reidel Publishing Company; 1981. pp. 331–342. Interaction models for water in relation to protein hydration. [Google Scholar]
- 68.Berendsen HJC, van der Spoel D, van Drunen R. GROMACS: a message-passing parallel molecular dynamics implementation. Comp Phys Commun. 1995;91:43–56. [Google Scholar]
- 69.Lindahl E, Hess B, van der Spoel D. Gromacs 3.0: a package for molecular simulation and trajectory analysis. J Mol Model. 2001;7:306–317. [Google Scholar]
- 70.Xu Y, Colletier J-P, Weik, Qin G, Jiang H, Silman I, Sussman JL. Long route or shortcut? A molecular dynamics study of traffic of thiocholine within the active-site gorge of acetylcholinesterase. Biophys J. 2010;99:4003–4011. doi: 10.1016/j.bpj.2010.10.047. [DOI] [PMC free article] [PubMed] [Google Scholar]
Associated Data
This section collects any data citations, data availability statements, or supplementary materials included in this article.