



Abstract
Background
Bladder cancer (BCa) is among the five most common malignancies world-wide, and due to high rates of recurrence, one of the most prevalent. Improvements in non-invasive urine-based assays to detect BCa would benefit both patients and healthcare systems. In this study, the goal was to identify urothelial cell transcriptomic signatures associated with BCa.
Methods
Gene expression profiling (Affymetrix U133 Plus 2.0 arrays) was applied to exfoliated urothelia obtained from a cohort of 92 subjects with known bladder disease status. Computational analyses identified candidate biomarkers of BCa and an optimal predictive model was derived. Selected targets from the profiling analyses were monitored in an independent cohort of 81 subjects using quantitative real-time PCR (RT-PCR),
Results
Transcriptome profiling data analysis identified 52 genes associated with BCa (p≤0.001), and gene models that optimally predicted class label were derived. RT-PCR analysis of 48 selected targets in an independent cohort identified a 14-gene diagnostic signature that predicted the presence of BCa with high accuracy.
Conclusions
Exfoliated urothelia sampling provides a robust analyte for the evaluation of patients with suspected BCa. The refinement and validation of the multi-gene urothelial cell signatures identified in this preliminary study may lead to accurate, non-invasive assays for the detection of BCa.
Impact
The development of an accurate, non-invasive BCa detection assay would benefit both the patient and healthcare systems through better detection, monitoring and control of disease.
Keywords: Genomic profiling, Bladder cancer, Urinalysis, Non-invasive detection
INTRODUCTION
Bladder cancer (BCa) is among the five most common malignancies worldwide (1). The current primary diagnostic approach to BCa is cystoscopy coupled with voided urine cytology (VUC). Cystoscopy is an uncomfortable, invasive procedure associated with significant cost and possible infection and trauma. VUC remains the method of choice for the non-invasive detection of BCa. Yet while the assay has good specificity, VUC sensitivity is suboptimal, especially for low-grade and low-stage tumors (1, 2). A number of urine-based diagnostic protein markers have been developed commercially, but single biomarker assays lack adequate power to replace VUC and/or cystoscopy. This is not surprising given the redundancy of signaling pathways, the cross-talk between molecular networks, and the oligoclonality of tumors. Thus it is postulated that the identification of alternative biomarkers for the detection of BCa in urine may benefit from a more genome-wide analytical strategy.
In a previous pilot study of 46 cases (3), we demonstrated the feasibility of gene expression profiling of exfoliated urothelia and developed an analytical approach to identify cancer-associated gene signatures. In this study, we have expanded the genome-wide expression profiling to 92 subjects (52 with confirmed BCa). Parallel computational analyses were applied to identify BCa-associated biomarkers and to derive multiplex diagnostic models. Selected candidate biomarkers were verified in an independent cohort of 81 subjects (44 BCa cases) monitoring transcripts in urothelial cells obtained from naturally voided urine using quantitative real-time PCR (RT-PCR). An optimal diagnostic signature comprised of 14-genes achieved a high degree of accuracy. This discovery phase study shows the feasibility and potential of using urothelial cell gene expression signatures for the non-invasive detection of BCa. Validation of the association of these models in larger and more diverse cohorts representing all urological disease states could lead to robust and accurate, non-invasive tests for BCa diagnosis.
METHODS
Clinical sampling and processing
Under IRB approval and informed consent, urine samples and associated clinical information were prospectively collected into a tissue bank. Two different clinical cohorts were analyzed in this study. The first group (cohort 1) consisted of 40 individuals with no previous history of urothelia cell carcinoma, gross hematuria, active urinary tract infection or urolithiasis (controls) and 52 individuals with newly diagnosed primary urothelia cell carcinoma. The second group (cohort 2) was comprised of 37 individuals with no previous history of urothelia cell carcinoma, gross hematuria, active urinary tract infection or urolithiasis (controls), and 44 individuals with newly diagnosed primary urothelia cell carcinoma. All subjects were evaluated in the urology outpatient clinic, presenting with hematuria or voiding symptoms. All subjects underwent office cystoscopy, urinalysis and VUC, and the majority also had axial imaging of the abdomen and pelvis. Furthermore, in our cancer group, histological confirmation of urothelial cell carcinoma, including grade and stage was noted from excised tissue. In the discovery cohort, 50 ml of saline bladder barbotaged obtained during cystoscopy was collected into a sterile cup, stored at 4°C until it was processed (<3 hrs). For the second cohort, 50 ml of midstream voided urine was collected in a sterile cup, stored at 4°C until it was processed (<3 hrs). Specimens with grossly visible blood were excluded. Pertinent information on clinical presentation and outcome were recorded. A summary of clinical data is given in Table 1. Each sample was assigned a unique identifying number before laboratory processing, as previously described.(3) Laboratory personnel were blinded to final diagnosis.
Table 1.
Demographic and clinicopathologic characteristics of two study cohorts
| Cohort 1
|
Cohort 2
|
|||
|---|---|---|---|---|
| Noncancer (%) N=40 | Cancer (%) N=52 | Noncancer (%) N=37 | Cancer (%)N=44 | |
|
|
|
|||
| Median Age (range, y) | 69 (30–90) | 68 (36–90) | 69 (19–79) | 67 (47–90) |
| Male/Female ratio | 26:14 | 42:10 | 21:16 | 36:8 |
| Race | ||||
| White | 30 (75) | 48 (92) | 32 (86) | 40 (91) |
| African American | 7 (18) | 3 (6) | 4 (11) | 3 (7) |
| Other | 3 (7) | 1 (1) | 1 (3) | 1 (2) |
| Tobacco history | 22 (55) | 46 (88) | 16 (43) | 33 (75) |
| Suspicious/positive cytology | 0 (0) | 16 (31) | 0 (0) | 12(27) |
| Clinical stage | ||||
| Tis | n/a | 3 (6) | n/a | 0 (0) |
| Ta | n/a | 11 (21) | n/a | 9 (20) |
| T1 | n/a | 16 (31) | n/a | 8 (18) |
| T2 | n/a | 22 (42) | n/a | 24 (55) |
| T3 | n/a | 0 (0) | n/a | 3 (7) |
| Grade | ||||
| 1/2 | n/a | 9 (16) | n/a | 7 (16) |
| 3 | n/a | 43 (84) | n/a | 37 (84) |
Gene expression profiling
Gene expression profiling was performed on Affymetrix Human Genome arrays (U133 Plus 2.0) according to standard protocols (Affymetrix, Santa Clara, CA). All microarray data obtained in the course of this study have been deposited in NCBI’s Gene Expression Omnibus (4) and are accessible through GEO Series accession number GSE31189. Conventional comparative analysis of gene expression data for association of genes with BCa was performed as previously described (3, 5, 6). Briefly, the two-sample Welch t statistics that allows unequal variances was used to identify genes that were differentially expressed between normal and tumor samples. The p-value was used to assess the statistical significance for each gene. To correct for multi-testing errors, the family-wise error rate (FWER) was employed following a permutation based bootstrap step-down minP procedure.
Derivation of a diagnostic gene signature from microarray data
To derive optimal multi-gene diagnostic signatures from the microarray data, we applied the LoGo feature selection algorithm (7, 8). To avoid possible over-fitting of computational models to training data, we used the leave-one-out cross validation (LOOCV) method to estimate classifier parameters and prediction performance (9). A receiver operating characteristic (ROC) curve (10), obtained by varying a decision threshold, was used to provide a direct view of how a prediction model performed at different sensitivity and specificity levels, and significance between groups was evaluated using t-tests.
Quantitative Real-Time PCR analysis
Purified RNA samples were evaluated quantitatively and qualitatively using an Agilent Bioanalyzer 2000. Complementary DNA was synthesized from 20 to 500 ng of total RNA, using the High Capacity cDNA Reverse Transcriptase Kit (Applied Biosystems, Foster City) following the manufacturer’s instructions, with random primers in a total reaction volume of 20μl.
Selection of Endogenous Reference Controls
An aliquot of each sample cDNA was used in a multiplex RT-PCR preamplification reaction of 15 endogenous reference targets: GAPDH; ACTB; B2M; GUSB; HMBS; HPRT1; IPO8; PGK1; POLR2A; PPIA; RPLP0; TBP; TFRC; UBC; YWHAZ. The 15 TaqMan Gene Expression Assays were pooled together at 0.2X final concentration. Subsequently, 12.5 μl of the pooled assay mix (0.2X) was combined with 4 μl of each cDNA sample and 25 μl of the TaqMan PreAmp Master Mix (2X) in a final volume of 50 μl. Thermal cycling conditions were as follows: initial hold at 95°C during 10 minutes and ten preamplification cycles of 15 seconds at 95°C and 4 minutes at 60°C. The preamplification products were diluted 1:5 with TE buffer prior to singleplex reaction amplification using the TaqMan® Human Endogenous Control Array (Applied Biosystems PN 4367563), a 384-well micro fluidic card containing the 15 genes listed above plus 18S RNA. The reactions were performed on a 7900HT Fast Real-Time PCR System (AB). Genes with the least variable expression across all 81 samples (UBC; PPIA; PGK1; GAPDH) were identified using GeNorm software (Integromics, Granada, Spain) and subsequently selected for the 48-target custom TaqMan Low Density Array (TLDA). The TLDA format is a 384-well system that uses standard TaqMan assays and enables automated loading and high-throughput analyses (11).
Custom array preamplification and amplification reactions
TLDAs were constructed by Applied Biosystems (AB) using pre-designed assays whose probe would span exons. Targets included were: UBC; PPIA; PGK1; GAPDH (4 Endogenous controls); BIRC5; TERT; KRT20; CLU; PLAU; CALR; ANG; CA9; SCG3; ATF3; TLR2; AGT; DMBT1; ERBB2; CTNNA1; ATM; FBXO9; CCNE2; NUSAP1; SNAI2; PLOD2; MMP12; IL1RAP; ITGB5; DSC2; APOE; TMEM45A; SYNGR1; MMP10; IL8; VEGFA; CPA1; CCL18; CRH; MCOLN1 SERPINE1 MMP1; MMP9; FGF22; MXRA8; NRG3; SEMA3D; PTX3; RAB1A (44 biomarker targets). A multiplex RT-PCR preamplification reaction was performed using the pooled 48 TaqMan Gene Expression Assays. Assay reagents at 0.2X final concentration were combined with 7.5 μl of each cDNA sample and 15 μl of the TaqMan PreAmp Master Mix (2X) in a final volume of 30 μl. Thermal cycling conditions were as follows: initial hold at 95°C during 10 minutes; fourteen preamplification cycles of 15 seconds at 95°C and 4 minutes at 60°C and a final hold at 99.9°C for 10 minutes. Ten microliters of undiluted preamplification products was used in the subsequent singleplex amplification reactions, combined with 50 μl of 2× TaqMan Universal PCR MasterMix (AB) in a final volume of 100 μl, following manufacturer’s instructions. One sample of Human Universal Reference Total cDNA (Clontech) was included as a calibrator in each micro-fluidic card. The reactions were run in a 7900HT Fast Real-Time PCR System (AB).
Statistical Analysis
RT-PCR amplification results were processed with RQ manager (AB) and StatMiner (Integromics) software packages. The baseline correction was manually checked for each target and the Ct threshold was set to 0.2 for every target across all plates. One sample that amplified <10% of the 48 targets was removed from the analysis, and one target (PTX3) was removed from all subsequent analyses because amplification curve analysis revealed amplification of non-specific products. The real-time PCR data was analyzed using the comparative Ct method (12). Delta-Delta Ct values were calculated using a geometric average of the four endogenous reference targets (UBC, PPIA, PGK1 and GAPDH) as normalizer and Human Universal Reference Total cDNA (Clontech) as the calibrator. Genes deemed to be differentially expressed between BCa and non-cancer samples were determined by t-test comparison (p < 0.01).
Logistic regression was used to establish a prediction model from the quantitative PCR data, i.e. to predict the actual status of a given sample as cancer or control (see supplemental document SA). A ROC curve was then plotted to visualize how a prediction model performed at all sensitivity and specificity levels, and the area under receiver operating characteristic curves (AUC) was reported, following the STARD criteria for biomarker study reporting (13). The p-value was computed as the occurrence frequencies of the iterations, where the resulting AUCs outperformed that obtained using the original class labels. A p < 0.01 was considered to be statistically significant. Logistic regression analysis was performed with BCa status (yes vs. no) as the response variable, and biomarker values, gender and ethnicity. Neither gender nor ethnicity were identified as confounders. We also performed a permutation test (1000-fold) to estimate the p-value of predictive performance. Further details of model derivation are available in supplemental document SA. Statistical analyses were performed by SPSS 13.0. (IBM) and by MedCalc version 8.0 (MedCalc Software, Mariakerke, Belgium).
RESULTS
The overall scheme for identifying diagnostic molecular signatures for BCa is depicted in Figure 1. Urothelial cell samples were isolated from 92 subjects for molecular profile analysis (discovery cohort). Of these subjects, 52 had biopsy confirmed BCa and 40 had no evidence of cancer. Patient cohort characteristics are summarized in Table 1.
Figure 1.

Overall scheme of diagnostic biomarker discovery and verification approach. Urothelial samples from the discovery cohort of 92 subjects (52 BCa cases) were profiled using gene expression arrays monitoring ~47,000 transcripts per sample. Computational analyses identified BCa-associated genes and a diagnostic molecular signature that had optimal predictive value (see supplemental Tables S1 and S2). Forty eight targets were selected from the discovery cohort analyses for validation in an independent cohort of 81 subjects (44 BCa cases). Validation was performed using quantitative PCR using TaqMan assays. Data analysis identified BCa association of individual biomarkers (Table 2) and predictive multiplex signatures (Table 3).
Gene expression profiling
RNA was subjected to two-cycle amplification strategy prior to hybridization to Affymetrix U133 Plus 2.0 arrays. Comparative group (cancer versus non-cancer) data analysis identified a 447 gene set that had expression patterns associated with disease status (p ≤ 0.01), with 52 genes having a p value ≤ 0.001 (see Table S1 in Supplemental data). From a list of genes ranked only by p-value, it is not clear which are the most relevant to the classification task at hand, in this case, stratifying cancer versus non-cancer cases. In order to identify the most accurate diagnostic signatures from the microarray data, we applied a feature selection algorithm that we have previously derived and applied to the derivation of optimal disease classifiers in bladder, breast and prostate cancer (3, 7–9). The algorithm performs multivariate data analyses on high-dimensional data without making any assumptions about the underlying data distribution. This approach identified a 43-gene model (Table S2) that performed best in predicting class label, achieving an area under the ROC curve of 0.82, during leave-one-out cross validation. Overlap between the modeling and comparative data analyses informed the selection of genes for investigation with quantitative PCR in the second cohort.
Verification of candidate biomarker transcripts in an independent cohort
In order to validate and refine the BCa diagnostic molecular signature, we tested a selected panel of candidate biomarkers form the analyses described above in naturally voided urine samples from an independent cohort (cohort 2 – Table 1) comprised of 44 subjects with biopsy proven BCa and 37 subjects with no evidence of cancer (Table 1). Target transcripts were measured in RNA samples from urothelia isolated from naturally micturated urine using quantitative RT-PCR. Microfluidic cards of 384-well format were custom designed to include 44 candidate biomarker targets, plus 4 selected endogenous controls selected by screening the level of 15 commonly used endogenous controls in the full cohort of samples (selection and design described in Methods and in supplemental document SB). Biomarker targets were selected primarily from the top statistical ranking and molecular signature models described above, but we also included several putative biomarkers (TERT, KRT20, CLU, PLAU, CALR, CA9, ANG) that have been shown to be associated with BCa in our own previous studies or the literature (14, 15). When other selection criteria were equal, we selected genes that encode integral membrane proteins or secreted proteins because these classes hold particular potential for development as urine-based biomarker assays. The 44 selected targets are listed in Table 2. Differential expression values were calculated by normalization using the reference targets (UBC, PPIA, PGK1 and GAPDH) and Human Universal Reference Total cDNA (Clontech) as the calibrator on each plate. Fifteen targets were revealed to be differentially expressed between BCa and non-cancer samples (p < 0.05) using a t-test.
Table 2.
Expression data for targets included in the quantitative PCR analyses
| Gene Symbol | Gene Name | Gene ID | Mean ΔΔ Ct N a | SD ΔΔCt N a | Mean ΔΔCt BCa b | SD ΔΔCt BCa b | t-test p value | FC * BCa/N |
|---|---|---|---|---|---|---|---|---|
| CA9 | carbonic anhydrase IX | 768 | 9.11 | 5.25 | 2.07 | 4.53 | 1.E-08 | 131.63 |
| MMP12 | matrix metallopeptidase 12 | 4321 | 1.20 | 5.05 | −4.27 | 4.08 | 9.E-07 | 44.39 |
| CCL18 | chemokine (c-c motif) ligand 18 | 6362 | 5.76 | 4.96 | 1.30 | 3.00 | 5.E-06 | 22.03 |
| MMP10 | matrix metallopeptidase 10 | 4319 | 4.69 | 5.16 | −0.30 | 5.05 | 4.E-05 | 31.75 |
| TMEM45A | transmembrane protein 45A | 55076 | 6.62 | 5.68 | 2.13 | 3.93 | 9.E-05 | 22.43 |
| ANG | angiogenin, ribonuclease, RNaseA family, 5 | 283 | 9.64 | 4.31 | 13.02 | 3.96 | 0.001 | 0.1 |
| SNAI2 | snail homolog 2 (Drosophila) | 6591 | 5.85 | 5.08 | 2.75 | 3.07 | 0.001 | 8.56 |
| MMP1 | matrix metallopeptidase 1 | 4312 | 0.89 | 4.84 | −2.78 | 4.91 | 0.001 | 12.77 |
| SERPINE1 | serpin peptidase inhibitor, clade E, member 1 | 5054 | 4.14 | 3.87 | 1.38 | 4.01 | 0.003 | 6.74 |
| MXRA8 | matrix-remodeling-associated protein 8 | 54587 | 9.59 | 4.08 | 6.96 | 3.68 | 0.004 | 6.19 |
| MMP9 | matrix metallopeptidase 9 | 4318 | −0.76 | 3.91 | −3.17 | 3.26 | 0.004 | 5.32 |
| CCNE2 | cyclin E2 | 9134 | 3.52 | 4.45 | 1.06 | 4.14 | 0.013 | 5.5 |
| BIRC5 | baculoviral IAP repeat containing 5 | 332 | 7.57 | 4.72 | 5.04 | 4.59 | 0.018 | 5.79 |
| SEMA3D | semaphorin-3D | 223117 | 7.43 | 4.18 | 5.32 | 4.12 | 0.027 | 4.3 |
| PLAU | plasminogen activator, urokinase | 5328 | 1.22 | 3.11 | −0.22 | 3.32 | 0.052 | 2.71 |
| SYNGR1 | synaptogyrin 1 | 9145 | 0.44 | 3.65 | 1.97 | 3.77 | 0.073 | 0.35 |
| SCG3 | secretogranin III | 29106 | 10.63 | 4.76 | 8.56 | 5.30 | 0.074 | 4.19 |
| NUSAP1 | nucleolar and spindle associated protein 1 | 51203 | 1.74 | 3.97 | 0.31 | 3.53 | 0.096 | 2.68 |
| CRH | corticotropin releasing hormone | 1392 | 9.12 | 4.44 | 6.97 | 6.84 | 0.109 | 4.43 |
| TERT | telomerase reverse transcriptase | 7015 | 7.07 | 4.94 | 4.96 | 6.37 | 0.110 | 4.3 |
| DMBT1 | deleted in malignant brain tumors 1 | 1755 | 2.91 | 5.76 | 5.01 | 6.37 | 0.131 | 0.23 |
| IL1RAP | interleukin 1 receptor accessory protein | 3556 | −0.53 | 3.32 | −1.72 | 3.57 | 0.132 | 2.28 |
| NRG3 | neuregulin 3 | 10718 | 8.26 | 5.15 | 9.74 | 4.95 | 0.195 | 0.36 |
| RAB1A | RAB1A, member RAS oncogene family | 5861 | 1.58 | 1.64 | 2.24 | 2.74 | 0.211 | 0.63 |
| AGT | angiotensinogen | 183 | 8.16 | 4.44 | 9.36 | 4.75 | 0.254 | 0.44 |
| PLOD2 | procollagen-lysine, 2-oxoglutarate 5-dioxygenase 2 | 5352 | 4.51 | 4.25 | 3.41 | 4.27 | 0.254 | 2.15 |
| MCOLN1 | mucolipin 1 | 57192 | 0.76 | 3.69 | −0.22 | 3.92 | 0.260 | 1.97 |
| FBXO9 | f-box protein 9 | 26268 | 1.09 | 2.89 | 1.90 | 3.69 | 0.287 | 0.57 |
| IL8 | interleukin 8 | 3576 | −6.26 | 4.03 | −7.55 | 6.58 | 0.308 | 2.44 |
| CTNNA1 | catenin (cadherin-associated protein), alpha 1, 102kDa | 1495 | 0.53 | 2.27 | 1.17 | 3.24 | 0.319 | 0.64 |
| CLU | clusterin | 1191 | 5.51 | 2.99 | 6.22 | 3.59 | 0.347 | 0.61 |
| ATM | ataxia telangiectasia mutated | 472 | 0.52 | 4.11 | −0.18 | 3.36 | 0.406 | 1.63 |
| VEGFA | vascular endothelial growth factor A | 7422 | −0.50 | 2.48 | −0.95 | 4.45 | 0.590 | 1.37 |
| CALR | calreticulin | 811 | 1.33 | 2.78 | 0.91 | 4.12 | 0.599 | 1.34 |
| DSC2 | desmocollin 2 | 1824 | 0.20 | 2.72 | 0.60 | 4.03 | 0.613 | 0.76 |
| FGF22 | fibroblast growth factor 22 | 27006 | 2.36 | 3.68 | 1.96 | 3.51 | 0.623 | 1.32 |
| CPA1 | carboxypeptidase A1 (pancreatic) | 1357 | 12.97 | 4.34 | 13.48 | 5.43 | 0.650 | 0.7 |
| APOE | apolipoprotein E | 348 | 5.46 | 2.81 | 5.19 | 2.99 | 0.674 | 1.21 |
| ATF3 | activating transcription factor 3 | 467 | −0.34 | 2.58 | −0.09 | 3.38 | 0.711 | 0.84 |
| ERBB2 | v-erb-b2 erythroblastic leukemia viral oncogene homolog 2 | 2064 | −0.64 | 4.00 | −0.89 | 3.71 | 0.774 | 1.19 |
| KRT20 | keratin 20 | 54474 | −10.19 | 4.46 | −10.45 | 5.53 | 0.816 | 1.2 |
| TLR2 | toll-like receptor 2 | 7097 | −1.07 | 2.73 | −1.24 | 4.50 | 0.838 | 1.13 |
| ITGB5 | integrin, beta 5 | 3693 | 2.70 | 3.39 | 2.72 | 3.24 | 0.977 | 0.99 |
| UBC | ubiquitin C | 7316 | Endog. Control | NA | ||||
| PPIA | peptidylprolyl isomerase A | 5478 | Endog. Control | NA | ||||
| PGK1 | phosphoglyceratekinase 1 | 5230 | Endog. Control | NA | ||||
| GAPDH | glyceraldehyde-3-phosphate dehydrogenase | 2597 | Endog. Control | NA | ||||
N: Non-Cancer control;
BCa: Bladder Cancer.
Fold Change = 2 −ΔΔCt T/2 −ΔΔCt N (See Methods Section)
TaqManAssay IDs for the 44 target genes and 4 Endogenous Controls are in Supplemental Table S3
Molecular signature derivation
In order to identify the molecular signature that could best predict the status of a given sample as cancer or control, we also used L1-regularized logistic regression to derive a prediction model from the 44 targets. ROC curves were generated to compare the performance of all possible combinatorial models. The optimal signature derived from the PCR analysis was composed of 14 genes (Table 3). We observe that some genes (e.g., DMBT1 and ERBB2) have relatively high p-values and so may not be valuable when evaluated individually, but these targets do provide critical information when combined with a panel of biomarkers. A scatter plot of the 14-gene signature performance showed a significant (p < 0.0001) spread of values between cancer and non-cancer cases (Figure 2A), and the ROC curve depicts performance across all sensitivity and specificity values (Figure 2B). The ROC curve reveals that at a sensitivity of 90%, the 14-gene signature achieved a specificity of 100%. The area under the ROC curve (AUC) was 0.98. By plotting the variation of signature p-values against AUC values, it was revealed that the nine top ranked genes contributed the most to the 14-gene signature performance (Figure 2C).
Table 3.
Diagnostic signatures for the detection of bladder cancer
| Gene Symbol | Gene Name | Fold Change BCa/N | 14-gene Signature Average weight* | 9-gene Signature Average weight* | Localization |
|---|---|---|---|---|---|
| CA9 | carbonic anhydrase IX | 131.63 | 0.18 | 0.480 | Cell Membrane/Nucleus |
| MMP12 | matrix metallopeptidase 12 | 44.39 | 0.075 | Secreted | |
| TMEM45A | transmembrane protein 45A | 22.43 | 0.06 | 0.032 | Membrane |
| CCL18 | chemokine (C-C motif) ligand 18 | 22.03 | 0.16 | 0.400 | Secreted |
| MXRA8 | matrix-remodelling associated 8 | 6.19 | 0.02 | Membrane | |
| MMP9 | matrix metallopeptidase 9 | 5.32 | 0.05 | 0.009 | Secreted |
| CRH | corticotropin releasing hormone | 4.43 | 0.001 | Secreted | |
| SEMA3D | semaphorin3D | 4.30 | 0.05 | 0.002 | Secreted |
| VEGFA | vascular endothelial growth factor A | 1.37 | −0.02 | Secreted | |
| ERBB2 | v-erb-b2 erythroblastic leukemia viral oncogene homolog 2 | 1.19 | 0.08 | 0.001 | Membrane/Cytoplasm. |
| DSC2 | desmocollin 2 | 0.76 | −0.04 | 0.001 | Nucleus Cell Membrane |
| RAB1A | RAB1A, member RAS oncogene family | 0.63 | −0.05 | Endoplasmic Reticulum | |
| AGT | angiotensinogen | 0.44 | −0.01 | Secreted | |
| SYNGR1 | synaptogyrin 1 | 0.35 | −0.06 | Membrane | |
| DMBT1 | deleted in malignant brain tumors 1 | 0.23 | −0.09 | Secreted | |
| ANG | angiogenin, ribonuclease, RNase A family, 5 | 0.10 | −0.08 | Secreted |
Genes sorted in descending order of Fold Change.
Negative prefix denotes a gene down-regulated in cancer cases.
BCa: Bladder cancer; N: Non-Cancer control
Figure 2.
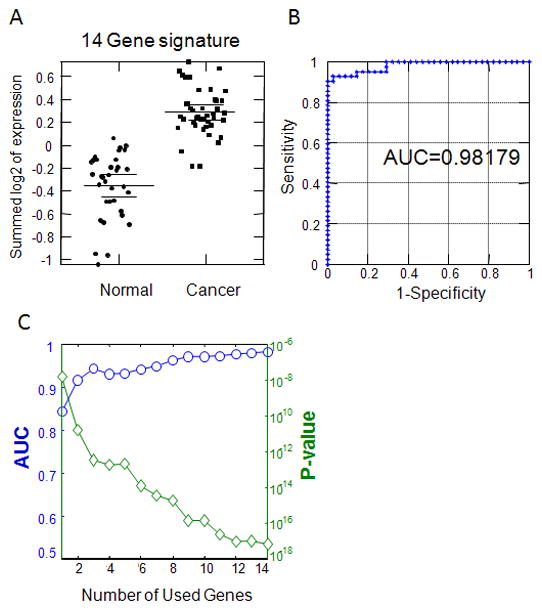
A, Expression distribution of the 14-gene signature on cancer and non-cancer groups. The groups are well separated (p < 6.5E-18); B, ROC curve illustrating the diagnostic accuracy of a 14-gene classifier for BCa; C, Variation of p-values and AUROC values as a function of the number of genes included in a prediction model. For the 14-gene diagnostic signature, all genes contribute to the prediction power, but the 9 top-weighted genes provided the most significant information.
The optimal 14-gene model was comprised of 7 gene transcripts that were up-regulated in urines from BCa subjects and 7 that were down-regulated. Considering the development of potential biomarker assays, in which up-regulated genes are more applicable for accurate detection, we applied a constrained L1 regularized logistic regression model (supplemental document SA) to derive an optimal diagnostic signature comprised of only up-regulated genes (supplemental document SA). Considering the limits on target selection, the 9-gene signature (Table 3) performed very well, achieving an AUC of 0.93 (Figure 3A and 3B). From the ROC curve (Figure 3) we can see that at a sensitivity of 80%, the 9-gene signature achieved 98% specificity. Plotting the p-value variation and AUC values revealed that the top two ranked genes (CA9 and CCL18) contributed most to the 9-gene signature (Figure 3C).
Figure 3.
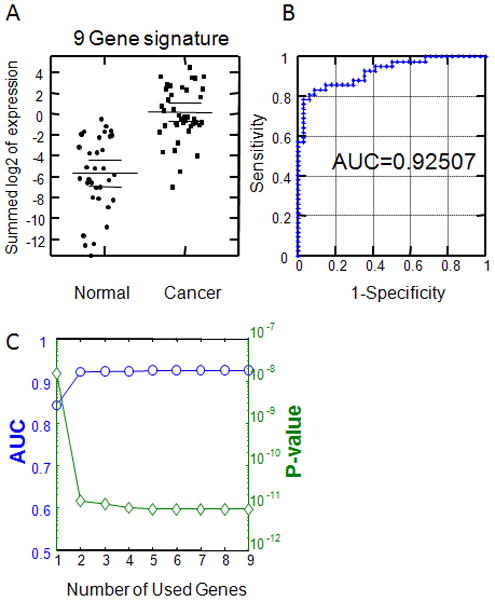
A, Expression distribution of the 9-gene signature on cancer and non-cancer sample groups (p < 9.45e-12); B, ROC curve illustrating the diagnostic accuracy of a 9-gene classifier for BCa which was comprised only of upregulated genes; C, Variation of p-values and AUROC values with respect to the number of genes included in a prediction model. For the 9-gene diagnostic signature, the 2 top-weighted genes contributed most to the signature.
DISCUSSION
A number of molecular tests have been developed to detect potential tumor-associated biomarkers that are released into the urine from malignant cells. Some of these tests include bladder tumor antigen (BTA),(16) nuclear matrix protein 22 (NMP-22),(17) and fluorescence in situ hybridization analysis for chromosomal abnormalities. (18) However, these biomarkers have limited sensitivity, thus by themselves, have not proven to be accurate enough to replace cystoscopy or even VUC. The idea that the presence or absence of a single molecular marker will aid diagnostic or prognostic evaluation has not proved to be the case. This makes sense when one realizes the complex interactions between various molecules within a single pathway, the cross-talk between molecular pathways, the redundancy of some pathways and the oligoclonality of many tumors. Thus an evolution to a more global assessment of cancer and the derivation of multiplex molecular classifier signatures holds more promise.
This study is part of a long-term program to develop robust, multiplex molecular assays for non-invasive diagnosis of BCa. We have previously reported in a pilot study the feasibility of profiling the entire transcriptome of shed urothelial cells (3). In this study, we expanded the genome-wide transcriptome profiling to 92 urothelial samples and identified candidate biomarkers associated with the presence of BCa. A panel of differentially expressed genes was selected from the profile data for further investigation in an independent cohort of 81 subjects. The overall strategy is to profile as many genes in as many samples as is technically and economically feasible, followed by more targeted monitoring of a smaller subset of genes in additional samples using a more accurate and cost-effective technique. This approach has enabled us to identify candidate biomarkers and to refine potential multiplex signatures for future validation studies. To date, we have kept both the controls and BCa cohorts relatively separate and homogeneous. This enables identification of promising biomarkers that can be subsequently tested in more complex sets of samples. Conversely, although more typical with respect to clinical presentation, profiling a very heterogeneous cohort (history of BCa, UTI, gross hematuria etc.) with a high-dimensional array and that does not have adequate representation of each subtype will compromise the ability to identify statistically significant associations. The next phase in our program will be to investigate the significance of the top-ranked panel of biomarkers identified in this study in larger and more diverse cohorts that have a broader representation of BCa subtypes and controls. From that analysis, an optimal signature, and a computational method for deriving a diagnostic score will be locked-down for testing in multi-site trials.
The rationale for analyzing the shed urothelial component of urine in this study is twofold. The first reason is the fact that we aim to develop non-invasive assays for BCa detection, and reasoned that analysis of the very component that will be the analyte of a future assay is optimal. But as important is the fact that this analyte enables comparison of samples collected from subjects with non-malignant conditions. Solid tissue samples are available from surgically excised material, but truly normal tissues are almost never available because it would be unethical to biopsy healthy tissue. The analysis of bladder tissue is also restricted by the occurrence of the ‘field effect’, which describes the phenomenon of widespread urothelial change when a malignant lesion is present. Thus, even apparently normal tissue adjacent to excised tumor is not useful for comparison. This is why tissue based studies have yielded more prognostic than diagnostic biomarkers of promise to date (19, 20). The analysis of urothelia overcomes this limitation because all individuals shed an appreciable number of cells routinely.
The gold standard for the non-invasive diagnosis of BCa is VUC. VUC relies on the microscopic visualization of shed cancer cells in voided urine. Low-grade tumors and low stage tumors (Ta-T1) shed less cancer cells into the urine, and so the sensitivity for detecting these tumors by VUC typically ranges from 20 to 40% (21). In the current study, VUC detected 31% and 27% of the subjects with BCa in cohort 1 and cohort 2, respectively. The detection rate of BCa by VUC in our study is in line with its detection rate in our previous studies (3, 22). The amplification of shed urothelial cell molecular content, in this case specific transcripts by PCR obviously provides a huge advantage over a visual analysis of scant cellular material, but it also enables the detection of informative molecular changes that may not manifest as changes in nuclear morphology - the criteria used for VUC evaluation. Of the genes in our best performing signatures (Table 3), some have been implicated in BCa previously (MMP12, CA9, ERBB2, MMP9, VEGFA,) while some have been associated with other cancers but not BCa (CCL18, DMBT1, RAB1A, SEMA3D, DSC2, AGT, CRH). To our knowledge, TMEM45A, SYNGR1, MXRA8 have not been linked to any cancers previously. Of those implicated in BCa, only ERBB2, CA9 and MMP9 have been investigated at all as candidate biomarkers in urine-based assay for cancer detection, and in this context only one or two articles for each marker are available in the literature.
The ability to perform global gene expression profiling on the minimal material present in shed urothelial cell (3) greatly facilitates the identification and development of potential biomarkers for the detection of BCa in non-invasively obtained patient samples. Urine-based assays have several advantages over tissue as a clinical sample. The non-invasive sampling not only benefits the patient by avoiding discomfort, but also enables repeat and copious sampling. Biomarkers can be monitored at the DNA, RNA or protein level in the cellular material or the supernatant (18, 23, 24), and although a stand-alone test is desirable, information can also be used to increase the accurate detection power of cytology, cystoscopy or biopsy evaluation. A European team has also used the urothelial sample approach for molecular classification and signature derivation utilizing a similar strategy (25). In parallel with our microarray profiling, the initial analysis by Mengual et al. used bladder washings (barbotage). Whereas we performed genome-wide profiling (>47,000 transcripts using Affymetrix U133 Plus 2.0 array) on 92 barbotage specimens to identify promising targets for investigation with a target-specific technique, Mengual et al. assessed less targets (384 genes) using quantitative RT-PCR. The 384 genes were selected from a previous study that profiled only 12 solid bladder tissue samples (26) using cDNA microarray platform. Their analysis identified a 12-gene signature that achieved high accuracy in diagnosing BCa as demonstrated in an independent cohort utilizing quantitative RT-PCR. The 12-gene signature achieved diagnostic accuracy of 89% sensitivity and 95% specificity. Despite significant differences between the current study and the study by Mengual et al., both groups were able to derive molecular signatures that can accurately identify BCa. This demonstrates that a multiplex quantitative PCR test on voided urine sample holds promise as a non-invasive urine-based assay in the evaluation of patients being investigated for BCa. Given the different approaches used to get to a biomarker panel that performs in actual voided urine samples, it is not surprising that there is not so much overlap in the diagnostic signature between the two urothelia studies. Overlap between gene lists of microarray studies performed in bladder tissues have also been reported to be less than might be expected (27), however, a number of genes present in our top-ranked lists and models are components of signatures under investigation by others (25). It may be that there is considerable overlap of signature genes at a higher level, either as components of common signaling pathways or through a commonality of function.
We recognize that our study has several limitations. First, as a tertiary care facility, we tend to see more high-grade, high-stage disease, which is reflected in our study cohort. To further confirm the robustness of our multiplex signature, subsequent studies must assess larger cohorts that include subjects with low-grade, low-stage disease. We also did not have complete smoking data for all subjects in the cohort, and so an association with smoking history was not possible. Third, processed, banked urines were analyzed. Urines were centrifuged and separated into cellular pellet and supernatant prior to storage at −80°C. It is feasible that freshly voided urine samples may provide different results. We are currently investigating the performance of selected biomarkers in urines processed via a number of different protocols, including freshly voided urines. The use of Affymetrix GeneChip arrays and Taqman Low Density Arrays (TLDA) avoids a lot of typical technical errors, but in future studies we will also include more technical replicates in order to assess intra-sample variation. Next, the sensitivity of VUC in our cohort of predominantly high-grade (grade 3) disease (31% and 27%) was lower than would be expected. This calls into question the known inter-observer variability of interpreting VUC. In subsequent studies, we will utilize two cytopathologists to interpret these results. Lastly, our second cohort of 81 cases is relatively small and the two groups that comprised the 81 subjects were relatively homogeneous, i.e. either active cancer, or control cases with no active cancer, no history of cancer, no urinary tract infection, no urolithiasis, and no gross hematuria. Thus we were not able to assess sensitivity/specificity of our biomarkers among different stages/grades.
In this discovery phase study, we have identified biomarkers and diagnostic signatures that achieved higher values of sensitivity and specificity than previously reported for any current or proposed test, confirming the feasibility of developing diagnostic assays that use shed urothelia as analyte. The development of an accurate, non-invasive BCa detection assay would clearly benefit both the patient and the health system. If the assay is accurate and reliable enough, then it would be applicable for not only diagnosing and surveilling BCa, but for screening at risk, asymptomatic individuals. Larger, confirmatory studies are now under way in order to further refine and validate biomarker panels prior to the development of clinically applicable urine-based assays.
Supplementary Material
Acknowledgments
Financial Support: This work was supported in part by the National Cancer Institute under grant R01CA116161 (S.G.); the Flight Attendant Medical Research Institute grant (C.J.R.) and the Florida Department of Health JEK Grant 1KT-01 (C.J.R. & S.G.)
We thank the 173 subjects that comprised the study cohorts of this study.
Footnotes
Conflict of Interest: C.J.R, S.G. and V.U. have an ownership interest and/or affiliation with Nonagen Bioscience Corporation
References
- 1.Kaufman DS, Shipley WU, Feldman AS. Bladder cancer. Lancet. 2009;374:239–49. doi: 10.1016/S0140-6736(09)60491-8. [DOI] [PubMed] [Google Scholar]
- 2.Trivedi D, Messing EM. Commentary: the role of cytologic analysis of voided urine in the work-up of asymptomatic microhematuria. BMC Urol. 2009;9:13. doi: 10.1186/1471-2490-9-13. [DOI] [PMC free article] [PubMed] [Google Scholar]
- 3.Rosser CJ, Liu L, Sun Y, Villicana P, McCullers M, Porvasnik S, et al. Bladder cancer-associated gene expression signatures identified by profiling of exfoliated urothelia. Cancer Epidemiol Biomarkers Prev. 2009;18:444–53. doi: 10.1158/1055-9965.EPI-08-1002. [DOI] [PMC free article] [PubMed] [Google Scholar]
- 4.Edgar R, Domrachev M, Lash AE. Gene Expression Omnibus: NCBI gene expression and hybridization array data repository. Nucleic Acids Res. 2002;30:207–10. doi: 10.1093/nar/30.1.207. [DOI] [PMC free article] [PubMed] [Google Scholar]
- 5.Wagner F, Radelof U. Performance of different small sample RNA amplification techniques for hybridization on Affymetrix GeneChips. J Biotechnol. 2007;129:628–34. doi: 10.1016/j.jbiotec.2007.02.015. [DOI] [PubMed] [Google Scholar]
- 6.Copois V, Bibeau F, Bascoul-Mollevi C, Salvetat N, Chalbos P, Bareil C, et al. Impact of RNA degradation on gene expression profiles: assessment of different methods to reliably determine RNA quality. J Biotechnol. 2007;127:549–59. doi: 10.1016/j.jbiotec.2006.07.032. [DOI] [PubMed] [Google Scholar]
- 7.Sun Y, Todorovic S, Goodison S. Local-learning-based feature selection for high-dimensional data analysis. IEEE Trans Pattern Anal Mach Intell. 2010;32:1610–26. doi: 10.1109/TPAMI.2009.190. [DOI] [PMC free article] [PubMed] [Google Scholar]
- 8.Sun Y, Goodison S. Optimizing molecular signatures for predicting prostate cancer recurrence. Prostate. 2009;69:1119–27. doi: 10.1002/pros.20961. [DOI] [PMC free article] [PubMed] [Google Scholar]
- 9.Goodison S, Sun YJ, Urquidi V. Derivation of cancer diagnostic and prognostic signatures from gene expression data. Bioanalysis. 2010;2:855–62. doi: 10.4155/bio.10.35. [DOI] [PMC free article] [PubMed] [Google Scholar]
- 10.Wessels LF, Reinders MJ, Hart AA, Veenman CJ, Dai H, He YD, et al. A protocol for building and evaluating predictors of disease state based on microarray data. Bioinformatics. 2005;21:3755–62. doi: 10.1093/bioinformatics/bti429. [DOI] [PubMed] [Google Scholar]
- 11.Bitzer M, Ju W, Jing X, Zavadil J. Quantitative analysis of miRNA expression in epithelial cells and tissues. Methods Mol Biol. 2012;820:55–70. doi: 10.1007/978-1-61779-439-1_4. [DOI] [PubMed] [Google Scholar]
- 12.Schmittgen TD, Livak KJ. Analyzing real-time PCR data by the comparative C(T) method. Nat Protoc. 2008;3:1101–8. doi: 10.1038/nprot.2008.73. [DOI] [PubMed] [Google Scholar]
- 13.Bossuyt PM, Reitsma JB, Bruns DE, Gatsonis CA, Glasziou PP, Irwig LM, et al. Towards complete and accurate reporting of studies of diagnostic accuracy: the STARD initiative. Fam Pract. 2004;21:4–10. doi: 10.1093/fampra/cmh103. [DOI] [PubMed] [Google Scholar]
- 14.Khalbuss W, Goodison S. Immunohistochemical detection of hTERT in urothelial lesions: a potential adjunct to urine cytology. Cytojournal. 2006;3:18. doi: 10.1186/1742-6413-3-18. [DOI] [PMC free article] [PubMed] [Google Scholar]
- 15.Klatte T, Seligson DB, Rao JY, Yu H, de Martino M, Kawaoka K, et al. Carbonic anhydrase IX in bladder cancer: a diagnostic, prognostic, and therapeutic molecular marker. Cancer. 2009;115:1448–58. doi: 10.1002/cncr.24163. [DOI] [PubMed] [Google Scholar]
- 16.Gutiérrez Baños JL, del Henar Rebollo Rodrigo M, Antolín Juárez FM, García BM. Usefulness of the BTA STAT Test for the diagnosis of bladder cancer. Urology. 2001;57:685–9. doi: 10.1016/s0090-4295(00)01090-6. [DOI] [PubMed] [Google Scholar]
- 17.Hwang EC, Choi HS, Jung SI, Kwon DD, Park K, Ryu SB. Use of the NMP22 BladderChek test in the diagnosis and follow-up of urothelial cancer: a cross-sectional study. Urology. 2010;77:154–9. doi: 10.1016/j.urology.2010.04.059. [DOI] [PubMed] [Google Scholar]
- 18.Goodison S, Rosser CJ, Urquidi V. Urinary proteomic profiling for diagnostic bladder cancer biomarkers. Expert Review of Proteomics. 2009;6:507–14. doi: 10.1586/epr.09.70. [DOI] [PMC free article] [PubMed] [Google Scholar]
- 19.Holyoake A, O’Sullivan P, Pollock R, Best T, Watanabe J, Kajita Y, et al. Development of a multiplex RNA urine test for the detection and stratification of transitional cell carcinoma of the bladder. Clin Cancer Res. 2008;14:742–9. doi: 10.1158/1078-0432.CCR-07-1672. [DOI] [PubMed] [Google Scholar]
- 20.Dyrskjot L, Zieger K, Real FX, Malats N, Carrato A, Hurst C, et al. Gene expression signatures predict outcome in non-muscle-invasive bladder carcinoma: a multicenter validation study. Clin Cancer Res. 2007;13:3545–51. doi: 10.1158/1078-0432.CCR-06-2940. [DOI] [PubMed] [Google Scholar]
- 21.Lokeshwar VB, Habuchi T, Grossman HB, Murphy WM, Hautmann SH, Hemstreet GP, 3rd, et al. Bladder tumor markers beyond cytology: International Consensus Panel on bladder tumor markers. Urology. 2005;66:35–63. doi: 10.1016/j.urology.2005.08.064. [DOI] [PubMed] [Google Scholar]
- 22.Nakamura K, Kasraeian A, Iczkowski KA, Chang M, Pendleton J, Anai S, et al. Utility of serial urinary cytology in the initial evaluation of the patient with microscopic hematuria. BMC Urol. 2009;9:12. doi: 10.1186/1471-2490-9-12. [DOI] [PMC free article] [PubMed] [Google Scholar]
- 23.Yang N, Feng S, Shedden K, Xie X, Liu Y, Rosser CJ, et al. Urinary Glycoprotein Biomarker Discovery for Bladder Cancer Detection using LC-MS/MS and Label-free Quantification. Clin Cancer Res. 2011;17:3349–59. doi: 10.1158/1078-0432.CCR-10-3121. [DOI] [PMC free article] [PubMed] [Google Scholar]
- 24.Villicana P, Whiting B, Goodison S, Rosser CJ. Urine-based assays for the detection of bladder cancer. Biomark Med. 2009;3:265. doi: 10.2217/bmm.09.23. [DOI] [PMC free article] [PubMed] [Google Scholar]
- 25.Mengual L, Burset M, Ribal MJ, Ars E, Marin-Aguilera M, Fernandez M, et al. Gene expression signature in urine for diagnosing and assessing aggressiveness of bladder urothelial carcinoma. Clin Cancer Res. 2010;16:2624–33. doi: 10.1158/1078-0432.CCR-09-3373. [DOI] [PubMed] [Google Scholar]
- 26.Mengual L, Burset M, Ars E, Lozano JJ, Villavicencio H, Ribal MJ, et al. DNA microarray expression profiling of bladder cancer allows identification of noninvasive diagnostic markers. J Urol. 2009;182:741–8. doi: 10.1016/j.juro.2009.03.084. [DOI] [PubMed] [Google Scholar]
- 27.Lauss M, Ringner M, Hoglund M. Prediction of stage, grade, and survival in bladder cancer using genome-wide expression data: a validation study. Clin Cancer Res. 2010;16:4421–33. doi: 10.1158/1078-0432.CCR-10-0606. [DOI] [PubMed] [Google Scholar]
Associated Data
This section collects any data citations, data availability statements, or supplementary materials included in this article.