

Abstract
Systemic inflammatory response syndrome (SIRS) is a fundamental host response common to bacterial infection and sterile tissue injury. SIRS can cause organ dysfunction and death but its mechanisms are incompletely understood. Moreover, SIRS can progress to organ failure or death despite being sterile or after control of the inciting infection. Biomarkers discriminating between sepsis, sterile SIRS and post-infective SIRS would therefore help direct care. Circulating mitochondrial DNA (mtDNA) is a damage-associated molecular pattern (DAMP) reflecting cellular injury. Circulating bacterial 16S-DNA (bDNA) is a pathogen-associated pattern (PAMP) reflecting ongoing infection. We developed qPCR assays to quantify these markers and predicted their plasma levels might help distinguish sterile injury from infection. To study these events in primates we assayed banked serum from papio baboons that had undergone a brief challenge of intravenous Bacillus anthracis deltaSterne (modified to remove toxins) followed by antibiotics (anthrax) that causes organ failure and death. To investigate the progression of sepsis to “severe” sepsis and death we studied animals where anthrax was pretreated with drotrecogin alfa (aPC), which attenuates sepsis in baboons. We also contrasted lethal anthrax bacteremia against non-lethal E.coli bacteremia and against sterile tissue injury from Shiga-like toxin-1 (Stx1). bDNA and mtDNA levels in timed samples were correlated with blood culture results and assays of organ function. Sterile injury by Stx1 increased mtDNA but bDNA was undetectable: consistent with the absence of infection. The bacterial challenges caused parallel early bDNA and mtDNA increases, but bDNA detected pathogens even after bacteria were undetectable by culture. Sub-lethal E.coli challenge only caused transient rises in mtDNA consistent with a self-limited injury. In lethal anthrax challenge (n=4) bDNA increased transiently but mtDNA levels remained elevated until death, consistent with persistent septic tissue damage after bacterial clearance. Critically, aPC pre-treatment (n=4) allowed mtDNA levels to decay after bacterial clearance with sparing of organ function and survival. In summary, host tissue injury correlates with mtDNA whether infective or sterile. mtDNA and bDNA PCRs can quantify tissue injury incurred by septic or sterile mechanisms and suggest the source of SIRS of unknown origin.
Keywords: Sepsis, Inflammation, Bacteremia, Systemic Inflammatory Response Syndrome, Trauma
Introduction
The systemic inflammatory response syndrome (SIRS) can occur either in the setting of sepsis due to pathogens or in a wide variety of circumstances where sterile processes activate inflammation. Both types of initiating events signal “danger” to the immune system. In terms of molecular pathogenesis however, sterile SIRS reflects activation of innate immune pathways by host damage-associated molecular patterns (DAMPs) (1), whereas sepsis is initiated by pathogen-associated molecular patterns (PAMPs) originating from infecting organisms (2). Sepsis and SIRS activate immunity through similar (or identical) pattern recognition receptors but distinguishing between them clinically is critical, perhaps most obviously because empiric use of antibiotics encourages the emergence of resistant bacteria.
The sharing of cellular pathways by which DAMPs and PAMPs act can cause the downstream immune responses to sepsis and SIRS to be indistinguishable. Thus, clinical responses to infective and non-infective challenge may also be similar (3). Current clinical practice relies on laboratory tests and clinical judgment to distinguish between sterile SIRS and sepsis due to pathogens. Cultures diagnostic of infection typically take days to grow out, limiting their value. Moreover, in many cases bacterial isolates only reflect colonization. Last, infective and non-infective inflammation can co-exist. Clinical examples are frequent, but this is commonly seen after trauma, major surgery or tissue injury from processes like gout.
Mediators of inflammation have been advanced as biomarkers to discriminate between sepsis and sterile SIRS. But since the pathways activated by sepsis and SIRS are shared the mediators produced are often identical. This limits diagnostic value (4). We have previously used PCR-based assays specific for mitochondrial DNA (mtDNA) to demonstrate the presence and severity of sterile tissue injury (3, 5) and broad-spectrum bacterial DNA (bDNA) assays can be used to detect the presence of pathogens in sepsis (6). We hypothesized that simultaneous assays of mtDNA and bDNA might help categorize the pathogenesis of SIRS in a way that would allow rapid, informed clinical decisions.
To test these hypotheses in a clinically relevant way, we assayed bDNA and mtDNA in stored plasma samples from non-human primates (Papio baboons) that had been subjected either to bacterial sepsis or noninfectious toxin challenge. Samples were archived from prior and ongoing collaborative studies in sepsis, inflammation, SIRS responses and therapeutic approaches (7-9). Progressive lethal bacterial sepsis was induced by infusion of Bacillus anthracis deltaSterne (pXO1−pXO2−), a non-toxigenic model of late stage anthrax sepsis. The contributions of sepsis and secondary inflammation to organ dysfunction and outcome were then further differentiated by treating baboons with activated protein C (aPC; drotrecogin alfa, activated) prior to anthrax infusion. The effects of aPC are incompletely understood and likely multiple, but it has been shown to provide micro-circulatory anti-coagulation and protection against endothelial injury (10). aPC also acts directly on immune cells to suppress innate immunity (11, 12). To contrast lethal anthrax sepsis with another form of non-lethal sepsis we used sera from an E.coli infusion model of sepsis where SIRS spontaneously resolves after termination of the infusion. Last, to contrast sepsis to truly sterile SIRS, tissue injury was induced by intravenous injection of Shiga-like toxin 1 (Stx1). This ribosomal toxin (13) is a primary virulence factor of non-invasive enterohemorrhagic E.coli that causes hemolytic uremic syndrome and acute renal failure (8, 14). In these patients, antibiotic treatment can cause harm by activating phage sequences that up-regulate toxin production (15).
Thus our group of models generally allow us to quantify DAMPs and PAMPs in 1) sterile tissue injury, 2) self-limited bacteremia, 3) bacteremia that progresses to death due to SIRS after sterilization and 4) identical bacteremia where SIRS and death are prevented by aPC rescue. Each model has advantages and limitations and it is the combination of methods that yields more important, generalizable results.
In addition to evaluating mtDNA and bDNA as biomarkers to distinguish sepsis and sterile SIRS, we hypothesized that bDNA levels might improve precision in defining the presence and course of bacteremia, and that mtDNA levels might quantify tissue injury caused by either septic or sterile insults. Last, we speculated that studying correlations between these biomarkers and clinical indicators of organ dysfunction might help define the contribution of bacterial PAMPs and endogenous DAMPs to clinical organ dysfunction in sepsis and sterile SIRS.
MATERIALS AND METHODS
DNA Isolation
Thawed plasma used for PCR analyses was spun twice at 3000xg to remove residual cells, platelets, micro-particles and debris. DNA was prepared from 100μL plasma using QIAamp DNA Blood Mini Kit (Qiagen, Valencia, CA) according to the manufacturer’s protocol, except that 80μL volume was used to elute DNA from the spin columns.
Real-time PCR Protocols
Cytochrome B primers for mtDNA were chosen for study because unique among mitochondrial molecules, cytochrome B is essentially absent from bacteria on BLAST study (3). Similarly, PCRs targeting 16S bacterial ribosomal RNA have long been used as broad spectrum probes for bacteria. We noted however, that 12s mitochondrial RNA bears many similarities to bacterial 16S-RNA, creating the possibility of false positive assays. We therefore chose16S-bDNA targets that were universal in Gram-positive, Gram-negative and anaerobic bacteria but were evolutionarily distant from mtDNA ribosomal sequences. It should be noted that fungi have mitochondria and these methods are therefore inappropriate for evaluating fungal sepsis.
The same amount of DNA (5μL) was used for each real-time PCR reaction using SYBR Green Master Mix (Applied Biosystems) by Mastercycler EP Realplex (Eppendorf), StepOne Plus (Applied Biosystems), or Mx3000P (Agilent Technologies). Cytochrome B qPCR was accompanied with a standard curve of mtDNA prepared from baboon liver mitochondria isolated using standard methods. Primers (Invitrogen) for targeted species-specific cytochrome B DNA did not cross-react with bacterial 16S DNA.
To reduce variability due to reagent and equipment differences, DNA standard curves were included on each plate using either commercial E. coli DNA (Invitrogen) or mtDNA purified from freshly prepared mitochondria using the Wako mtDNA Extractor CT kit. qPCR assays demonstrated high sensitivity and specificity for human mtDNA and bDNA from Gram-positive (Staphylococcus aureus), Gram-negative (E. coli) and anaerobic (Bacteroides fragilis) organisms (Supplemental Figure 1). In all cases there was essentially no cross reactivity although the primers are sensitive to fg/mL levels. Supplemental Figure 1 and Table 1 provide supporting data about the qPCR methods and physiological interpretations.
Animal Ethical Considerations
Animal studies were performed under the oversight of the Institutional Animal Care and Use Committees and Institutional Biosafety Committees of the Boston University School of Medicine, University of Oklahoma Health Sciences Center, and Beth Israel Deaconess Medical Center where appropriate. All studies were performed in compliance with applicable National Institutes of Health and ARRIVE guidelines.
Animal Procedures
All nonhuman primate experiments were performed using methods previously described (8, 9). Methods are summarized here to clarify the different experimental designs and reagents used for challenge or therapeutic purposes. Physiological data and assays of bDNA and mtDNA were performed on archived samples from prior and ongoing studies in sepsis, inflammation and SIRS responses that are part of larger on-going collaborative studies (7-9). Papio c. cynocephalus or Papio c. anubis (4~6kg) were purchased from the Baboon Research Resource at the University of Oklahoma Health Sciences Center and were free of tuberculosis with leukocyte counts <15,000 mm3. Briefly, the baboons were fasted for 24 hours before the study, with free access to water. They were immobilized the morning of the experiment with ketamine (14mg/kg, i.m.) and sodium pentobarbital administered through a percutaneous catheter in the cephalic vein of the forearm to maintain a light level of surgical anesthesia (2 mg/kg, about every 20–40 min). Baboons were orally intubated and positioned on their left side on a heat pad and catheterized as described below for each challenge. Except for samples for bacteria colony counts, blood samples were collected into 1/100 volume of 5,000 U/ml penicillin and 500 μg/ml streptomycin. Citrated plasma was stored at −80°C before analysis.
Animals were monitored continuously for disease development as described previously (8, 9, 16) and euthanized according to approved criteria when indicated. Vital signs including temperature (T), respiratory rate (RR) and heart rate (HR) were monitored. Complete blood counts (CBC) were determined with a Horiba ABX Micros 60 Hematology Analyzer (Horiba, Irvine, CA). Fibrinogen levels were determined by reference to a standard curve using the KC4 coagulation analyzer. For the standard curve, bovine thrombin is added to a reference plasma of known fibrinogen content and the clotting time is inversely proportional to the fibrinogen content. Plasma chemistry analyses were performed by IDEXX Laboratories (Westbrook, ME). Normal baboon values (mean ± S.D.; from 37 healthy animals) are as follows: WBC 8.1 ± 2.5/ μl; RBC, 5.1 ± 0.4 × 10⁶/μl; platelets, 276.2 ± 52.5 × 10⁴/μl; BUN, 14.2 ± 3.0 mg/dL; creatinine, 0.5 ± 0.1 mg/dL; AST 50.8 ± 19.3 U/L; LDH 310.4 ± 72.1 U/L; total protein 5.9 ± 0.5 g/dL; albumin 3.8 ± 0.3 g/dL; APTT, 40.4 ± 5.8 seconds; hematocrit 38.6 ± 2.8 %; hemoglobin 10.9 ± 1.1 g/dL. Animals surviving to Day 7 post-challenge were considered to be long-term survivors. All 7-day survivors were visibly recovered and had no clinical appearance of illness.
Toxin Challenge
Purified recombinant Stx1 was provided by Dr. Vernon Tesh (Department of Microbial and Molecular Pathogenesis, Texas A&M University System Health Science Center, College Station, TX) and was prepared from cell lysates obtained from E. coli DH5 harboring plasmid pCKS112, which contains the stx1 operon under control of a thermoinducible promoter (9, 17). Stx1 was purified from cell lysates by sequential ion exchange and chromatofocusing chromatography. Purity of toxins was assessed by SDS-PAGE with silver staining and by Western blot analysis. Prepared toxins contained <0.1 ng endotoxin per ml determined by Limulus amoebocyte lysate assay (Associates of Cape Cod, Inc., East Falmouth, MA).
An indwelling catheter was placed in the forearm cephalic vein for bolus infusion of toxin (1-2mLs). A second catheter was inserted into the femoral vein by venous cutdown and secured subcutaneously by an internal injection cap (Braun) where it remained for the rest of the study period and was used for blood draws, infusion of saline to replace insensible loss, central venous pressure monitoring, and anesthesia. All animals received Baytril (enrofloxacin; 10mg/kg i.m.) prior to cutdown and catheter placement on Day 0. Baboons then receive either prophylactic Levaquin (levofloxacin; 3.5mg/kg i.v. bolus) or Baytril (10mg/kg i.m.) each day over the experimental period. Animals were weighed daily and toxin-induced hypovolemia was controlled with isotonic saline using criteria developed in previous studies (18).
Bacteria Challenge and aPC Infusion
The cephalic vein catheter was used to infuse E.coli, B. anthracis bacteria or sterile saline to replace insensible loss and to monitor central venous pressure and anesthesia level. An additional percutaneous catheter was inserted in the saphenous vein in one hind limb and the catheter advanced to the inferior vena cava; this catheter was used for sampling blood. E.coli B7 O86a:K61 (19) ATCC 33985) or B.anthracis deltaSterne strain (pXO1-pXO2-) were grown in broth overnight with mixing, collected by filtration, washed and re-suspended in sterile saline before infusion. Live bacteria were quantitated using the BacTiter-GloTM Microbial Cell Viability Assay (Promega, Madison, WI) before infusion to confirm challenge dose (9). Blood was drawn at T0, followed immediately by E.coli (5×10⁹ CFU/kg; n=3) or B.anthracis deltaSterne infusion (0.7~3 × 10⁹CFU/kg) over 2 hours, typically at 0.2ml/min. After infusion, E.coli challenged animals did not receive additional treatment. Animals to receive B.anthracis deltaSterne were randomized to receive either bacteria alone (n=4) or pre-treatment with activated protein C (aPC, drotrecogin alfa, activated; Eli Lilly and Co., Indianapolis, IN) followed by bacteria challenge (n=4). Animals treated with aPC received a bolus injection of 3mg/kg at T (-10min). A two-hour bacterial infusion then was initiated at T0hrs with concomitant infusion of aPC at 64 ug/kg/min for 6 hours. B.anthracis +/− aPC animals received levofloxacin (7mg/kg over 1 hour) four hours after the start of the bacterial infusion and daily thereafter. This antibiotic regimen was included to more closely mimic a clinical setting.
Bacteremia was confirmed by traditional plating methods using blood obtained at T2hrs just after finishing the infusion and at T4hrs, just before the antibiotics were given. Colony counts varied according to the loading dose. For a 1×10⁹ CFU/kg challenge, colony counts were near 1×10⁴ CFU/ml at T2hrs and 100 CFU/ml at T4hrs. Colony counts on blood sampled between days 2 to 7 were consistently negative on all animals.
Data Analysis
Statistics
Data were analyzed for differences between baboon groups using Student’s T-test, assuming equal variance. To identify the relationships of plasma mtDNA and bDNA to organ function in the anthrax baboon model, Pearson Correlation coefficients were calculated using SPSS between mtDNA and bDNA levels and the clinical measurements. Supplemental Table 1 shows the how the clinical variables correlated with mtDNA and bDNA levels. Only those relationships found to have R2 values with a P<0.01 on initial analysis were subjected to further analysis. Post-challenge survival differences due to aPC treatment were calculated with the log-rank (Mantel-Cox) test.
RESULTS
Bacteremia and bacterial DNA in lethal anthrax sepsis
Infusion of attenuated B.anthracis in this nonhuman primate model results in high-grade bacteremia similar to that seen after germination of inhaled anthrax spores (20, 21) and produces septic responses typical of those seen in clinical experience (21) and experimental modeling (9, 22, 23). Anthrax exotoxins are known virulence factors independent of bacteremia (24). To study the specific contribution of sepsis to organ failure and death, baboons were challenged with an anthrax strain (deltaSterne) altered to remove exotoxins (25). The contribution of endogenous inflammation to the sepsis syndrome was assessed using aPC, which attenuates progression of sepsis to organ failure (severe sepsis) and death in baboons without an effect on bacteremia per se.
More than 104 CFU/ml of bacteria were found in plasma at the end of the infusion (Fig 1). Antibiotics were administered 2 hours after the end of the bacterial challenge and daily thereafter. Bacterial culture counts fell rapidly after antibiotic administration and were negative by 24 hours in all animals. Pre-treatment with aPC had no effect on quantitative blood cultures.
Figure 1. aPC does not alter bacteremia levels.
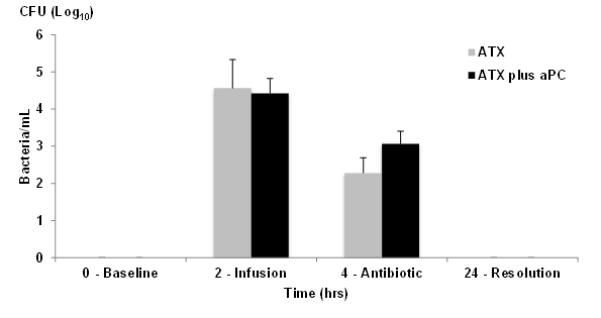
Blood was drawn before (T0hrs) infusion, just at the end of B.anthracis deltaSterne infusion (T2hrs) and at T4hrs just before administration of levofloxacin (7mg/kg) and cultured for determination of CFU/ml. Grey bars are without aPC pre-treatment, black bars are with aPC pre-treatment. All animals received antibiotic treatment daily (n=4/group). Colony counts on blood sampled between days 2 to 7 were consistently negative.
Bacteremia was also readily identified using qPCR for 16S bacterial DNA (Fig 2A) isolated from plasma and amplified using primers that have no cross reactivity with mitochondrial ribosomal DNA (see Supplement Fig 1). At 10 hours post-challenge, bDNA levels were elevated at 69.9 ± 4.2ng/ml. As with the quantitative blood cultures, pre-treatment with aPC (dotted line) had no significant effect on bDNA load. bDNA titers fell rapidly after antibiotic treatment, but detection of bDNA was still more sensitive than blood cultures. bDNA was still easily detectable at ≤10 ng/mL in plasma at 24 hours (P<0.01 vs basal 4.2 ± 1.0ng/ml). bDNA was undetectable in plasma by 48 hours post-challenge.
Figure 2. mtDNA changes are consistent with survival outcome.
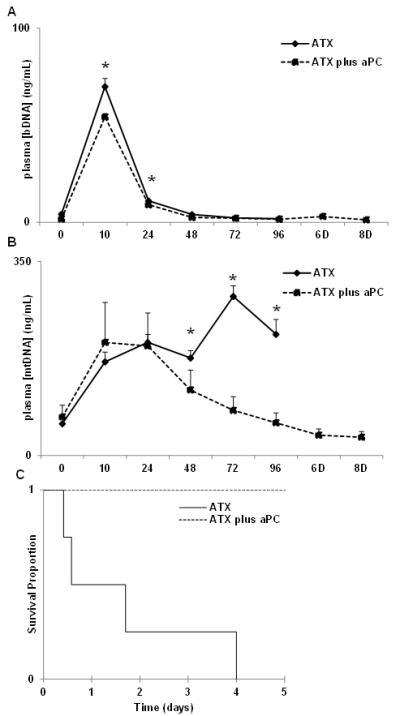
Intravenous infusion of B.anthracis results in increased plasma bDNA levels by 10 hours post-challenge (A) which decline but remain detectable up to 48 hours. (B) mtDNA levels peaked by 10 hours, remained elevated without therapeutic treatment, and all these animals required euthanasia by Day 4 post-challenge. aPC treatment prompted reduction in plasma mtDNA levels and resulted in survival of all treated animals (C; Kaplan Meier; n=4/group, p<0.001).
Mitochondrial DNA in lethal sepsis
mtDNA levels rose markedly in parallel with bacteremia in all animals infused with B.anthracis deltaSterne, showing that anthrax sepsis caused tissue injury directly and immediately. mtDNA levels during anthrax bacteremia peaked by 10 hours post-challenge at approximately 200 ng/mL either with or without aPC pre-treatment (Fig 2B). In animals not treated with aPC, mtDNA levels remained persistently elevated (solid line) at 48 hours and beyond, well after bacteria and bDNA disappeared from the blood. All these untreated animals progressed to irreversible multiple organ failure and were non-survivors (Fig2C). Baboons pre-treated with aPC (dotted line) were exposed to the same initial bacteria challenge. In contrast, their plasma mtDNA levels decayed rapidly after their bacteremia resolved. Thus tissue injury did not persist after resolution of the bacteremia and all of these animals survived. Since the groups cleared bacteremia similarly (Figs. 1,2A), this suggests that in this model, aPC prevented persistent endogenous inflammatory tissue injury after bacteremia was cleared.
Bacterial and mitochondrial DNA in sterile tissue injury
Shiga-like toxin 1 (Stx1) is a ribosome-inactivating toxin that causes progressive cellular injury and organ injury, particularly in the kidneys. Stx1 challenge has been characterized extensively in this baboon model and leads to death from hemolytic uremic syndrome and acute renal failure (8, 16) . Stx1 itself is sterile,so its administration will cause toxic rather than infective tissue injury. After high dose Stx1 challenge, plasma mtDNA levels progressively increased as the animals’ conditions deteriorated (Fig.3). At this dose (100ng/kg), renal injury is accompanied by increasing plasma BUN and creatinine, and decreasing urinary output and loss of glomerular function, leading to acute renal failure and euthanasia by day 3 post-challenge (8). Circulating bDNA levels were insignificant (Fig.3) confirming that cellular injury and death after Stx1 was independent of bacteria due to exogenous infection or indirect endogenous sources like gut translocation of bacteria (26).
Figure 3. Non-infectious toxin challenge increased only mtDNA.
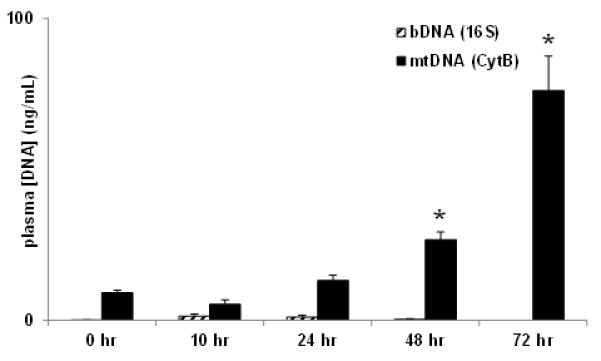
Baboons (n=3) were challenged with purified Stx1 (50ng/kg, i.v.) on Day 0. Prophylactic antibiotic was administered daily. All animals succumbed with acute renal failure and organ damage necessitating euthanasia by 72-74 hrs post-challenge. (* p<0.05)
Bacterial and mitochondrial DNA in sub-lethal E.coli infection
To further evaluate the spectrum of tissue injury in infection, we quantified circulating bDNA and mtDNA in a well-characterized model of sub-lethal E. coli bacteremia. Baboons respond to this challenge with fever, tachypnea and transient leukopenia. The SIRS response is self-limited however, as judged by the transient cyokine and complement activation and the mild increases in liver function tests that are seen (27-29). As with lethal anthrax sepsis, bDNA became markedly elevated during the bacterial infusion phase (Fig.4) and its concentration subsequently decayed rapidly as circulating bacteria were cleared by the animals. Also as with lethal sepsis, plasma mtDNA concentrations paralleled bDNA levels during the bacteremia itself. Critically though, the mtDNA injury signal disappeared immediately after the cessation of infusion, returning to baseline even before bDNA was totally cleared. This contrasts strongly with events seen in the lethal sepsis model: there, tissue injury signals persisted after bacterial clearance; right up to the time animals were euthanized (Fig 2B). These observations suggest that a self-perpetuating SIRS response due to release of cellular DAMPs including mtDNA (3) is initiated by lethal, but not by non-lethal bacteremia. These findings also suggests mtDNA may be an appropriate biomarker in such cases that reports the severity and outcome of infectious SIRS.
Figure 4. Sub-lethal septic challenge with E. coli B7 O86a:K61.
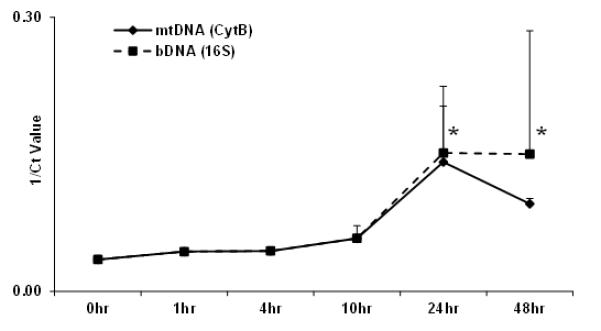
Both bacterial and mitochondrial DNA are detected after E.coli infusion of baboons (n=3). The infection is self-limiting with rapid bacterial clearance and reduced mtDNA by 48 hours post-challenge. (* p<0.05)
Multiple Organ Failure in SIRS versus Sepsis
The above data show that bDNA is a PAMP and that its levels correlate with bacteremia per se whereas mtDNA is a DAMP that reports tissue injury from SIRS. We investigated this in more detail using physiologic data from the B.anthracis deltaSterne model that was lethal unless the animals were protected with aPC pre-treatment.
Cardiorespiratory dysfunction
Heart rate and respiratory rate were monitored as clinical markers for the effects of anthrax sepsis on the heart and lungs. Both markers rose with the onset of bacteremia. Regression analysis shows changes in respiratory rates over time are closely related to mtDNA concentration (Fig 5b), and not to bDNA concentration (Fig 5a). Respiratory rates did not vary with bDNA and simply increased over time in this lethal sepsis model. With aPC administration, respiration rates remained normal irrespective of DAMP or PAMP concentrations, and in all animals aPC prevented tachypnea. Thus, aPC altered the respiratory response to inflammatory stimuli, not simply to bacteremia. This suggests that it is tissue injury rather than the presence of bacteria that drives tachypnea in this severe sepsis model. It also raises the possibility that the persistent circulation of DAMPs drives respiratory responses to sepsis after bacterial PAMPs are cleared.
Figure 5.
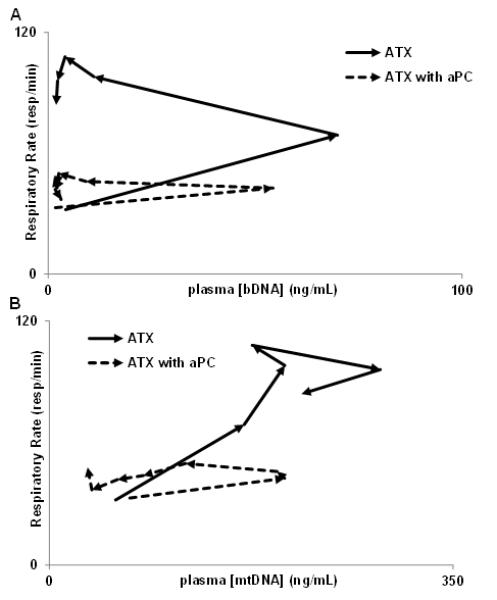
aPC alters the relationship between inflammatory stimuli and respiratory rate over time. Arrows (→) denotes course of relationship over time here and in Figures 7 & 8. Respiratory rate does not vary with bDNA (above), rather, without aPC, the respiratory rate simply increases over time. In distinction, the respiratory rate does vary with mtDNA concentration without aPC (below, R2=0.784). In both cases aPC prevents tachypnea.
Hepatic and renal dysfunction
Liver and kidney function (Fig 6) were markedly spared in anthrax challenged animals pretreated with aPC, consistent with declining mtDNA concentrations (Fig 2B). aPC blunted increases in plasma transaminases (AST, ALT) reflective of hepatocellular injury (Fig 6 A,B) and increases in blood urea nitrogen (BUN) and creatinine reflective of kidney injury (Fig 6 C, D). Without treatment, all these markers of septic solid organ injury showed dramatic increases after anthrax infusion beginning about 6 hours post-challenge and continuing through 24 hours. Lesser effects on organ function occurred after aPC despite the cohorts clearing bacteria and bDNA identically. Decreased solid organ dysfunction after aPC treatment paralleled diminished circulating mtDNA. This suggests endogenous responses to sepsis cause can cause a substantial amount of the cellular injury in this model of anthrax sepsis which has previously been attributed to the presence of the bacteria.
Figure 6. Markers of septic organ injury.
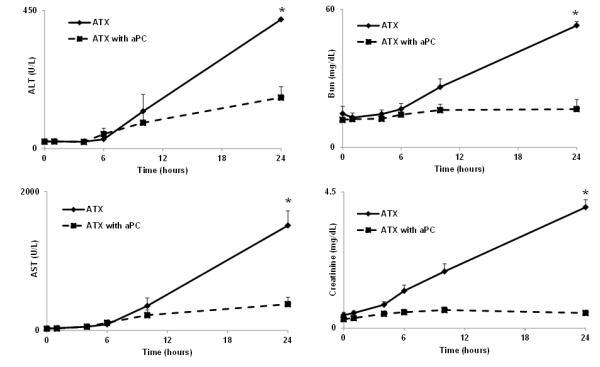
Plasma transaminases (A,B; AST, ALT) were measured as markers for hepatocellular injury in sepsis and SIRS over the first 24 hours. Creatinine and blood urea nitrogen (BUN) were measured as markers for kidney injury (C,D). All these markers of septic organ injury showed dramatic increases after anthrax infusion beginning around 6 hours and continuing through 24 hours. Thus, liver and kidney function were progressively compromised in sepsis due to B. anthracis.
Hematologic dysfunction
Plasma fibrinogen (Fig. 7A) and platelet levels (9) fall early in high-grade sepsis complicated by disseminated intravascular coagulation. Fibrinogen levels usually then rebound as a reflection of the hepatic acute phase response. Sepsis induced by B.anthracis deltaSterne led to a rapid and precipitous fall in fibrinogen during the period of bacteremia itself, followed by slow recovery. aPC is a strong anti-coagulant and it significantly mitigated decreases in fibrinogen (p<0.0001 at T4,6,10 hrs). mtDNA concentration did not correlate with plasma fibrinogen levels (Fig 7C) or platelet levels (data not shown) regardless of treatment. Rather, fibrinogen levels were linked to the presence of bDNA (Fig 7B). Thus, the presence of bacterial PAMPs may be specific contributory factors for the induction of disseminated intravascular coagulation in this severe sepsis model.
Figure 7. Disseminated intravascular coagulation is linked to bacteremia.
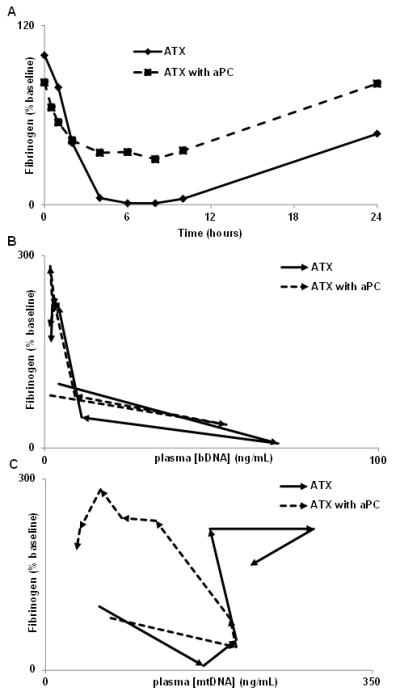
The consumptive coagulopathy precipitated by anthrax bacteremia depletes fibrinogen rapidly and is mitigated by aPC treatment (A; p<0.0001 T 4, 6 and 10 hr) and correlates with bDNA levels (B). Regardless of treatment, mtDNA concentration did not correlate to plasma fibrinogen level (C). Thus, presence of bacteria appears specifically to induce DIC, whereas the inflammatory response to tissue injury as monitored by mtDNA does not cause DIC, even when it is initiated by bacteremia.
DISCUSSION
Sepsis can kill the host through residual SIRS long after pathogens have been cleared. PAMPs and DAMPs are the molecular instigators of SIRS responses to pathogens and tissue injury, but similarities in the inflammatory pathways they activate mean that continued infection, SIRS due to sterile injury or SIRS due to earlier sepsis can look very similar. We studied this problem by comparing circulating DAMPs and PAMPs in non-human primate models of 1) antibiotic treated but nonetheless lethal anthrax sepsis, 2) identical lethal anthrax sepsis with aPC attenuation of endogenous responses, 3) sub-lethal E. coli sepsis and 4) lethal sterile tissue injury due to Stx1. We used bacterial 16S-rDNA as our biomarker for bacterial sepsis. Mitochondrial cytochrome B DNA was our biomarker for cellular injury, but it is also a DAMP that initiates inflammation independent of bacteremia (3). We show here using these biomarkers that treated lethal sepsis can be resolved into an initial period of tissue injury by the pathogen followed a period of sterile inflammation. Progressive secondary tissue injury, sustained release of DAMPs and death were averted by aPC. Suppression of DAMP release also correlated with diminished organ injury and survival from otherwise lethal bacteremia. Similarly, progression of SIRS and death after bacterial clearance were not seen in the self-limited E.coli infection where DAMP release stopped spontaneously after bacteremia cleared.
The data show pathogens cause SIRS and organ dysfunction directly, but that when severe enough, bacteremia left ongoing residual tissue injury in its wake that was reflected by mtDNA. There was increasing mtDNA but essentially undetectable bDNA levels in the animals challenged with Stx1, supporting the discriminatory value of the two biomarkers in these settings. Control studies (Suppl Fig 1) showed detection thresholds for bDNA were about 100 fg/mL without cross-recognition of mtDNA. This level of sensitivity and specificity will be needed if we are to use these PCR assays for clinical discrimination between sepsis and SIRS.
The usual cause of morbidity and mortality after sepsis and SIRS is multiple organ failure. In this nonhuman primate model of high-grade sepsis, clinical diagnostic blood tests reflect organ injury as assessed by direct pathologic examination (9). We observed here that aPC pre-treatment had no effect on bacterial PAMP load (Figs 1,2A) but did decrease DAMP load and lessened evidence of organ failure. Pre-treatment with aPC also helped us resolve the contributions of bacteremia per se and endogenous SIRS to the organ injury initiated by bacteremia.
We investigated these relationships further by mathematically analyzing the correlation between mtDNA and bDNA concentrations and clinical markers of organ injury. We did this over time both with and without aPC rescue. The mechanisms of aPC protection are incompletely understood, but aPC has both anti-coagulant and direct cytoprotective activities (30, 31). Either of these actions could improve tissue perfusion or reduce inflammation and thus contribute to the decreased cellular injury seen. After preliminary assessment of Pearson correlation coefficients (see Suppl. Table 1), significant correlations between biomarker concentration and organ injury (p<0.01) were subjected to further analysis. Respiratory rate is a simple assessment of early acute lung injury. It becomes a complex variable late in sepsis as animals become acidotic and develop ventilator and renal failure, but intervention with aPC altered the relationship between infection and respiration rate in a fundamentally unexpected way. Respiratory rate (RR) never correlated with bDNA (or bacterial counts) (Fig 5). In aPC-untreated animals, RR simply increased until terminal decompensation. With aPC treatment, RR was simply unchanged even though bDNA rose and fell during the acute bacteremia phase. In contrast, respiration rates varied directly and significantly with mtDNA levels in untreated animals. With aPC pre-treatment, this link was broken and respiration rates failed to vary with mtDNA. These findings suggest DAMPs from septic injury, rather than the bacterial PAMPs that drive DAMP release, may cause tachypnea in this model. An opposite pattern was seen examining the hematologic manifestations of severe sepsis and SIRS. At no time did plasma fibrinogen levels bear any relationship to mtDNA (Fig 7C), whereas fibrinogen concentration was strongly inversely related to bDNA (P<0.01, Fig 7B). Thus, bacterial PAMPs appear associated with fibrinogen consumption and disseminated intravascular coagulation, whereas in this model mtDNA DAMPs have minimal association with coagulopathy.
These data generally suggest that when SIRS persists after appropriate anti-microbial therapy it may be due to continuing DAMP release rather than persistent infection. So whereas sepsis is usually defined as SIRS with reasonable expectation of an invading pathogen being the cause (32), this definition is clearly imprecise and bacterial pathogens are often assumed to be present in clinical SIRS when none are found in cultures. Our results suggest that where infection and tissue injury can be defined with precision by biomarkers it may be more useful to define “infection” as active tissue invasion by pathogens, “SIRS” as the innate immune response to alarmin release from any source and “sepsis” as an infective challenge sufficient to cause SIRS.
Thus antibiotics can kill bacteria but cannot eliminate SIRS and biologic response modifiers (like aPC) may block SIRS by preventing a vicious cycle of cellular injury and DAMP release. Recent studies on extracellular histone DAMPs (33-35) show that their release in response to sepsis can activate TLR2 and TLR4 and that extracellular histone signaling can lead to death. Those mechanistic studies are of particular interest here since histones are pharmacologically targeted by aPC, which cleaves them and reduces their cytotoxicity (35). Yet suppression of inflammation is achieved at the risk of potentiating active or persistent infections (36-38).
So although antibiotics and anti-inflammatory therapies may be complementary, combining them is most likely to improve outcomes if they can be used at a time and in a sequence appropriate to ongoing molecular pathophysiology and anti-inflammatory strategies used incorrectly can blunt needed immune responses to sepsis. Inflammatory organ failure is also exaggerated in baboon sepsis compared with human sepsis, and human sepsis is typically low-grade compared with experimental models. Thus although aPC is effective in mitigating septic organ failure in baboons it has not been found clinically effective in humans. Thus, the differences between baboon and human sepsis preclude our findings being used to apply aPC directly to human disease.
Experimentally however, we found that using aPC in baboon anthrax was an effective model for discriminating the direct effects of sepsis and secondary inflammation. These experimental conditions also yield insight into the relationships between the severity of sepsis and SIRS as assayed by DNA biomarkers and organ failure. It would be premature to use these biomarkers clinically in humans. Highly structured, timed collections such as those we used here in high-grade animal sepsis models only let us begin to understand the significance of DNA biomarkers. The rapid and marked fluctuations seen early in sepsis explain why “spot measurements” will be difficult to interpret (39) and moreover, long-term persistence of damage signaling rather than its early occurrence may be the precursor of organ failure.
We do propose however, that with further study, biomarkers reflecting the activity of PAMPs and DAMPs may prove important in directing the timing and use of antibiotics and biologic response modifiers in clinical practice. Future studies must test those hypotheses directly in human samples and subjects.
Supplementary Material
Supplementary Figure 1. Sensitivity and Specificity of Primers Controls are shown for cytochrome B and 16S primers, showing sensitivity and specificity for their targets. (A) Cytochrome B primers do not detect any of three distinct kinds of bDNA: Gram-negative (E. coli), Gram-positive (S. aureus), and anaerobe (B. fragilis). mtDNA was able to be distinguished at less than 1 pg/mL. (B) 16S primers do not detect mtDNA, but show equivalent level of detection for all three kinds of bDNA assayed. bDNA was able to be distinguished at less than 1 pg/mL.
Supplementary Table 1. Pearson Correlation Coefficients Pearson Correlation Coefficients were calculated to assess relationships between clinical values and our markers (mtDNA for DAMPs, bDNA for PAMPs). Only those correlations with p<0.01 were subjected to further analysis.
ACKNOWLEDGEMENTS
The authors gratefully acknowledge technical assistance from Danielle Day, Valta Freeman, Scott Freeman and Diann Debord (BUSM).
This work was supported by NIH/NIGMS grant R01 GM089711 and Department of Defense CDMRP/DRMRP hypothesis development award DR080924 (to C.J.H.) and by NIH/NIAID grants RO1 AI058107, UO1 AI1075386, and U19 AI062629 (to S.K.).
Footnotes
Conflicts of Interest: No conflicts of interest for any authors
This is a PDF file of an unedited manuscript that has been accepted for publication. As a service to our customers we are providing this early version of the manuscript. The manuscript will undergo copyediting, typesetting, and review of the resulting proof before it is published in its final citable form. Please note that during the production process errors may be discovered which could affect the content, and all legal disclaimers that apply to the journal pertain.
REFERENCES
- 1.Matzinger P. Tolerance, danger, and the extended family. Annu Rev Immunol. 1994;12:991–1045. doi: 10.1146/annurev.iy.12.040194.005015. [DOI] [PubMed] [Google Scholar]
- 2.Janeway CA, Jr., Bottomly K. Signals and signs for lymphocyte responses. Cell. 1994;76(2):275–285. doi: 10.1016/0092-8674(94)90335-2. [DOI] [PubMed] [Google Scholar]
- 3.Zhang Q, Raoof M, Chen Y, Sumi Y, Sursal T, Junger W, Brohi K, Itagaki K, Hauser CJ. Circulating mitochondrial DAMPs cause inflammatory responses to injury. Nature. 2010;464(7285):104–107. doi: 10.1038/nature08780. [DOI] [PMC free article] [PubMed] [Google Scholar]
- 4.Kopterides P, Siempos II, Tsangaris I, Tsantes A, Armaganidis A. Procalcitonin-guided algorithms of antibiotic therapy in the intensive care unit: a systematic review and meta-analysis of randomized controlled trials. Crit Care Med. 2010;38(11):2229–2241. doi: 10.1097/CCM.0b013e3181f17bf9. [DOI] [PubMed] [Google Scholar]
- 5.Zhang Q, Itagaki K, Hauser CJ. Mitochondrial DNA is released by shock and activates neutrophils via p38 map kinase. Shock. 2010;34(1):55–59. doi: 10.1097/SHK.0b013e3181cd8c08. [DOI] [PubMed] [Google Scholar]
- 6.Lucignano B, Ranno S, Liesenfeld O, Pizzorno B, Putignani L, Bernaschi P, Menichella D. Multiplex PCR Allows Rapid and Accurate Diagnosis of Bloodstream Infections in Newborns and Children with Suspected Sepsis. Journal of Clinical Microbiology. 2011;49(6):2252–2258. doi: 10.1128/JCM.02460-10. [DOI] [PMC free article] [PubMed] [Google Scholar]
- 7.Stearns-Kurosawa DJ, Collins V, Freeman S, Debord D, Nishikawa K, Oh S-Y, Leibowitz CS, Kurosawa S. Rescue from lethal Shiga toxin 2-induced renal failure with a cell-permeable peptide. Pediatric Nephrology (Berlin, Germany) 2011 doi: 10.1007/s00467-011-1913-y. [DOI] [PMC free article] [PubMed] [Google Scholar]
- 8.Stearns-Kurosawa DJ, Collins V, Freeman S, Tesh VL, Kurosawa S. Distinct physiologic and inflammatory responses elicited in baboons after challenge with Shiga toxin type 1 or 2 from enterohemorrhagic Escherichia coli. Infect Immun. 2010;78(6):2497–2504. doi: 10.1128/IAI.01435-09. [DOI] [PMC free article] [PubMed] [Google Scholar]
- 9.Stearns-Kurosawa DJ, Lupu F, Taylor FB, Jr., Kinasewitz G, Kurosawa S. Sepsis and pathophysiology of anthrax in a nonhuman primate model. American Journal of Pathology. 2006;169(2):433–444. doi: 10.2353/ajpath.2006.051330. [DOI] [PMC free article] [PubMed] [Google Scholar]
- 10.Weiler H. Regulation of inflammation by the protein C system. Critical Care Medicine. 2010;38:S18–S25. doi: 10.1097/CCM.0b013e3181c9cbb5. 10.1097/CCM.1090b1013e3181c1099cbb1095. [DOI] [PubMed] [Google Scholar]
- 11.Ruf W. New players in the sepsis-protective activated protein C pathway. J Clin Invest. 2010;120(9):3084–3087. doi: 10.1172/JCI44266. [DOI] [PMC free article] [PubMed] [Google Scholar]
- 12.Sarangi PP, Lee HW, Kim M. Activated protein C action in inflammation. Br J Haematol. 2009;148(6):817–833. doi: 10.1111/j.1365-2141.2009.08020.x. [DOI] [PMC free article] [PubMed] [Google Scholar]
- 13.Saxena S, O’Brien A, Ackerman E. Shiga toxin, Shiga-like toxin II variant, and ricin are all single-site RNA N-glycosidases of 28 S RNA when microinjected into Xenopus oocytes. J Biol Chem. 1989;264:596–601. [PubMed] [Google Scholar]
- 14.Tarr PI, Gordon CA, Chandler WL. Shiga-toxin-producing Escherichia coli and haemolytic uraemic syndrome. The Lancet. 2005;365(9464):1073–1086. doi: 10.1016/S0140-6736(05)71144-2. [DOI] [PubMed] [Google Scholar]
- 15.Kimmitt PT, Harwood CR, Barer MR. Toxin gene expression by shiga toxin-producing Escherichia coli: the role of antibiotics and the bacterial SOS response. Emerging Infectious Diseases. 2000;6(5):458–465. doi: 10.3201/eid0605.000503. [DOI] [PMC free article] [PubMed] [Google Scholar]
- 16.Stearns-Kurosawa DJ, Collins V, Freeman S, Debord D, Nishikawa K, Oh SY, Leibowitz CS, Kurosawa S. Rescue from lethal Shiga toxin 2-induced renal failure with a cell-permeable peptide. Pediatr Nephrol. 2011;26(11):2031–2039. doi: 10.1007/s00467-011-1913-y. [DOI] [PMC free article] [PubMed] [Google Scholar]
- 17.Tesh VL, Burris JA, Owens JW, Gordon VM, Wadolkowski EA, O’Brien AD, Samuel JE. Comparison of the relative toxicities of Shiga-like toxins type I and type II for mice. Infect Immun. 1993;61(8):3392–3402. doi: 10.1128/iai.61.8.3392-3402.1993. [DOI] [PMC free article] [PubMed] [Google Scholar]
- 18.Taylor FB, Jr., Tesh VL, DeBault L, Li A, Chang AC, Kosanke SD, Pysher TJ, Siegler RL. Characterization of the baboon responses to Shiga-like toxin: descriptive study of a new primate model of toxic responses to Stx-1. American Journal of Pathology. 1999;154(4):1285–1299. doi: 10.1016/S0002-9440(10)65380-1. [DOI] [PMC free article] [PubMed] [Google Scholar]
- 19.Taylor FB, Jr., Chang A, Esmon CT, D’Angelo A, Vigano-D’Angelo S, Blick KE. Protein C prevents the coagulopathic and lethal effects of Escherichia coli infusion in the baboon. J ClinInvest. 1987;79(3):918–925. doi: 10.1172/JCI112902. [DOI] [PMC free article] [PubMed] [Google Scholar]
- 20.Lincoln RE, Hodges DR, Klein F, Mahlandt BG, Jones WI, Jr., Haines BW, Rhian MA, Walker JS. Role of the lymphatics in the pathogenesis of anthrax. J InfectDis. 1965;115(5):481–494. doi: 10.1093/infdis/115.5.481. [DOI] [PubMed] [Google Scholar]
- 21.Jernigan JA, Stephens DS, Ashford DA, Omenaca C, Topiel MS, Galbraith M, Tapper M, Fisk TL, Zaki S, Popovic T, et al. Bioterrorism-related inhalational anthrax: the first 10 cases reported in the United States. EmergInfectDis. 2001;7(6):933–944. doi: 10.3201/eid0706.010604. [DOI] [PMC free article] [PubMed] [Google Scholar]
- 22.Fritz DL, Jaax NK, Lawrence WB, Davis KJ, Pitt ML, Ezzell JW, Friedlander AM. Pathology of experimental inhalation anthrax in the rhesus monkey. Lab Invest. 1995;73(5):691–702. [PubMed] [Google Scholar]
- 23.Vasconcelos D, Barnewall R, Babin M, Hunt R, Estep J, Nielsen C, Carnes R, Carney J. Pathology of inhalation anthrax in cynomolgus monkeys (Macaca fascicularis) Lab Invest. 2003;83(8):1201–1209. doi: 10.1097/01.lab.0000080599.43791.01. [DOI] [PubMed] [Google Scholar]
- 24.Moayeri M, Leppla SH. The roles of anthrax toxin in pathogenesis. CurrOpinMicrobiol. 2004;7(1):19–24. doi: 10.1016/j.mib.2003.12.001. [DOI] [PubMed] [Google Scholar]
- 25.Bradburne C, Chung MC, Zong Q, Schlauch K, Liu D, Popova T, Popova A, Bailey C, Soppet D, Popov S. Transcriptional and apoptotic responses of THP-1 cells to challenge with toxigenic, and non-toxigenic Bacillus anthracis. BMC Immunol. 2008;9:67. doi: 10.1186/1471-2172-9-67. [DOI] [PMC free article] [PubMed] [Google Scholar]
- 26.Deitch EA, Rutan R, Waymack JP. Trauma, shock, and gut translocation. New Horiz. 1996;4(2):289–299. [PubMed] [Google Scholar]
- 27.Kaneko T, Stearns-Kurosawa DJ, Taylor F, Jr., Twigg M, Osaki K, Kinasewitz GT, Peer G, Kurosawa S. Reduced neutrophil CD10 expression in nonhuman primates and humans after in vivo challenge with E. coli or lipopolysaccharide. Shock. 2003;20(2):130–137. doi: 10.1097/01.shk.0000068326.68761.34. [DOI] [PubMed] [Google Scholar]
- 28.Taylor FB., Jr. Staging of the pathophysiologic responses of the primate microvasculature to Escherichia coli and endotoxin: examination of the elements of the compensated response and their links to the corresponding uncompensated lethal variants. Crit Care Med. 2001;29(7 Suppl):S78–S89. doi: 10.1097/00003246-200107001-00026. [DOI] [PubMed] [Google Scholar]
- 29.de Boer JP, Creasey AA, Chang A, Roem D, Eerenberg AJ, Hack CE, Taylor FB., Jr. Activation of the complement system in baboons challenged with live Escherichia coli: correlation with mortality and evidence for a biphasic activation pattern. Infection and Immunity. 1993;61(10):4293–4301. doi: 10.1128/iai.61.10.4293-4301.1993. [DOI] [PMC free article] [PubMed] [Google Scholar]
- 30.Yasui HIRO, Gabazza EC, Tamaki SHIG, Kobayashi TETS, Hataji OSAM, Yuda HISA, Shimizu SHIN, Suzuki KOJI, Adachi YUKI, Taguchi OSAM. Intratracheal Administration of Activated Protein C Inhibits Bleomycin-induced Lung Fibrosis in the Mouse. American Journal of Respiratory and Critical Care Medicine. 2001;163(7):1660–1668. doi: 10.1164/ajrccm.163.7.9911068. [DOI] [PubMed] [Google Scholar]
- 31.Kerschen EJ, Fernandez JA, Cooley BC, Yang XV, Sood R, Mosnier LO, Castellino FJ, Mackman N, Griffin JH, Weiler H. Endotoxemia and sepsis mortality reduction by non-anticoagulant activated protein C. J Exp Med. 2007;204(10):2439–2448. doi: 10.1084/jem.20070404. [DOI] [PMC free article] [PubMed] [Google Scholar]
- 32.Levy MM, Fink MP, Marshall JC, Abraham E, Angus D, Cook D, Cohen J, Opal SM, Vincent JL, Ramsay G. 2001 SCCM/ESICM/ACCP/ATS/SIS International Sepsis Definitions Conference. Crit Care Med. 2003;31(4):1250–1256. doi: 10.1097/01.CCM.0000050454.01978.3B. [DOI] [PubMed] [Google Scholar]
- 33.Semeraro F, Ammollo CT, Morrissey JH, Dale GL, Friese P, Esmon NL, Esmon CT. Extracellular histones promote thrombin generation through platelet-dependent mechanisms: involvement of platelet TLR2 and TLR4. Blood. 2011;118(7):1952–1961. doi: 10.1182/blood-2011-03-343061. [DOI] [PMC free article] [PubMed] [Google Scholar]
- 34.Xu J, Zhang X, Monestier M, Esmon NL, Esmon CT. Extracellular Histones Are Mediators of Death through TLR2 and TLR4 in Mouse Fatal Liver Injury. Journal of Immunology. 2011;187(5):2626–2631. doi: 10.4049/jimmunol.1003930. [DOI] [PMC free article] [PubMed] [Google Scholar]
- 35.Xu J, Zhang X, Pelayo R, Monestier M, Ammollo CT, Semeraro F, Taylor FB, Esmon NL, Lupu F, Esmon CT. Extracellular histones are major mediators of death in sepsis. Nat Med. 2009;15(11):1318–1321. doi: 10.1038/nm.2053. [DOI] [PMC free article] [PubMed] [Google Scholar]
- 36.Abraham E, Anzueto A, Gutierrez G, Tessler S, San Pedro G, Wunderink R, Dal Nogare A, Nasraway S, Berman S, Cooney R, et al. Double-blind randomised controlled trial of monoclonal antibody to human tumour necrosis factor in treatment of septic shock. NORASEPT II Study Group. Lancet. 1998;351(9107):929–933. [PubMed] [Google Scholar]
- 37.Hoentjen F, van Bodegraven AA. Safety of anti-tumor necrosis factor therapy in inflammatory bowel disease. World J Gastroenterol. 2009;15(17):2067–2073. doi: 10.3748/wjg.15.2067. [DOI] [PMC free article] [PubMed] [Google Scholar]
- 38.Opal SM, Fisher CJ, Jr., Dhainaut JF, Vincent JL, Brase R, Lowry SF, Sadoff JC, Slotman GJ, Levy H, Balk RA, et al. Confirmatory interleukin-1 receptor antagonist trial in severe sepsis: a phase III, randomized, double-blind, placebo-controlled, multicenter trial. The Interleukin-1 Receptor Antagonist Sepsis Investigator Group. Crit Care Med. 1997;25(7):1115–1124. doi: 10.1097/00003246-199707000-00010. [DOI] [PubMed] [Google Scholar]
- 39.Puskarich MA, Shapiro NI, Trzeciak S, Kline JA, Jones AE. Plasma levels of mitochondrial DNA in patients presenting to the emergency department with sepsis. Shock. 2012 Jul 6; doi: 10.1097/SHK.0b013e318266a169. (ePub ahead of print) (PMID: 22777124) [DOI] [PMC free article] [PubMed] [Google Scholar]
Associated Data
This section collects any data citations, data availability statements, or supplementary materials included in this article.
Supplementary Materials
Supplementary Figure 1. Sensitivity and Specificity of Primers Controls are shown for cytochrome B and 16S primers, showing sensitivity and specificity for their targets. (A) Cytochrome B primers do not detect any of three distinct kinds of bDNA: Gram-negative (E. coli), Gram-positive (S. aureus), and anaerobe (B. fragilis). mtDNA was able to be distinguished at less than 1 pg/mL. (B) 16S primers do not detect mtDNA, but show equivalent level of detection for all three kinds of bDNA assayed. bDNA was able to be distinguished at less than 1 pg/mL.
Supplementary Table 1. Pearson Correlation Coefficients Pearson Correlation Coefficients were calculated to assess relationships between clinical values and our markers (mtDNA for DAMPs, bDNA for PAMPs). Only those correlations with p<0.01 were subjected to further analysis.