Abstract
Purpose: The authors investigated how the characteristics of the detectors used in a three-stage Compton camera (CC) affect the CC's ability to accurately measure the emission distribution and energy spectrum of prompt gammas (PG) emitted by nuclear de-excitations during proton therapy. The detector characteristics they studied included the material (high-purity germanium [HPGe] and cadmium zinc telluride [CZT]), Doppler broadening (DB), and resolution (lateral, depth, and energy).
Methods: The authors simulated three-stage HPGe and CZT CCs of various configurations, detecting gammas from point sources with energies ranging from 0.511 to 7.12 MeV. They also simulated a proton pencil beam irradiating a tissue target to study how the detector characteristics affect the PG data measured by CCs in a clinical proton therapy setting. They used three figures of merit: the distance of closest approach (DCA) and the point of closest approach (PCA) between the measured and actual position of the PG emission origin, and the calculated energy resolution.
Results: For CCs with HPGe detectors, DB caused the DCA to be greater than 3 mm for 14% of the 6.13 MeV gammas and 20% of the 0.511 MeV gammas. For CCs with CZT detectors, DB caused the DCA to be greater than 3 mm for 18% of the 6.13 MeV gammas and 25% of the 0.511 MeV gammas. The full width at half maximum (FWHM) of the PCA in the direction for HPGe and CZT detectors ranged from 1.3 to 0.4 mm for gammas with incident energy ranging from 0.511 to 7.12 MeV. For CCs composed of HPGe detectors, the resolution of incident gamma energy calculated by the CC ranged from 6% to 1% for gammas with true incident energies from 0.511 to 7.12 MeV. For CCs composed of CZT detectors, the resolution of gamma energy calculated by the CC ranged from 10% to 1% for gammas with true incident energies from 0.511 to 7.12 MeV. For HPGe and CZT CCs in which all detector effect were included, the DCA was less than 3 mm for 75% and 68% of the detected gammas, respectively, and restricting gammas to those having energy greater than 2.0 MeV increased these percentages to 83% and 77% for HPGe and CZT, respectively. Distributions of the true gamma origins and the PCA after detector characteristics had been included showed good agreement on beam range and some loss of resolution for the lateral profile of the PG emission. Characteristic energy lines were evident in the calculated gamma energy spectrum.
Conclusions: The authors found the following: (1) DB is the dominant source of spatial and energy resolution loss in the CCs at all energy levels; (2) the largest difference in the spatial resolution of HPGe and CZT CCs is that the spatial resolution distributions of CZT have broader tails. The differences in the FWHM of these distributions are small; (3) the energy resolution of both HPGe and CZT three-stage CCs is adequate for PG spectroscopy; and (4) restricting the gammas to those having energy greater than 2.0 MeV can improve the achievable image resolution.
Keywords: proton therapy, Compton camera, prompt gamma, detector, range verification
INTRODUCTION
The steep distal falloff at the end of the proton beam range and the nearly zero dose deposition beyond it makes it crucial that proton therapy treatments are delivered accurately. The importance of accuracy in proton therapy has motivated research into methods to measure and verify the range of the delivered treatment beam. During proton beam irradiation, excited nuclei in the tissue can emit prompt gammas (PGs) during the de-excitation process. Min et al.1 showed that PG production is correlated with dose falloff and suggested that it could be used to verify the beam range. Other groups have shown that PG may be useful for verifying dose2, 3 and for compositional analysis of the treated tissue since the PG spectrum is characteristic of the elemental nuclei.4
The results of these initial studies have led several researchers to suggest imaging the PG emission during treatment delivery as a means of verifying the in vivo proton beam range. However, currently no commercial gamma radiation detection systems are adequate for measuring both the energy of PGs and the direction of propagation needed to produce the images. The PGs from the most common elements in tissues have energies in the range of 1–15 MeV. For these relatively high-energy gammas, mechanical collimators like those used for single-photon emission computed tomography (SPECT) would need to be made thicker, which would lead to significant loss of spatial resolution. Electronically collimated Compton cameras (CC) (Refs. 5 and 6) attempt to solve this problem by requiring a gamma to scatter multiple times in the detector and then “collimating” it by calculating the incident energy and direction of the PG using the scattering angles, the energy deposits in the detector, and the Compton scattering formula. Many configurations have been suggested for CCs, but configurations with two or three stages are common and are referred to as two-stage and three-stage detectors, respectively. For a gamma to be properly detected by a two-stage CC, it must Compton scatter in the first stage and then be absorbed by photoelectric effect or through pair creation in the second stage. For a three-stage CC, a gamma must Compton scatter in each of the first two detector stages. Then, in the third detector stage, the gamma can interact by photoelectric effect, Compton scatter, or undergo pair creation. The three-stage CC does not require the PG to be completely absorbed and thus may be more efficient for high-energy PG detection.
Several research groups have studied the impact of the detector's characteristics, such as spatial resolution (i.e., pixel or voxel size) and energy resolution (including statistical energy deposition and Doppler broadening effects), on CC imaging. Ordonez et al.7, 8 analyzed the effect of the detector energy and spatial resolutions on the scattering angle derived from the Compton scattering formula. These investigators also showed that Doppler broadening significantly broadens the energy resolution for a two-stage CC for gammas with incident energies of 140 keV.9 Wilderman et al.10 used a Monte Carlo (MC) method to study the detector resolution effects on the distance of closest approach (DCA) for a two-stage CC with 140-keV incident gammas. This group calculated the spatial and energy resolutions both independently and in combination. The resolution obtained by adding the independent calculations in quadrature agreed with the calculation obtained by the simultaneous calculation to within 4%, indicating that the correlation between the resolutions is small. Mundy and Herman11 studied two-stage CCs for use in photon therapy and found that its performance was adequate to achieve 5-mm image resolution under certain circumstances. Kormoll et al.12 showed that Doppler broadening does not contribute significantly to the uncertainty in the first scattering angle for two-stage CCs but is the dominant source of uncertainty for large-angle scatters for three-stage CCs. However, to our knowledge, no studies have addressed the impact of detector effects on the spatial or energy resolution of three-stage CCs detecting PG emission from irradiated tissues.
The purpose of our current study was to investigate how the characteristics of the detectors used for the three CC stages affect the ability of the CC to accurately measure the emission distribution and energy spectrum of gammas emitted during proton therapy. The detector characteristics we studied included the material (high-purity germanium [HPGe] and cadmium zinc telluride [CZT]), Doppler broadening, and three resolutions: lateral, depth, and energy. To study how the effects due to these characteristics depend on the incident gamma energy, we simulated three-stage CCs of various configurations, detecting gammas from point sources with energies ranging from 0.511 to 7.12 MeV. We also simulated a proton pencil beam irradiating a tissue target to study how the detector characteristics affect the PG data measured by three-stage CCs in a clinical proton therapy setting.
MATERIALS AND METHODS
The distance of closest approach and the point of closest approach (PCA)
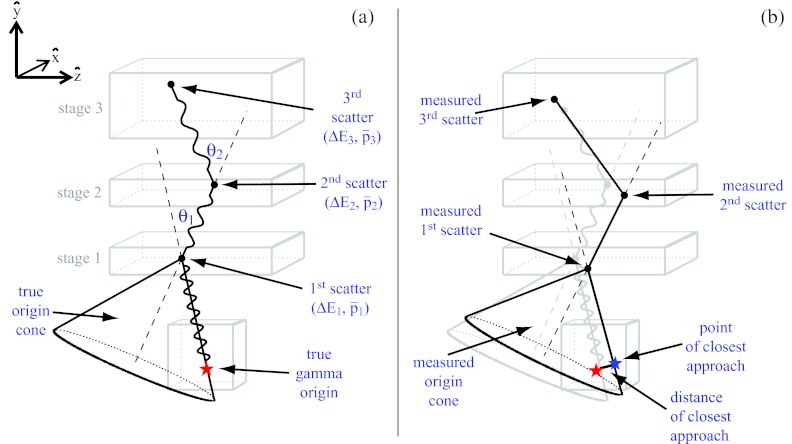
Figure 1a shows a gamma scattering in a three-stage detector. The energy deposits, ΔE1 and ΔE2, are detected in the first two stages, and the second scattering angle, θ2, is determined by the three interaction positions: p1, p2, p3. These values are used with the Compton scattering formula to derive the incident gamma energy, E0,13
| (1) |
where me is the mass of the electron and c is the speed of light. The initial scattering angle, θ1, is given by
| (2) |
The position of the gamma origin is not determined precisely but is restricted to the surface of the “true origin cone,” which has opening angle θ1 and apex p1. The origin cone axis is the line containing points p1 and p2. Singh6 referred to this method of determining the incident direction of a gamma as electronic collimation.
Figure 1.
(a) The “true” gamma origin cone derived from an ideal three-stage CC with perfect energy and spatial resolution in the detector stages. (b) The “measured” gamma origin cone derived from a three-stage CC with finite spatial and energy resolution in the detector stages.
The uncertainty in the electronic collimation of a CC comes from multiple sources. A significant source of uncertainty comes from Doppler broadening, the effect of the initial momentum of the Compton scattered electron on the scattering angle and the energy of the outgoing photon. The finite energy and spatial resolutions of the CC detectors produce additional uncertainty in the scattering angles, θ1 and θ2, the calculated energies, E0 and E1, and the origin cone's apex and axis [Fig. 1b]. Therefore, the “measured” origin cone from a finite resolution CC differs from the “true” origin cone from an ideal CC in position, opening angle, and axis direction, as shown in Fig. 1b.
A detected gamma's origin lies on the surface of the true origin cone [Fig. 1a], but it is some distance removed from the measured origin cone [Fig. 1b]. The minimum distance between the gamma origin and the measured origin cone is referred to as the distance of closest approach.10 The DCA is a measure of the electronic collimation error, and it is a useful figure of merit (FOM) for evaluating CCs. In order to understand the advantages of DCA as a FOM, it is instructive to first consider the more widely used6, 7, 12 FOM, Δθ, the uncertainty of the initial scattering angle. Δθ has the desirous feature of being independent of the distance between the gamma origin and the CC surface. However, Δθ does not take into account the uncertainties of the cone apex position and the cone axis orientation. Also, from Δθ alone the length of the uncertainty is unknown. Further, Δθ cannot be broken down into the individual spatial components; for proton beam range verification, the uncertainty in the spatial component corresponding to the direction of the beam, Δz in this study, is of special importance. Using DCA as the FOM addresses the limitations of Δθ. Because DCA is a length, it provides intuitive understanding of how the uncertainty in the electronic collimation affects the image resolution. It also combines the effects of all the uncertainties into a single statistic. A drawback of DCA is that it depends on the distance between the gamma origin and CC, larger distances produce large DCA values. Also, like Δθ, DCA does not provide information about the spatial direction of the uncertainty. To address the first drawback, DCA values should be calculated for a fixed CC to gamma origin distance; for our study, we set this distance to 10 cm. To address the second drawback, we use the PCA.
The PCA is the Cartesian point, (px, py, pz), on the surface of the measured gamma origin cone which is closest in space to the true gamma origin, (ϑx, ϑy, ϑz). The PCA for a detected gamma i is related to the DCA by the relationship . In addition to breaking down the uncertainty into the Cartesian components, the PCA provides a means to visualize the uncertainty. For a set of n detected gammas with known origins, there exists a corresponding set of points of closest approach, . Images of the gamma origins can then be created by plotting one- to three-dimensional distributions from Sϑ, and the effects of the detector uncertainties can be visualized by plotting similar one- to three-dimensional distributions from SPCA. Further, the full width at half maximum (FWHM) of the component distributions from the set provides estimates of the CC resolution in each of the three spatial directions. It should be noted that PCA is not a CC reconstruction method, and, therefore, it is not affected by the uncertainties of the reconstruction. However, determining the PCA, as well as the DCA, requires knowledge of the “true” gamma origin which is known in MC simulations but will be unknown for many real CC applications including proton beam range verification.
The Monte Carlo simulations
Our MC simulation software was developed using the Geant4 (v9.4.p01) toolkit14 and was originally used for three-stage CC efficiency studies.15, 16 It was also used in a CC reconstruction algorithm study.17 The MC model consists of a three-stage CC detecting gammas from point sources or secondary gammas produced during proton beam irradiation. To model the electromagnetic interactions for electrons, positrons, and photons, we used the G4 Livermore model, which includes Doppler broadening18, 19, 20 and is based on the Livermore data libraries.21 The remaining physical processes were modeled using the QGSP_BIC_EMY physics list provided with Geant4. Previous studies of ideal Compton cameras used this software with the EM Standard Physics option 1 instead of G4 Livermore.15, 16, 17 The Geant4 EM Standard Physics option 1 does not include Doppler broadening in the Compton scattering calculations.
The three-stage CCs in our model were composed of either HPGe or CZT detectors. HPGe has good spatial and energy resolutions and was determined by Robertson et al.16 to be the most efficient material for a three-stage CC. CZT has an effective atomic number of about 50 and thus produces more Doppler broadening during Compton scatters than does HPGe, which has an atomic number of 32. CZT also has slightly worse energy resolution. However, owing to its large bandgap, 1.57 versus 0.67 eV for Ge,22 CZT can operate at room temperature, whereas HPGe must be cooled to approximately liquid nitrogen temperature (77 K), making CZT better suited for use in a clinical environment. For all simulations in this study, the first two detector stages were 80 × 80 × 10 mm3 and the third stage was 80 × 80 × 30 mm3. In the model, the spacing between the phantom volume and the front face of the first detector stage in the CC was 10 cm. The spacing between the CC stages was 5 cm, which was determined by Peterson et al.15 to be the optimal detector spacing for detecting gammas of energy 6.13 MeV.
We based the size of the detectors used in our simulation on large detectors described in the literature. One similarly sized detector currently in use is the Compact Compton imager (CCI-1), a HPGe detector with dimensions 76 × 76 × 11 mm3, built and studied by Vetter et al.,23 who are also developing a 30-mm-thick detector. Another example is the University College of London HPGe CC built by ORTEC, which combines 152 4 × 4 × 4-mm3 pixels for a total surface area of 2432 mm2 and a depth of 0.4 mm.24 Additionally, large 3 × 3 arrays of 15 × 15 × 10-mm3 CZT detectors, have been developed by Zhang et al.,25 as well as even larger CZT arrays, such as the Burst Alert telescope, comprised of 32 768 4 × 4 × 2 mm3 pixels26 developed for applications in astrophysics.
For this study, our model tracked and recorded events in which a gamma Compton scatters in the first two detector stages and then scatters or is absorbed in the third stage. For these events we recorded the “true” initial energy, incident energy, interaction positions, and the energy depositions in each detector stage. The “true” initial energy and incident energy are equal unless the gamma scatters before reaching the first detector stage. Next, we calculated a measured value for each of these recorded events by modifying the recorded “true” value to reflect the uncertainties inherent in the measured values due to the characteristics of the detectors used in the CC stages. Both the true and measured values of the gamma interactions in the CC were stored and output by the model, thus allowing us to evaluate the CCs by directly comparing the true and the measured values.
Doppler broadening of Compton scattering interactions in the CC is a builtin characteristic of the electromagnetic physics models (described above) used in the MC calculations, and is therefore included in the output data from all MC calculations performed in this study. However, since the effects of the lateral, depth, and energy resolutions of the detectors, is not inherent in the MC physics models, the simulation of these effects was performed on the data after completion of the MC calculations. To simulate the lateral and spatial resolutions, we added an independent, uniformly distributed random number between and to each “true” interaction position, where δ is the simulated depth or lateral resolution of the CC detector stages. Detector energy resolution depends on both the material of the detector and the energy of the incident photon. For HPGe, we model the energy resolution FWHM using a formula from Owens
| (3) |
where E is the incident gamma energy and a1, a2, and a3 are semiempirical constants with values 2.16 × 10⁻³ keV, 1.82 × 10⁻⁶, and 1.042 keV2, respectively.27 Although this formula is more than 25 years old, it is still in agreement with current literature. For example, it predicts the 1.4 and 1.7-keV resolutions for 60 and 662-keV incident gamma reported by Vetter et al.23 and the 1.8 and 1.9-keV resolutions for 356 and 662-keV incident gamma reported by Alnaaimi et al.24 For CZT, we model the energy resolution FWHM using the formula developed by Du et al.28
| (4) |
To simulate the uncertainty in the “measured” energy depositions for both materials, we added a random mismeasurement factor ΔE to the “true” energy depositions where ΔE is given by
| (5) |
Here, s is an arbitrary scalar set to 1 for standard energy resolution, δ(E) is given by Eq. 3 for HPGe detectors and Eq. 4 CZT detectors, and N[0, 1] is a normally distributed random number with a mean of 0 and a standard deviation of 1. The factor converts the energy resolution δ(E) from the FWHM to the standard deviation and is derived from the formula , where σ is the standard deviation.29
The effects of Doppler broadening
We first studied the effects of Doppler broadening independent of the other detector characteristics. To verify that our simulated CC is ideal when Doppler broadening and the finite detector resolution effects are not included, we simulated the CC detection of 10 000 gammas from a 4.44 MeV point source. For this simulation only, we used the electromagnetic interaction package EM option 1, which does not simulate Doppler broadening in Compton scattering. This check showed that the CC produces ideal measurements with EM option 1; 99.95% of the calculated gamma energies were within 0.001 MeV of the true 4.44 MeV value, and 99.94% of the DCA values were less than 0.01 mm. These values are in agreement with the ideal values of 4.44 MeV and 0 mm, respectively. In order to study the effects of Doppler broadening, we ran a series of independent simulations using point sources with energies ranging from 0.511 to 7.12 MeV. These energies correspond to the gamma energy from positron annihilation or to the PG energy characteristic of 12C, 14N, 16O, or 40Ca, the most common PG-emitting elements in tissue. We determined the effect of Doppler broadening on the incident energy measured by the CC by subtracting the “true” incident energy of the gamma from the incident energy calculated with Eq. 1 using the “calculated” positions (without lateral or depth resolution effects) and energy depositions (without energy resolution effects) of the gamma in each detector stage during the simulation. We then calculated the “measured” gamma origin cones and the corresponding DCA and PCA for each detected gamma.
The effects of detector lateral, depth, and energy resolutions
After studying the effects from Doppler broadening alone, we simulated the effects of detector lateral resolution, depth resolution, and energy resolution independently of each other (but in addition to Doppler broadening). Measuring these effects without Doppler broadening would require us to change the physics package within Geant4, which may introduce inconsistencies into the results. More fundamentally, the amount of Doppler broadening is a property of the material used to make the detector. So unlike the position and energy resolutions, which depend on the detector designs and electronics, the amount of Doppler broadening is the same for all detectors of the same material.
Because CCs rely on the Compton scattering equations [Eqs. 1, 2] to collimate a gamma and to calculate the incident energy, both the energy resolution and the spatial resolutions of the detector stage affect the collimation and the energy resolution of the Compton camera. To determine the impact of the lateral resolution of the detector stages on the DCA and the calculated energy resolution, we ran the simulations for both detector materials, varying the spatial resolution parameter δ from 0 to 2 mm in increments of 0.5 mm. To determine the impact of detector depth resolution, we likewise varied the depth resolution parameter δ from 0 to 2 mm in increments of 0.5 mm. These ranges for the spatial resolution parameters are reasonable based on the published resolutions of HPGe (Refs. 23 and 30) and CZT (Refs. 31 and 32) CCs. To determine the effects of detector energy resolution, we included the factor ΔE [Eq. 5] in the simulations with the scale factor s set to 0.5, 1, and 2 to simulate a range of detector energy resolutions.
The combined detector effects
Next, we simulated the detector effects in combination. For these combined simulations, we used the same value for the lateral (x, z) and depth (y) resolutions. We started with the “baseline” HPGe and CZT detector values of 0.5 mm and 1 for the spatial resolutions and energy resolution scale factor s, respectively. Our choice of 0.5 mm as the baseline spatial resolution was motivated by the 0.5 mm resolution reported for HPGe by Vetter et al.23 and the 0.23–1.0 mm resolutions reported for CZT by Du et al.28 and Zhu et al.32 The choice of 1 for the scale factor s produces a Gaussian energy resolution with FWHM given by Eq. 3 for HPGe and Eq. 4 for CZT. We then tested two more combinations with the spatial resolution δ and energy resolution scale factor s, [δ, s], set to [1.0 mm, 1] and [2.0 mm, 2], to determine the effects of using detectors for the CC stages with resolution worse than the baseline.
The detector effects for proton pencil beam irradiation
To understand how the detector effects impact CC imaging of secondary gammas emitted during proton therapy, we simulated a 110 MeV proton pencil beam with a Gaussian spatial profile (σ = 1 mm) irradiating a phantom composed of average soft tissue as defined in the International Commission on Radiation Units (ICRU) Report No. 49.33 The beam central axis was 10 cm below the front face of the first detector and the beam traveled in the direction [Fig. 1a]. We repeated this simulation for HPGe and CZT and for [δ, s] combinations of [0.5 mm, 1], [1.0 mm, 1], and [2.0 mm, 2]. We first determined the cumulative DCA distributions for each of these detector resolution combinations. Next, using just the baseline [0.5 mm, 1] combination, we looked at the cumulative DCA distributions for gammas with incident energies below and above 2 MeV, as well as for incident energies within ±0.1 MeV of a common PG energy spectrum peak: 2.33, 4.44, 5.10, and 6.13 MeV. We then looked at the distribution of PCA values for each detected gamma along the central axis of the proton beam (-direction) and compared it to the dose depth curve. We also plotted the detected gamma PCA distributions in the directions transverse to the beam ( and ). Finally, to study the effects on the energy resolution of the gamma energy spectrum measured by the CC, we looked at the incident and calculated spectra of gammas detected by the baseline HPGe and CZT CCs.
RESULTS
The effects of Doppler broadening
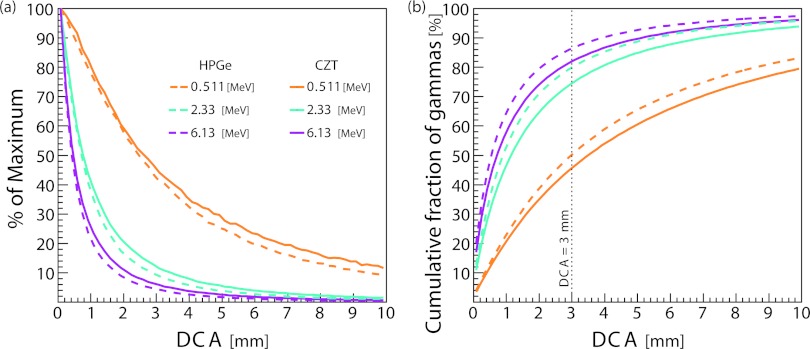
We first looked at the impact of Doppler broadening in the absence of all other detector effects. Figure 2a shows that the DCA due to Doppler broadening for three different gamma energies and for both detector materials. Comparisons of CC configurations using the DCA in this form are difficult because the DCA distribution is sharply peaked near zero and has a broad tail. Therefore, the cumulative DCA distribution [Fig. 2b] is more informative for the comparison of CC configurations. To enable the comparison of multiple CC configurations at multiple energies, we use the value of the cumulative distribution at DCA = 3 mm and abbreviate this statistic as DCA3. Though this comparison could be made at other DCA values, we chose 3 mm because it is the approximate length of clinical treatment margins used in proton therapy.34 Figure 2b shows the cumulative DCA distribution due to Doppler broadening for three different gamma energies and for both detector materials. For gammas with energy of 6.13 MeV, DCA3 = 86% for HPGe compared to 82% for CZT. When the gamma energy was reduced to 2.33 MeV, the DCA3 values fell to 80% and 75% for HPGe and CZT, respectively. For gammas of incident energy 0.511 MeV, DCA3 for HPGe and CZT fell further to 50% and 46%, respectively.
Figure 2.
(a) Distance of closest approach (DCA) and (b) the cumulative distribution of the DCA. Doppler broadening is included in this simulation, but the Compton camera has ideal resolution otherwise. CZT, cadmium zinc telluride; HPGe, high-purity germanium.
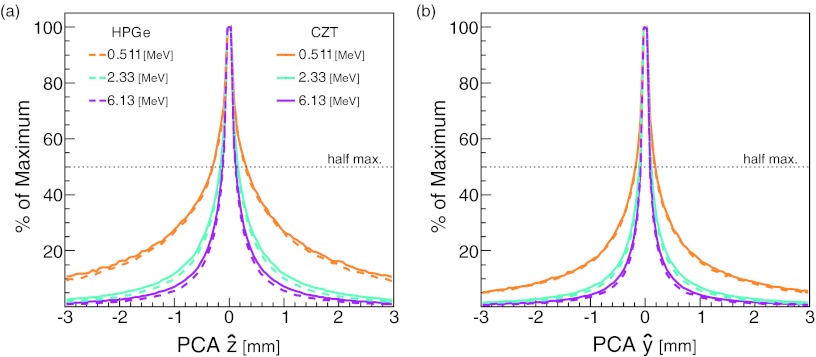
Figure 3a shows the distribution of the PCA in the direction for the detected gammas. The differences between the FWHM values for HPGe and CZT were small, 0.23 and 0.25 mm, respectively, for 6.13 MeV gammas. In contrast, the FWHM value shows a significant dependence on energy; for example, the FWHM for HPGe is 0.59 mm for 0.511 MeV gammas, a 160% increase over the FWHM for 6.13 MeV gammas. For gamma point sources, the and directions, parallel to the CC detector stages, have the same resolutions characteristics. However, the direction perpendicular to the detector stages, , has slightly better resolution than the parallel direction as shown by the distribution of the PCA values in the direction [Fig. 3b].
Figure 3.
PCA distributions due to Doppler broadening as measured by the (a) and (b) components of the PCA for gammas from a point source at position (x = 0, y = 0, z = 0).
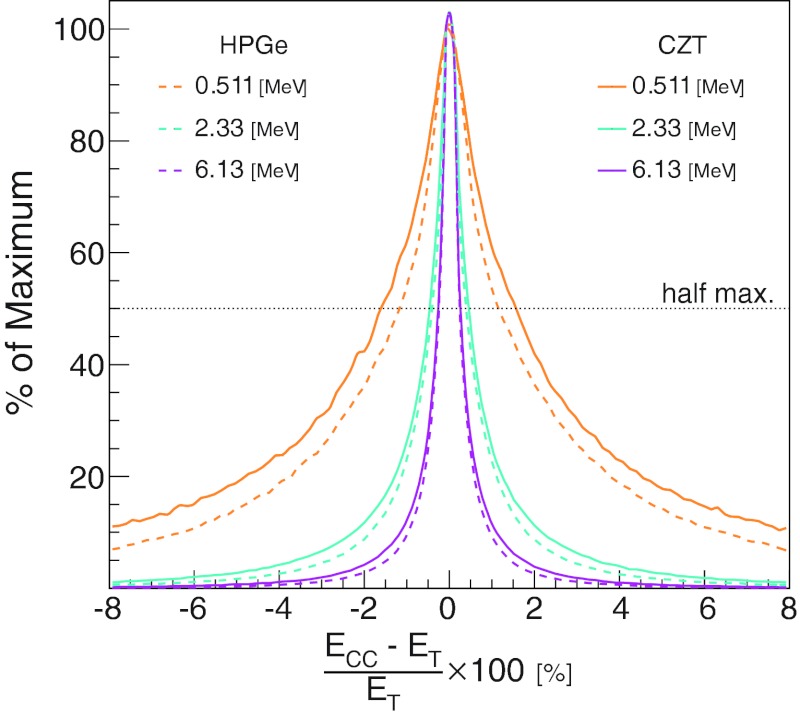
Figure 4 shows the energy spread factor (ESF) for the same two materials and three energies. The ESF for a detected gamma is
| (6) |
where ET is the true incident gamma energy and ECC is the energy calculated by the simulated finite resolution CC. The FWHM of this distribution gives the energy resolution. For the HPGe CC, we found the energy resolution to be 2.33%, 0.80%, and 0.50% for energies 0.511, 2.33, and 6.13 MeV, respectively. For CZT, we found the calculated energy resolution FWHM to be slightly worse: 3.2%, 0.94%, and 0.54% for energies 0.511, 2.33, and 6.13 MeV, respectively.
Figure 4.
Doppler broadening's effect on Compton camera energy resolution. Ecc is energy of the gamma as calculated by the Compton camera. ET is the true incident energy of the gamma. The resolutions are shown for three incident gamma energies and two detector materials as indicated in the legend.
The effects of detector lateral, depth, and energy resolutions
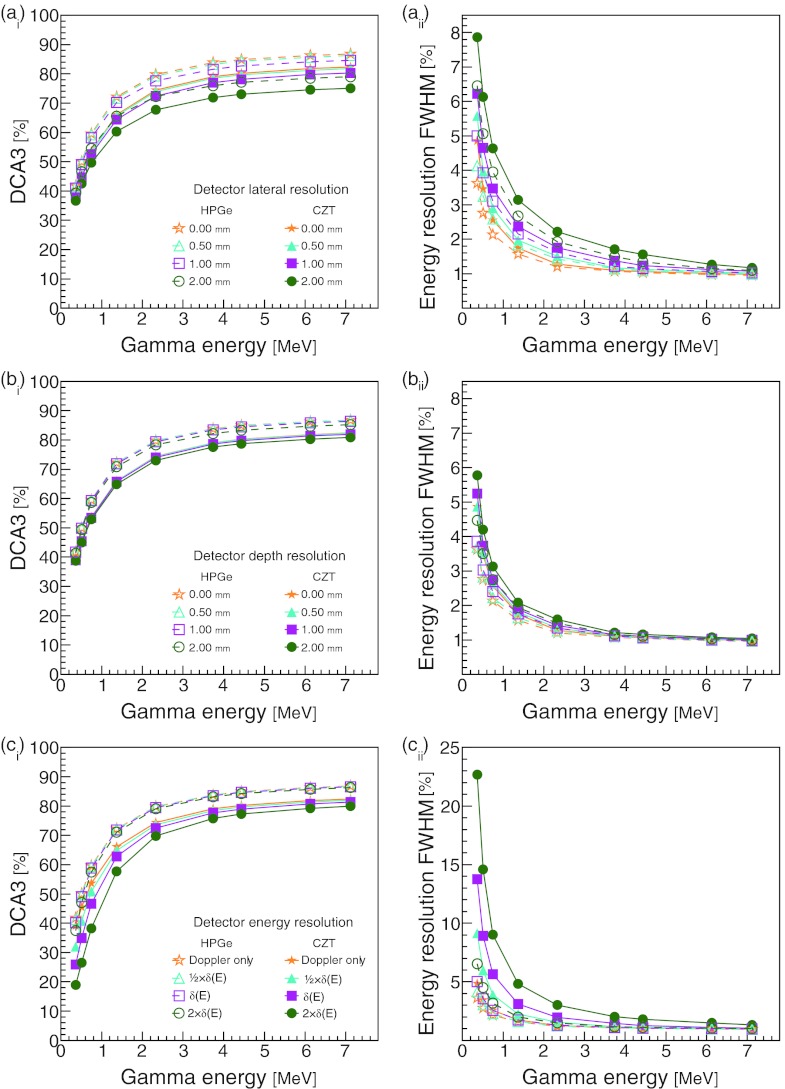
Figure 5 shows the impact of the detector's lateral, depth, and energy resolutions on the DCA3 percentages and the resolution of the CC calculated energy. The effects of the lateral resolution on the DCA3 percentages, shown in Fig. 5(ai), are enhanced for higher gamma energies due to the relatively smaller effects of Doppler broadening. For the calculated energy resolution, Eq. 6, shown in Fig. 5(aii), the effects of the lateral resolution decrease with increasing incident gamma energy. Figures 5(bi) and 5(bii) show that as long as the detector depth resolution is 2 mm or less, it will have little effect on either the DCA3 or the calculated energy resolution. The detector energy resolution's effects, shown in Figs. 5(ci) and 5(cii), are more pronounced for the CZT due to the material's lower intrinsic resolution [see Eqs. 3, 4]. For CZT, when s = 1 [Eq. 5], the detector resolution δ(E) reduces the DCA3 percentage for 0.511 MeV gammas from 45% to 35%. The effect of δ(E) is less pronounced at higher energies. For example, for 6.13 MeV gammas, it only reduces the DCA3 percentage by 1.2% versus Doppler broadening alone. The detector energy resolution δ(E) has the largest impact on the incident energy calculated with the CC [Fig. 5(cii)]. Again, the effect is much smaller at higher incident gamma energies. For incident gamma energies less than 2 MeV, the resolution is 1%–4%.
Figure 5.
The effect of detector (ai) lateral resolution, (bi) depth resolution, and (ai) energy resolution on the percentage of detected gammas with DCA < 3 mm. Also shown is the effect of detector (aii) lateral resolution, (bii) depth resolution, and (cii) energy resolution on the calculated incident energy resolution. All DCA and energy resolution calculations include the effects of Doppler broadening. The detector energy resolutions δ(E) were calculated from the energy resolution formula for the corresponding material, δHPGe(E) and δCZT(E) for HPGe and CZT, respectively.
The detector effects in combination
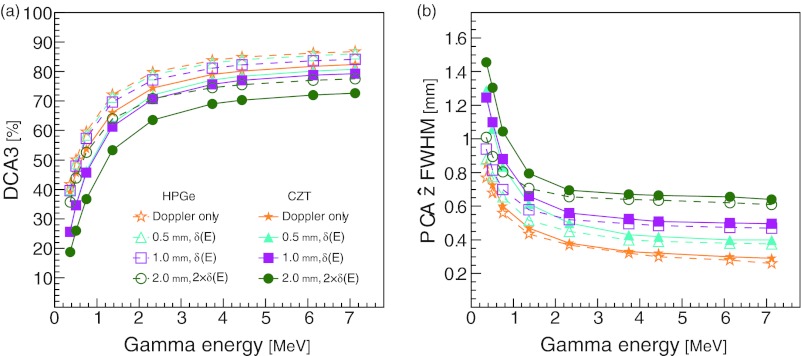
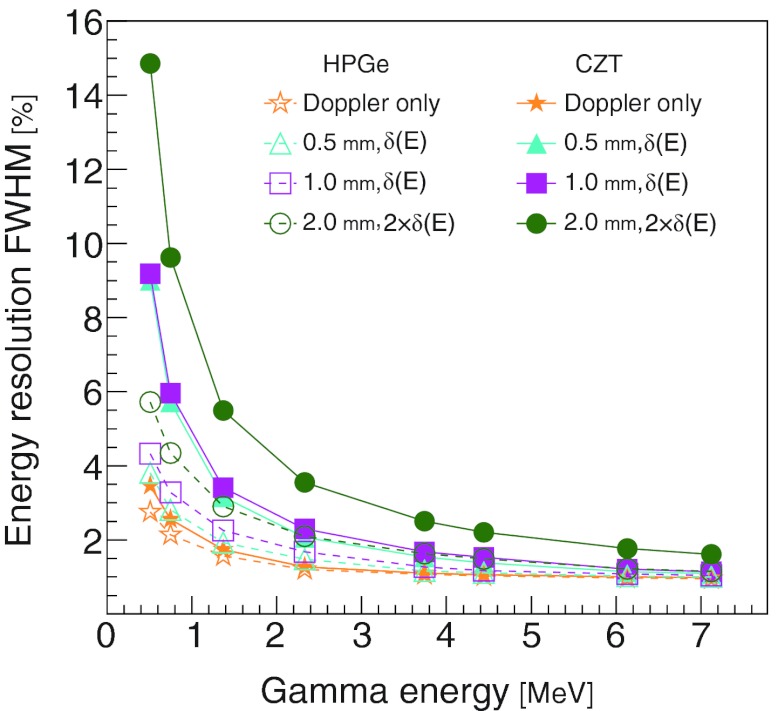
We next looked at the DCA3 and the FWHM of the PCA for gamma point sources when the detector effects were simulated in combination. Figure 6a shows that the HPGe curves have consistently greater DCA3 percentages than the CZT curves. The DCA3 percentage depends more on the material than on the detector effects. On the contrary, the FWHM of the PCA in the direction shows little difference between the HPGe and CZT curves [Fig. 6b]. The calculated energy resolution, FWHM of the ESF [Eq. 6], for the HPGe and the CZT CCs is shown in Fig. 7.
Figure 6.
The combined effects of Doppler broadening, detector spatial resolution, and detector energy resolution on the (a) DCA3 and the (b) FWHM of the PCA in the direction for point sources at the origin. For each curve, the lateral and depth resolutions were simulated as indicated in the legend. The detector energy resolutions δ(E) were calculated from the energy resolution formula for the corresponding material, δHPGe(E) and δCZT(E) for HPGe and CZT, respectively.
Figure 7.
The combined effects of Doppler broadening, detector spatial resolution, and detector energy resolution on the CC energy resolution. For each curve, the lateral and depth resolutions were simulated as indicated in the legend. The detector energy resolutions δ(E) were calculated from the energy resolution formula for the corresponding material, δHPGe(E) and δCZT(E) for HPGe and CZT, respectively.
The detector effects for proton pencil beam irradiation
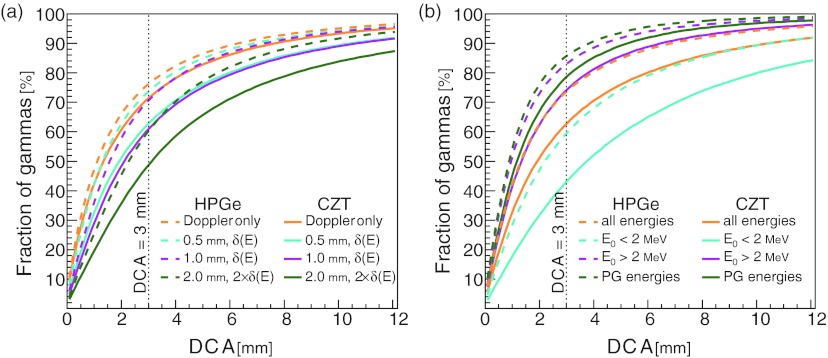
Our simulation of a proton pencil beam irradiating a tissue target produced a broad spectrum of gamma radiation and included radiation which scattered in the tissue prior to reaching the detector. Figure 8a shows the cumulative DCA values for four different detector resolutions. For the baseline HPGe and CZT detectors, the DCA3 percentages are 75% and 68%, respectively. When incident gamma energies were restricted to less than 2 MeV, the DCA3 percentages for the baseline detectors fell to 61% and 52% for HPGe and CZT, respectively [Fig. 8b]. Reversing the energy restriction to require incident gamma energies greater than 2 MeV increased those DCA3 percentages to 83% and 77%, respectively. Further restricting incident gamma energies within ±0.1 MeV of a known PG emission line increased those DCA3 percentages even more, to 86% and 81%, respectively [Fig. 8b]. These results indicate that requiring gammas to have incident energies greater than 2 MeV appreciably increases the DCA3. However, further restricting the incident gamma energies to known PG energies yields only a modest improvement to the DCA3.
Figure 8.
The combined effects of Doppler broadening, detector spatial resolution, and detector energy resolution on the cumulative distribution of gamma DCA values for a simulated CC detecting secondary gamma radiation during proton therapy. (a) The effects for several detector material and resolution combinations. (b) The difference in the distributions for high energy, >2.0 MeV, and low energy, < 2.0 MeV, incident gammas using a CC with 0.5 mm spatial resolution and δ(E) scaled to 1. The distributions of all detected gammas and only gammas within ±0.1 MeV of a known PG energy are shown as well. The detector energy resolutions δ(E) were calculated from the energy resolution formula for the corresponding material, δHPGe(E) and δCZT(E) for HPGe and CZT, respectively.
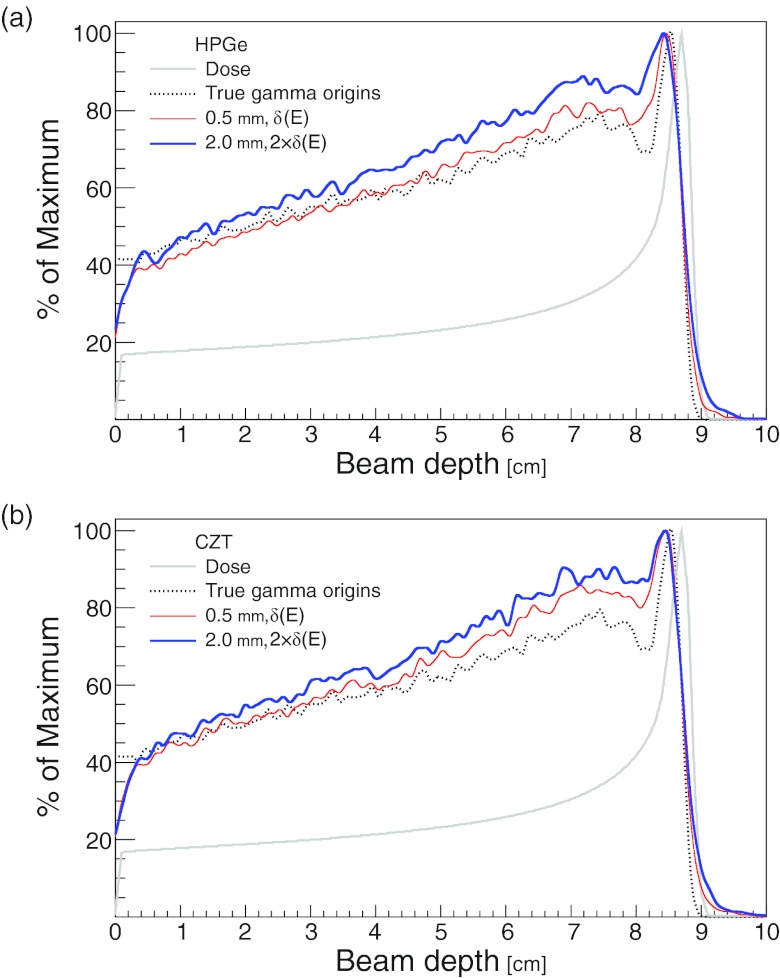
Figure 9 shows the distribution of PCA coordinate along the beam central axis. These distributions were created from detected gammas with PCA and coordinate absolute values less than 10 mm, and incident gamma energies greater than 2 MeV. The detector effects reduce the relative height of the peak in the gamma origins distributions, and this reduction in height is greater for the CC with lower resolution [2 mm, 2 × δ(E)]. Also, the curves for the HPGe detector [Fig. 9a] have better agreement with the true gamma distributions than do the corresponding curves for CZT [Fig. 9b]. However, even with the detector effects included, the curves for both detector materials have good agreement with the true gamma origins distribution at the distal edge.
Figure 9.
The detected gamma PCA distribution along the proton beam central axis for (a) HPGe and (b) CZT CCs. For each curve, the lateral and depth resolutions were set to the indicated value. The detector energy resolutions δ(E) were calculated from the energy resolution formula for the corresponding material, δHPGe(E) and δCZT(E) for HPGe and CZT, respectively. Gammas were required to have incident energy > 2 MeV, and the PCA and coordinates were required to be within 10 mm of the beam central axis. For reference purposes, the true gamma origins and the dose depth curve, calculated by the Monte Carlo, are shown as well.
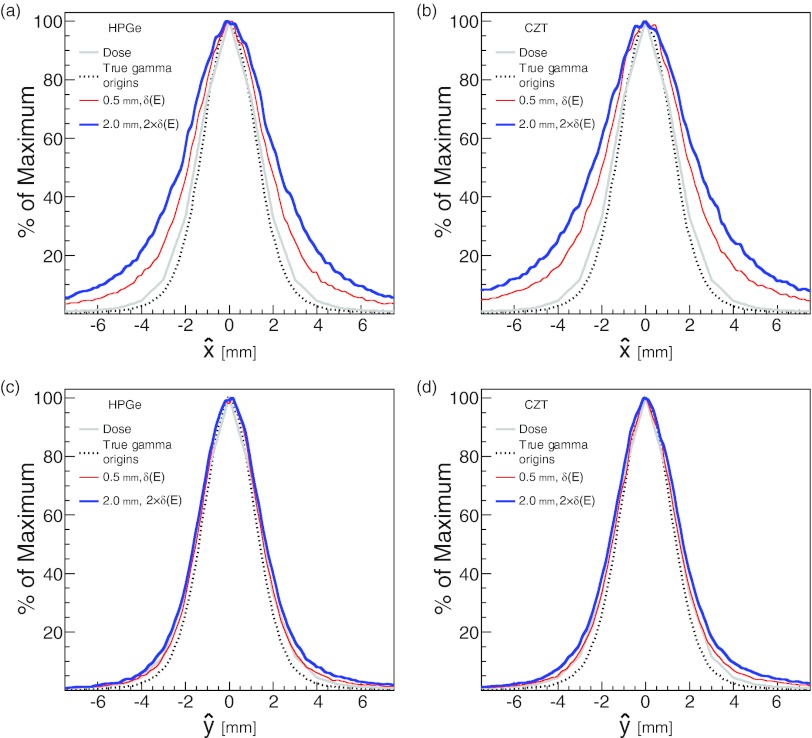
The beam cross sections in the and directions are shown in Fig. 10. The images compare the PCA values for two detector configurations to the true gamma origins and the dose. Figures 10a, 10c show that the detector effects are larger for , which is parallel to the CC detector stages, than for , which is perpendicular to the detector stages.
Figure 10.
Projection images in the (a) and (b) and (c) and (d) directions of the PCA gamma origin distributions for a proton pencil beam. The distributions are shown for both (a) and (c) HPGe and (b) and (d) CZT detectors. For each curve, the detector lateral and depth resolutions were set to the indicated value. The detector energy resolutions δ(E) were calculated from the energy resolution formula for the corresponding material, δHPGe(E) and δCZT(E) for HPGe and CZT, respectively. For reference purposes, the true gamma origins and the dose, calculated by the Monte Carlo, are shown as well.
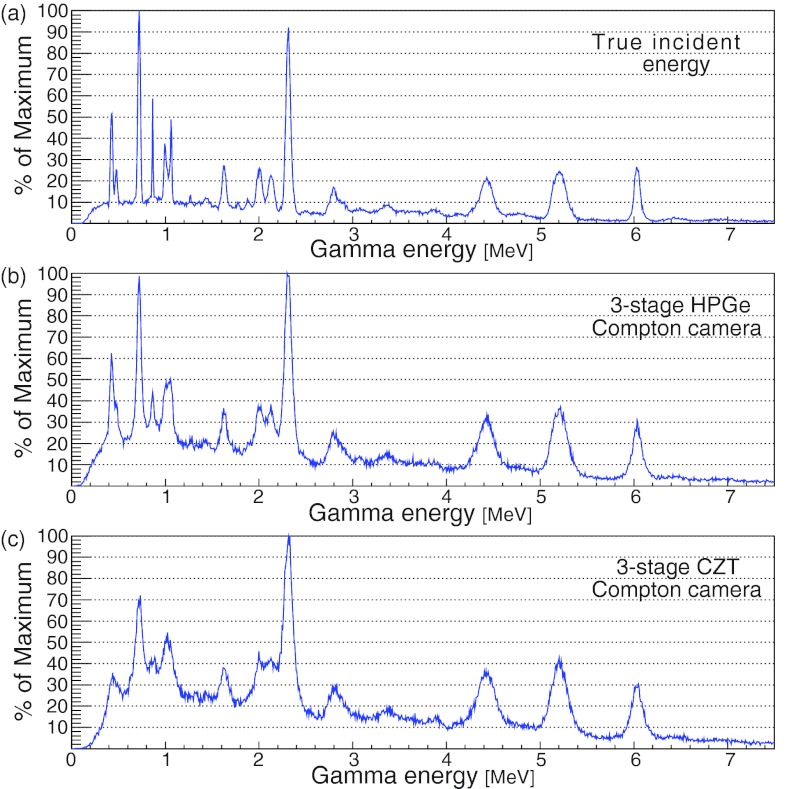
The true incident gamma energy spectrum and the calculated spectrums, which include the effects of Doppler broadening and the detector spatial and energy resolutions, are shown in Figs. 11a, 11b, 11c. The energy peaks at 2.33, 4.44, and 6.13 MeV correspond to PG emissions from 14N, 12C, and 16O, respectively. The peak at 5.20 MeV is due to a mixture of PG emissions from 16O, 15O, 15N, and 14N.35 The peaks from the CZT CC are noticeably wider than those from the HPGe CC. However, all of the major peaks from the true spectrum can be identified in the spectra from both the CZT and the HPGe CCs. The results indicate that both CCs have sufficient energy resolution for spectroscopic studies.
Figure 11.
The incident gamma spectrum (a) without detector effects, (b) with detector effects from a three-stage HPGe CC, and (c) with detector effects from a three-stage CZT CC. The detector energy resolutions δ(E) were calculated from the energy resolution formula for the corresponding material, δHPGe(E) and δCZT(E) for HPGe and CZT, respectively. Both CCs were simulated with lateral and depth resolutions of 0.5 mm.
DISCUSSION AND CONCLUSIONS
We have investigated how the characteristics of the detectors used for the three CC stages affect the ability of the CC to accurately measure the emission distribution and energy spectrum of gammas emitted during proton therapy. We found that compared with the other characteristics, Doppler broadening has a greater impact on both the spatial and energy resolution of the CC for all energies and for both HPGe and CZT. The effects from detector energy resolution were most pronounced for incident gamma energies below ∼2 MeV, whereas the effects from detector lateral resolution were most pronounced for incident gamma energies above ∼2 MeV. The effects of CC depth resolutions for values up to 2 mm were not pronounced at any incident gamma energy studied. Overall, the spatial resolution as measured by the FWHM of the PCA in the direction is less than 0.6 mm for the baseline HPGe and CZT CC configurations, which is substantially smaller than the 3 mm resolution target for PG imaging during proton therapy. The energy resolutions for both the HPGe and CZT baseline CCs are less than 5% for incident gammas with energies above 2 MeV, and we found this resolution adequate for identifying major peaks in the incident gamma energy spectrum. As shown by Polf et al.3, 4 the PG spectrum emitted during proton therapy may be clinically useful as means of studying the elemental composition of the irradiated tissue.
Though conceptually similar, DCA3 and PCA answer different questions. In our study, the effects of detector energy and spatial resolution tended to be either small or quite large. Thus, the corresponding DCA distributions are sharply peaked near 0 with a wide tail. The DCA3 takes the large tail into account because it is a percentage of the entire distribution. On the contrary, the FWHM of the PCA for a single dimension, , for example, measures only the width of the peak and does not consider the size of the distribution tails. For CC image reconstruction, we expect that both the size of the tails and the width of the peak are important. The size of the tails corresponds to the fraction of the detected gammas that will not be useful for image reconstruction. The width of the peak estimates the obtainable image resolution. Therefore, the DCA3 can be thought of as a gamma detection efficiency measure, while FWHM of a PCA dimension is a measure of image resolution.
The difference between these two FOMs was evident when comparing the detector effects for HPGe and CZT. When considering DCA3, the detector material was more important than the detector resolution, and HPGe was the evidently superior material. However, when considering the PCA lateral FWHM, the detector resolution was more important than the detector material, and the advantage of HPGe over CZT was only ∼0.1 mm for gamma incident energies greater than 2.0 MeV.
In our simulations, three-stage HPGe CCs consistently outperformed three-stage CZT CCs due to lower levels of Doppler broadening and to HPGe CCs’ intrinsically better energy resolution. However, for practical clinical applications of proton beam range verification and PG spectroscopy, the advantages of HPGe over CZT are not as clear. Practical concerns such as cost, size, and operating temperature may be more important than the detector effects are when choosing materials for a three-stage CC intended for clinical use in a proton radiotherapy treatment vault.
For the two detector materials considered in this study, our results indicate that Doppler broadening in the detector reduces the CC's energy resolution, even at the largest incident gamma energies. Therefore, since low atomic number detector materials, for example, silicon, have less intrinsic Doppler broadening, these materials may provide better spatial and energy resolution. However, we have shown that Doppler broadening's effect is mainly to decrease the percentage of detected gammas that are useful for reconstruction (DCA < 3 mm). Therefore, the reduced Doppler broadening of lower atomic number materials should cause an effective increase in the detection efficiency. This increase in efficiency, however, would be offset to some degree by the decrease in efficiency due to the smaller Compton scattering cross sections in lower Z materials.
The distance from the gamma source to the first detector stage and the distances between the CC stages were fixed in our study. The values of our DCA, PCA, and calculated energy resolutions are specific to this simulated geometry. Increasing the distance between the CC detector stages will improve the CC performance as measured by these FOMs but will also reduce the gamma detection efficiency of the CC. Reducing the distance between the gamma source and the CC's first stage is another way to increase the CC performance as measured by these FOMs, and the reduction in distance from the source will also increase the detection efficiency. However, it is unlikely that a CC can be positioned less than 10 cm, the distance used in our studies, from a patient during a proton therapy treatment.
In summary, from our investigation of the detector effects on the performance of three-stage CCs, we found the following: (1) Doppler broadening is the dominant source of spatial and energy resolution loss in the CCs at all energy levels; (2) the largest difference in the spatial resolution of HPGe and CZT CCs is that the spatial resolution distributions of CZT have much broader tails. The differences in the FWHM of these distributions are small; (3) the energy resolution of both HPGe and CZT three-stage CCs is adequate for PG spectroscopy; and (4) restricting the gammas used for creating images to those having energy greater than 2.0 MeV can improve the achievable resolution for CC imaging of PG.
ACKNOWLEDGMENTS
This work was supported by the National Institutes of Health (NIH) through Award No. R21CA137362 from the National Cancer Institute and a grant from the Department of Health and Human Services (D1ARH20090).
References
- Min C. H., Kim C. H., Youn M. Y., and Kim J. W., “Prompt gamma measurements for locating the dose falloff region in the proton therapy,” Appl. Phys. Lett. 89, 183517 (2006). 10.1063/1.2378561 [DOI] [Google Scholar]
- Moteabbed M., Espana S., and Paganetti H., “Monte Carlo patient study on the comparison of prompt gamma and PET imaging for range verification in proton therapy,” Phys. Med. Biol. 56, 1063–1082 (2011). 10.1088/0031-9155/56/4/012 [DOI] [PubMed] [Google Scholar]
- Polf J., Peterson S., Ciangaru G., Gillin M., and Beddar S., “Prompt gamma-ray emission from biological tissues during proton irradiation: A preliminary study,” Phys. Med. Biol. 54, 731–743 (2009). 10.1088/0031-9155/54/3/017 [DOI] [PubMed] [Google Scholar]
- Polf J., Peterson S., McCleskey M., Roeder B., Spiridon A., Beddar S., and Trache L., “Measurement and calculation of characteristic prompt gamma ray spectra emitted during proton irradiation,” Phys. Med. Biol. 54, N519–N527 (2009). 10.1088/0031-9155/54/22/N02 [DOI] [PubMed] [Google Scholar]
- Todd R., Nightingale J., and Everett D., “A proposed gamma camera,” Nature (London) 251, 132–134 (1974). 10.1038/251132a0 [DOI] [Google Scholar]
- Singh M., “An electronically collimated gamma camera for single photon emission computed tomography. Part I: Theoretical considerations and design criteria,” Med. Phys. 10, 421–427 (1983). 10.1118/1.595313 [DOI] [PubMed] [Google Scholar]
- Ordonez C. E., Bolozdynya A., and Wei C., “Dependence of angular uncertainties on the energy resolution of Compton cameras,” in Proceedings of the IEEE Nuclear Science Symposium, IEEE November 9–15, 1997, Albuquerque, New Mexico, (IEEE, Washington, DC, 1997), Vol. 2, pp. 1122–1125.
- Ordonez C. E., Wei C., and Bolozdynya A., “Angular uncertainties due to geometry and spatial resolution in Compton cameras,” in Proceedings of the IEEE Nuclear Science Symposium Conference Record, IEEE 1998 - November 8–14, 1998, Toronto, Ontario, Canada (IEEE, Washington, DC, 1998), Vol. 3, pp. 1535–1540.
- Ordonez C. E., Bolozdynya A., and Chang W., “Doppler broadening of energy spectra in Compton cameras,” in Proceedings of the IEEE Nuclear Science Symposium, IEEE November 9–15, 1997, Albuquerque, New Mexico (IEEE, 1997), Vol. 2, pp. 1361–1365.
- Wilderman S. J., Rogers W., Knoll G. F., and Engdahl J. C., “Monte Carlo calculation of point-spread functions of Compton scatter cameras,” IEEE Trans. Nucl. Sci. 44, 250–254 (1997). 10.1109/23.568817 [DOI] [Google Scholar]
- Mundy D. W. and Herman M. G., “Uncertainty analysis of a Compton camera imaging system for radiation therapy dose reconstruction,” Med. Phys. 37, 2341–2350 (2010). 10.1118/1.3399777 [DOI] [PubMed] [Google Scholar]
- Kormoll T., Fiedler F., Schone S., Wustemann J., Zuber K., and Enghardt W., “A Compton imager for in-vivo dosimetry of proton beams–A design study,” Nucl. Instrum. Methods Phys. Res. A 626–627, 114–119 (2010). 10.1016/j.nima.2010.10.031 [DOI] [Google Scholar]
- Kroeger R., Johnson W., Kurfess J., Phlips B., and Wulf E., “Three-Compton telescope: Theory, simulations, and performance,”IEEE Trans. Nucl. Sci. 49, 1887–1892 (2002). 10.1109/TNS.2002.801539 [DOI] [Google Scholar]
- Agostinelli S., Allison J., Amako K., Apostolakis J., Araujo H., Arce P., and Barrand G., “Geant4-A simulation toolkit,” Nucl. Instrum. Methods Phys. Res. A 506, 250–303 (2003). 10.1016/S0168-9002(03)01368-8 [DOI] [Google Scholar]
- Peterson S., Robertson D., and Polf J., “Optimizing a three-stage Compton camera for measuring prompt gamma rays emitted during proton radiotherapy,” Phys. Med. Biol. 55, 6841–6856 (2010). 10.1088/0031-9155/55/22/015 [DOI] [PMC free article] [PubMed] [Google Scholar]
- Robertson D., Polf J. C., Peterson S. W., Gillin M. T., and Beddar S., “Material efficiency studies for a Compton camera designed to measure characteristic prompt gamma rays emitted during proton beam radiotherapy,” Phys. Med. Biol. 56, 3047–3059 (2011). 10.1088/0031-9155/56/10/010 [DOI] [PMC free article] [PubMed] [Google Scholar]
- Mackin D., Peterson S., Beddar S., and Polf J., “Evaluation of a stochastic reconstruction algorithm for use in Compton camera imaging and beam range verification from secondary gamma emission during proton therapy,” Phys. Med. Biol. 57, 3537–3553 (2012). 10.1088/0031-9155/57/11/3537 [DOI] [PMC free article] [PubMed] [Google Scholar]
- Poon E. and Verhaegen F., “Accuracy of the photon and electron physics in GEANT4 for radiotherapy applications,” Med. Phys. 32, 1696 (2005). 10.1118/1.1895796 [DOI] [PubMed] [Google Scholar]
- Longo F., Pandola L., and Pia M. G., “New Geant4 developments for doppler broadening simulation in Compton scattering,” in Proceedings of the Nuclear Science Symposium Conference Record, 19–25 October 2008, Dresden, Germany (IEEE, Washington DC, 2008), Vol. N41-N42, pp. 2865–2868.
- Cirrone G., Cuttone G., Di Rosa F., Pandola L., Romano F., and Zhang Q., “Validation of the Geant4 electromagnetic photon cross-sections for elements and compounds,” Nucl. Instrum. Methods Phys. Res. A 618, 315–322 (2010). 10.1016/j.nima.2010.02.112 [DOI] [Google Scholar]
- Cullen D. E., Hubbell J. H., and Kissel L., “EPDL97: The evaluated photon data library, ’97 version,” Report No. UCRL-50400 (Lawrence Livermore National Laboratory, Livermore, CA, 1997), Vol. 6.
- Del Sordo S., Abbene L., Caroli E., Mancini A. M., Zappettini A., and Ubertini P., “Progress in the development of CdTe and CdZnTe semiconductor radiation detectors for astrophysical and medical applications,” Sensors 9, 3491–3526 (2009). 10.3390/s90503491 [DOI] [PMC free article] [PubMed] [Google Scholar]
- Vetter K., Burks M., Cork C., Cunningham M., Chivers D., Hull E., and Nelson K., “High-sensitivity Compton imaging with position-sensitive Si and Ge detectors,” Nucl. Instrum. Methods Phys. Res. A 579, 363–366 (2007). 10.1016/j.nima.2007.04.076 [DOI] [Google Scholar]
- Alnaaimi M., Royle G., Ghoggali W., Banoqitah E., Cullum I., and Speller R., “Performance evaluation of a pixellated Ge Compton camera,” Phys. Med. Biol. 56, 3473–3486 (2011). 10.1088/0031-9155/56/12/002 [DOI] [PubMed] [Google Scholar]
- Zhang F., He Z., and Seifert C. E., “A prototype three-dimensional position sensitive CdZnTe detector array,”IEEE Trans. Nucl. Sci. 54, 843–848 (2007). 10.1109/TNS.2007.902354 [DOI] [Google Scholar]
- Barthelmy S., Barbier L., Cummings J., Fenimore E., Gehrels N., Hullinger D., and Tueller J., “The Burst Alert Telescope (BAT) on the SWIFT Midex Mission,” Space Sci. Rev. 120, 143–164 (2005). 10.1007/s11214-005-5096-3 [DOI] [Google Scholar]
- Owens A., “Spectral degradation effects in an 86 cm3 Ge (HP) detector,” Nucl. Instrum. Methods Phys. Res. A 238, 473–478 (1985). 10.1016/0168-9002(85)90487-5 [DOI] [Google Scholar]
- Du Y., He Z., Knoll G. F., Wehe D. K., and Li W., “Evaluation of a Compton scattering camera using 3-D position sensitive CdZnTe detectors,” Nucl. Instrum. Methods Phys. Res. A 457, 203–211 (2001). 10.1016/S0168-9002(00)00669-0 [DOI] [Google Scholar]
- Leo W. R., Techniques for Nuclear and Particle Physics Experiments: A How-to Approach (Springer-Verlag, New York, 1994). [Google Scholar]
- Ghoggali W., Speller R. D., Royle G. J., Gabathuse J., Sellin P. J., Lazarus I. H., and Appelbe D. E., “Detector characteristics of a pixellated germanium Compton camera for nuclear medicine,” in Proceedings of the Nuclear Science Symposium Conference Record, 16–22 October 2004, Rome, Italy (IEEE, Washington DC, 2004), Vol. 4, pp. 2216–2220.
- Zhang F., He Z., Knoll G. F., Wehe D. K., and Berry J. E., “3-D position sensitive CdZnTe spectrometer performance using third generation VAS/TAT readout electronics,” IEEE Trans. Nucl. Sci. 52, 2009–2016 (2005). 10.1109/TNS.2005.856821 [DOI] [Google Scholar]
- Zhu Y., Anderson S. E., and He Z., “Sub-pixel position sensing for pixelated, 3-D position sensitive, wide band-gap, semiconductor, gamma-ray detectors,” IEEE Trans. Nucl. Sci. 58, 1400–1409 (2011). 10.1109/TNS.2011.2132738 [DOI] [Google Scholar]
- International Commission in Radiation Units and Measurements, “Stopping power and ranges for protons and alpha particles,” ICRU Report No. 49 (ICRU Publications, Bethesda, MD, 1993).
- Thomas S. J., “Margins for treatment planning of proton therapy,” Phys. Med. Biol. 51, 1491–1501 (2006). 10.1088/0031-9155/51/6/009 [DOI] [PubMed] [Google Scholar]
- Kozlovsky B., Murphy R. J., and Ramaty R., “Nuclear deexcitation gamma-ray lines from accelerated particle interactions,” Astrophys. J., Suppl. Ser. 141, 523–541 (2002). 10.1086/340545 [DOI] [Google Scholar]


