Abstract
Purpose: This study describes a HighlY constrained backPRojection (HYPR) image processing method for the reduction of image noise in low tube current time-resolved CT myocardial perfusion scans. The effect of this method on myocardial time-attenuation curve noise and fidelity is evaluated in an animal model, using varying levels of tube current.
Methods: CT perfusion scans of four healthy pigs (42–59 kg) were acquired at 500, 250, 100, 50, 25, and 10 mA on a 64-slice scanner (4 cm axial coverage, 120 kV, 0.4 s/rotation, 50 s scan duration). For each scan a sequence of ECG-gated images centered on 75% R-R was reconstructed using short-scan filtered back projection (FBP). HYPR processing was applied to the scans acquired at less than 500 mA using parameters designed to maintain the voxel noise level in the 500-mA FBP images. The processing method generates a series of composite images by averaging over a sliding time window and then multiplies the composite images by weighting images to restore temporal fidelity to the image sequence. HYPR voxel noise relative to FBP noise was measured in AHA myocardial segment numbers 1, 5, 6, and 7 at each mA. To quantify the agreement between HYPR and FBP time-attenuation curves (TACs), Bland-Altman analysis was performed on TACs measured in full myocardial segments. The relative degree of TAC fluctuation in smaller subvolumes was quantified by calculating the root mean square deviation of a TAC about the gamma variate curve fit to the TAC data.
Results: HYPR image sequences were produced using 2, 7, and 20 beat composite windows for the 250, 100, and 50 mA scans, respectively. At 25 and 10 mA, all available beats were used in the composite (41–60; average 50). A 7-voxel-wide 3D cubic filter kernel was used to form weighting images. The average ratio of HYPR voxel noise to 500-mA FBP voxel noise was 1.06, 1.10, 0.97, 1.11, and 2.15 for HYPR scans at 250, 100, 50, 25, and 10 mA. The average limits-of-agreement between HYPR and FBP TAC values measured 0.02+/−0.91, 0.04+/−1.92, 0.19+/−1.59, 1.13+/−4.22, and 1.07+/−6.37 HU (mean difference +/−1.96 SD). The HYPR image subvolume that yielded a fixed level of TAC fluctuations was smaller, on average, than the FBP subvolume determined at the same mA.
Conclusions: HYPR processing is a feasible method for generating low noise myocardial perfusion data from a low-mA time-resolved CT myocardial perfusion scan. The method is applicable to current clinical scanners and uses conventional image reconstructions as input data.
Keywords: CT, myocardial perfusion, noise reduction
INTRODUCTION
Coronary CT angiography (CCTA) using multidetector CT (MDCT) technology has been shown to detect significant stenoses with excellent sensitivity and high negative predictive value.1, 2 Due to this ability to reliably rule out coronary artery disease based on the absence of stenoses, CCTA has emerged as a valuable tool for the noninvasive evaluation of certain patients with low-to-intermediate probability of occlusive coronary artery disease (CAD).3 However, unlike other noninvasive cardiac imaging modalities such as SPECT, MRI, or PET, CCTA does not provide direct information on myocardial perfusion. This information provides a measure of the functional significance of a stenosis and plays a major role in the diagnostic workup of CAD.4
Recent studies have explored the feasibility of MDCT-based myocardial perfusion imaging (CT-MPI) using a variety of scanning strategies. In static methods, a single CT scan is acquired during myocardial contrast enhancement, and the image is examined for regional reductions in attenuation which are indicative of a perfusion defect.5, 6, 7, 8, 9, 10 A variation of this method uses dual-energy CT and material decomposition to image the iodine distribution throughout the myocardium.11, 12, 13, 14 Alternatively, in dynamic methods, the heart is repeatedly imaged as iodinated contrast washes in and out of the myocardium, and, as with cerebral CT perfusion imaging, blood flow is derived from measured time-attenuation curves.14, 15, 16, 17, 18, 19
While dynamic CT-MPI carries the potential advantage of providing quantitative flow measurements, it may also carry a larger radiation burden due to the extended imaging time. Recent studies of dynamic CT-MPI in humans using second generation dual-source CT have used 30 s scan times and reported 9.09–10.0 mSv average effective dose per scan.17, 18, 19 In a stress and rest protocol,17 two scans are performed and the dose is doubled. The doses associated with CT-MPI are likely to evolve over time as different scanning protocols are investigated. Nonetheless, dose reduction techniques would be helpful.
In this paper we present a technique for reducing dose in dynamic CT-MPI based on HighlY constrained backPRojection (HYPR) image processing. HYPR is an approach to serial imaging originally developed for MRI and later applied to CT which exploits correlations in anatomic positions from one image to the next to enable reconstruction from undersampled projection data or increase signal-to-noise ratio in noisy image data.20, 21 The technique has been investigated for dose reduction in dynamic CT applications using either undersampled projection acquisition22, 23 or low tube current scanning.23, 24 Previous work on HYPR CT-MPI explored interleaved view undersampling as the dose reduction mechanism.22 In this feasibility study we describe a low-mA fully sampled HYPR technique for CT-MPI and evaluate its ability to provide accurate, low noise time-attenuation curves in an animal model. The method operates on conventionally reconstructed images and requires no modifications to the scanner.
METHODS
Low-mA ECG-gated HYPR-LR technique
The image reconstruction technique is designed to operate on a series of prospectively ECG-gated short-scans of a fixed cardiac volume, acquired with low tube current (e.g., 50 mA) and continuous gantry rotation as injected contrast agent flows through the myocardium. The scan period corresponding to a cardiac cycle is referred to as a time frame. Initially each time frame is reconstructed using conventional filtered back projection (FBP). Then, to reduce the noise in these relatively noisy images, HYPR processing is applied. Each HYPR time frame is of the form21
| (1) |
where IC is a time-averaged composite image and IW is a weighting image which represents the ratio of the estimated image values at the specific time point ti relative to the composite image values. The composite for time ti is an average of N FBP images centered on ti:
| (2) |
For images I(r,t) of approximately constant intensity, the stochastic noise in the composite goes as σI/√N. Under the ideal condition of no object motion from one time point to the next, the composite image carries the spatial resolution of the underlying images I(r,t).
The weighting image is formed by the HYPR-LR technique,21 in which the conventional time frame I(r,ti) is convolved with a kernel F(r), and the result is divided by the composite image convolved with the same kernel:
| (3) |
The convolution of the noisy image I(r,ti) with the kernel F provides an estimate of the true image values at time ti, with reduced spatial resolution but increased SNR. Normalizing this by the equivalently filtered composite image produces a reduced-resolution map of ratios which serve to modify the intensities of the low-noise composite image.
The size of the filtering kernel F and the length of the composite averaging window N are adjustable parameters. Nominally, N is set to the tube current reduction factor if the goal is to match the noise level of a higher-mA conventional scan. However, N may need to be increased further to offset noise introduced by the weighting image, or if lowering the tube current results in a reduction in detective quantum efficiency due to low x-ray signal relative to electronic noise. In general, increasing filter kernel size will decrease weighting image noise and lower the required N value. Conversely, reducing filter kernel size will improve the spatial resolution of the weighting image at the cost of an increase in the weight image noise. The selection of filter kernel size is described in Sec. 2D.
HYPR has been investigated using mask-subtracted data,22, 23 in which an average of precontrast time frames is subtracted from all subsequent time frames. We note this approach has several practical limitations when applied to myocardial perfusion imaging. Most importantly, to ensure mask registration a subject would need to perform a very long and consistent breath hold (e.g., 50 s) from the time before contrast arrival in the right heart (mask phase) until after contrast departure from the left heart (end of perfusion phase). The use of mask subtraction also places an upper limit on the SNR improvement that can be achieved since mask noise is not reduced by the composite time-averaging procedure. Last, a mask scan represents additional x-ray dose. For these reasons we implemented Eqs. 1, 2, 3 without mask subtraction. Division by zero in Eq. 3 was avoided by adding a constant offset (2000 HU) to all time frames before HYPR processing and then subtracting the offset from the result.
Animal study
The performance of the low-mA ECG-gated HYPR-LR method was evaluated in a study of four healthy Yorkshire pigs (42–59 kg.). Each animal was mechanically ventilated with isoflurane anesthesia and oxygen. A sheath was placed in the femoral vein to provide vascular access for iodinated contrast injections. In three animals the contrast was injected through an 8Fr pigtail catheter guided through the sheath and positioned in the inferior vena cava just below the apex of the heart; in the other animal contrast was injected directly into the femoral vein sheath. ECG, oxygen saturation (SPO2), end tidal CO2, and arterial blood pressure were continuously monitored. Heart rate was lowered and maintained in the range 50–70 bpm with periodic injections of zatebradine (5–10 mg IV bolus).
Each animal was scanned on a 64-slice CT scanner (Discovery VCT, GE Healthcare, Waukesha, WI, USA) with 4-cm axial beam coverage and 0.625 mm slice thickness at isocenter. An initial contrast-enhanced cardiac helical CTA was performed to obtain an anatomic overview. Then the 4 cm thick imaging volume was centered at mid-ventricle and contrast-enhanced perfusion scans were performed at six different tube currents: 500, 50, 250, 25, 100, and 10 mA. An ECG-gated perfusion scanning mode was not available on this scanner. Instead a continuous nongated cine scan was performed and the gated perfusion scan was generated retrospectively using the recorded raw projection data and the simultaneously recorded ECG waveform.
Each cine scan was 50 s long and used 0.4 s gantry rotation time and 120 kVp tube voltage. Injection of iodixanol (320 mg/ml iodine) contrast at 10 ml/s commenced 3 s into scanning, followed by 85 ml saline chase. Scan duration was intentionally long to allow for measurement of precontrast attenuation as well as contrast recirculation. Iodixanol contrast volume (40–52 ml) was adjusted to body weight using a 0.881 ml/kg conversion. Pancuronium (2–3 mg) was administered to achieve effective paralysis prior to scanning, and ventilation was suspended at end expiration to ensure breath holding. At least 15 min was allowed to elapse between each perfusion scan.
Image reconstruction
The raw projection data from each cine scan was transferred off the scanner and preprocessed with the manufacturer's software. Sections of projection data corresponding to 180° plus fan angle (55°) short scans centered on 75% R-R of each cardiac cycle were then parsed out to obtain the raw projection data for the perfusion scan reconstruction. A conventional FBP image volume was reconstructed for each heart beat using 250 × 250 mm2 in-plane field-of-view, 512 × 512 image matrix (0.488 × 0.488 mm2 in-plane voxel dimensions), and 0.625 mm slice thicknesses.
In a series of ECG-gated short-scans acquired with continuous gantry rotation, the start angle of each short scan normally varies from beat to beat (the exception being cases of heart rate-gantry synchronization, either due to coincidence or pacing25). It has been shown that this type of scan is susceptible to partial scan artifact, i.e., small, spatially broad variations in image intensity correlated to short-scan angle which can impose periodic variations on time-attenuation curves measured in the myocardium.25, 26 To address this, the partial scan artifact reduction (PSAR) method introduced by Stenner et al.26 was applied. All FBP images analyzed in this study had PSAR correction applied, and the PSAR-corrected FBP images served as the input time frames I(r,t) for HYPR processing.
HYPR image parameters
The adjustable HYPR parameters, filter kernel size, and composite window size were chosen with the goal of matching low-mA HYPR voxel noise to that of the 500-mA FBP images of the same animal. The parameter selection strategy was to first determine the smallest filter kernel size that does not result in an appreciably higher noise level in the final HYPR image over that in the composite image and then, using this filter, select the composite window size to achieve the target noise level.
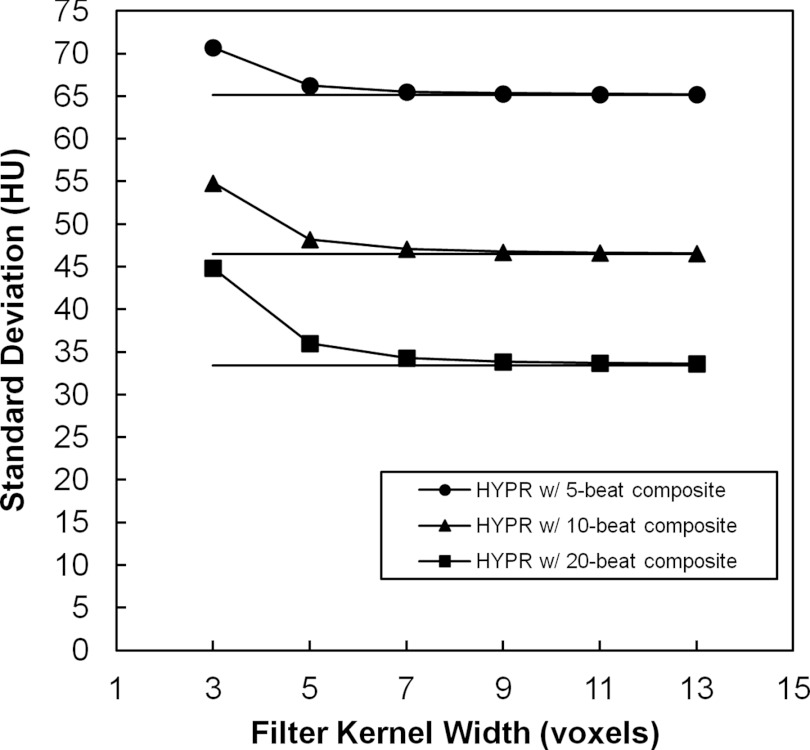
A preliminary investigation of image noise versus filter kernel size was carried out in Pig 1. HYPR sequences were produced at each mA level using 3–13 voxel-wide 3D cubic filtering kernels (constant valued) and composite windows of 5, 10, and 20 cardiac cycles (beats). Figure 1 demonstrates HYPR and composite image noise versus filter kernel width for a 100 mA scan and each composite window size. In this example the HYPR noise is 1%–3% greater than composite noise using the 7 voxel kernel. Across all mA levels and composite sizes, the maximum percent difference in HYPR noise over composite noise was 43%, 9%, 3%, 2%, 1%, and 1% for filter kernel widths of 3, 5, 7, 9, 11, and 13 voxels. Based on this investigation, a 7 voxel wide kernel (3.4 × 3.4 × 4.4 mm3) was selected for the HYPR images.
Figure 1.
Investigation of HYPR image voxel noise vs 3D cubic filter kernel width for 5, 10, and 20 beat composite windows (measurements shown are from the 100 mA scan of Pig 1). Solid horizontal lines indicate the noise level measured in the composite image.
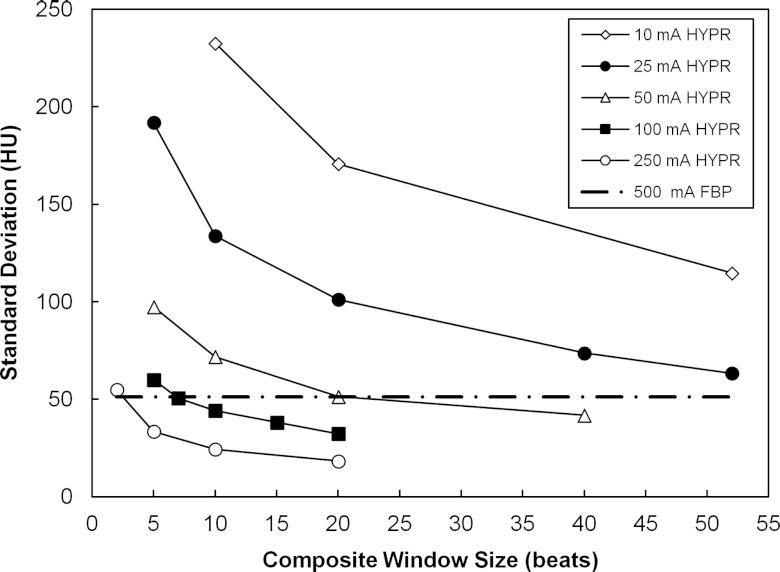
The selection of composite window size is demonstrated in Fig. 2. HYPR images were generated for window sizes ranging from 2 beats up to the maximum available beats, depending on tube current. At each tube current, linear interpolation or extrapolation of the measured noise versus composite window data was performed to estimate the composite size that would yield the targeted noise level in the HYPR images. In Fig. 2, the resulting composite sizes were 2, 7, 20, 61, and 96 beats for 250, 100, 50, 25, and 10 mA scans. This same procedure was applied in each animal. Table 1 lists the results. Based on this analysis, composite window sizes of 2, 7, and 20 beats were selected for tube currents of 250, 100, and 50 mA, respectively. At 25 and 10 mA, more than the maximum number of beats in the scan would have been required. In these cases, all available beats were used. There were on average 50 beats in a scan (range 41–60).
Figure 2.
HYPR image voxel noise vs composite window size and tube current using a 7 voxel wide filter kernel (Pig 1). The dashed horizontal line indicates the noise measured in the 500 mA FBP images.
Table 1.
Composite window sizes projected to achieve 500 mA FBP noise levels and selected values.
| Pig | 250 mA | 100 mA | 50 mA | 25 mA | 10 mA |
|---|---|---|---|---|---|
| 1 | 2 | 7 | 20 | 61 | 96 |
| 2 | 2 | 8 | 16 | 71 | 92 |
| 3 | 2 | 12 | — | 69 | 69 |
| 4 | 2 | 7 | 25 | 64 | 78 |
| Selected value | 2 | 7 | 20 | All1 | All1 |
All available time frame images were averaged to produce the composite.
Myocardial segmentation
Time-attenuation curves (TACs) were generated from an image series by averaging the voxel values within a specified volume-of-interest (VOI) for each cardiac cycle. Myocardial VOIs were defined according to the AHA 17-segment model. Since the perfusion scans covered only a 4-cm thick section of the heart, segmentation was first performed on the whole-heart CTA and then the planes defining the AHA segment boundaries were transferred to the perfusion scan volume. Manual trimming of the defined segments was performed as needed to ensure that they remained within the myocardium for all cardiac cycles in a perfusion scan. AHA segments which had only a small fraction represented within the perfusion imaging volume were excluded from analysis. Septal segments were also excluded due to the observed presence of streak artifacts arising from the contrast-enhanced right ventricle and vena cava in the early phase of the scan. The final AHA segments selected for analysis in all scans were segment numbers 1, 5, 6, and 7. Subvolumes of these segments were also analyzed, as described below.
Image noise and time-attenuation curve analysis
Voxel standard deviation was measured in each segment and cardiac cycle in a scan. The noise level for a particular animal, segment, and tube current was obtained by averaging results over all beats. To determine if the target noise level had been achieved, each noise level was divided by the 500-mA FBP noise level in the same segment and animal.
The accuracy of HYPR image values vs time was evaluated by comparing the HYPR myocardial TAC to the FBP TAC measured from the same scan. To minimize the influence of stochastic voxel noise in this comparison, the TACs were generated using the full AHA segments. The number of voxels averaged to produce a single value in a TAC ranged from 4365 to 30 639 (0.65–4.57 cm3), depending on segment and animal, and averaged 14 317 (2.13 cm3). Agreement between HYPR and FBP TACs was quantified by performing Bland-Altman analysis of the pairs of TAC values at each time point. The 95% limits of agreement were calculated as the mean difference in CT number +/−1.96 times the standard deviation in the differences. Additionally, to evaluate the accuracy of values in an arterial input curve, HYPR and FBP TACs measured in a cylindrical volume (14 763 voxels, 2.2 cm3) of the left ventricle were compared for each scan. Last, the stability of CT number versus tube current was evaluated by measuring the fat value in a posterior volume of interest (1.0 cm3), averaged over the first 5 beats of each scan.
The effect of reduced voxel noise in the low-mA HYPR images was determined from TACs extracted from smaller myocardial VOIs. Repeated 3D erosion was applied to the AHA segments, and after each stage of erosion, the TAC noise was calculated as the root-mean-square deviation (RMSD) of the TAC values about a gamma-variate fit to the TAC. The gamma-variate curve was of the form27, 28 γ(t) = Dmax(θa)exp[−a(θ−1)], t > tfoot, where tfoot is the time at which the curve rises from baseline, tmax is the time of maximum contrast, Dmax is the maximum contrast value, θ = (t−tfoot)/(tmax−tfoot), and a is the shape parameter. The parameters tfoot, tmax, Dmax, and a were obtained using a nonlinear least squares method. The gamma-variate function assumes a zero baseline and no iodine recirculation. Therefore, the TACs were prepared by subtracting a baseline value averaged over early cardiac cycles, and the data beyond the minimum in left ventricular signal following peak enhancement were excluded.
After characterizing the TAC noise versus VOI size for HYPR and FBP images from the same scan, the two methods were compared by calculating the TAC VOI sizes which yielded the same RMSD value. For this purpose, a RMSD threshold slightly higher than that observed with the full AHA segment was used (Sec III.C).
RESULTS
HYPR image noise versus mA
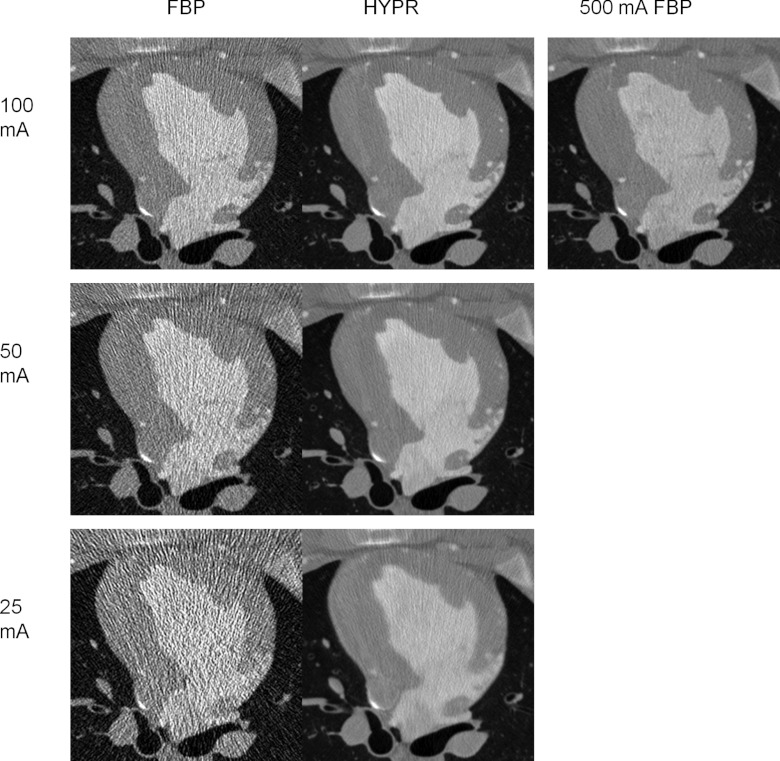
Figure 3 demonstrates HYPR images from 100, 50, and 25 mA scans of Pig 1 with voxel standard deviations measuring 51.6, 52.3, and 61.1 HU in the left anterior myocardium (segment 1). The HYPR images were generated with composite window sizes of 2, 7, and 20 beats, respectively. Larger composite windows were used as tube current was reduced in order to maintain the targeted 500 mA FBP noise level (48.6 HU in this animal). In contrast, the FBP noise levels are higher and increase as tube current is reduced (131.2, 215.4, 401.3 HU, respectively).
Figure 3.
FBP versus HYPR image reconstructions at the same time point in a 100 mA scan (top row), a 50 mA scan (middle row), and a 25 mA scan (bottom row). A FBP reconstruction from the 500 mA scan is shown on the upper right for comparison. The field of view has been cropped around the cardiac anatomy (Pig 1).
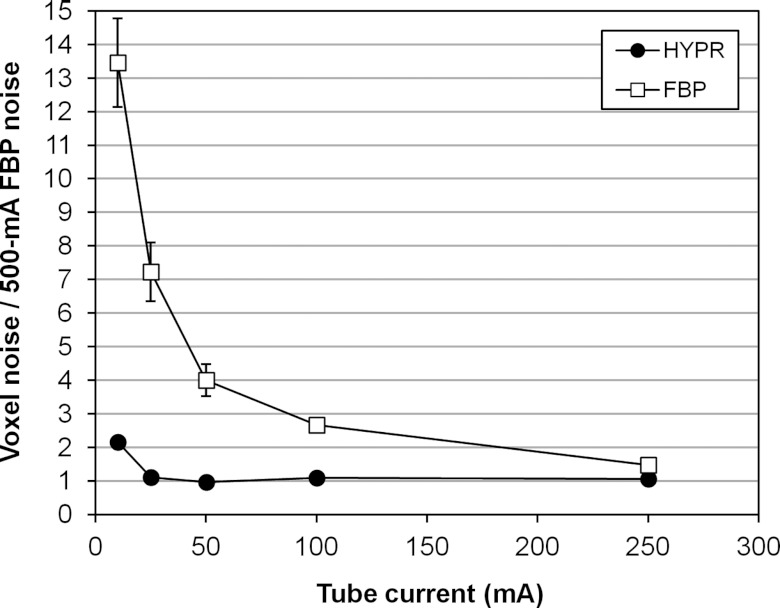
The ratio of low-mA HYPR image noise to 500-mA FBP noise is plotted versus tube current in Fig. 4. The data points represent the average over all segments and animals, and the bars represent the standard deviation in the individual ratios. For scans using 250, 100, 50, and 25 mA (2× to 20× tube current reduction), the average HYPR noise ratios were 1.06, 1.10, 0.97, and 1.11, respectively. For the 10 mA scans (50× tube current reduction), the average HYPR noise ratio was 2.15. In both 25 and 10 mA scans, all available beats were used to form the composite (41–60). However, results show this number was insufficient to achieve the targeted noise level in the 10 mA case.
Figure 4.
Voxel noise in HYPR images (circles) and FBP images (squares) versus mA, expressed relative to the noise measured in 500 mA FBP images. Bars represent the standard deviation in the individual noise ratio measurements.
Accuracy of HYPR time-attenuation curves
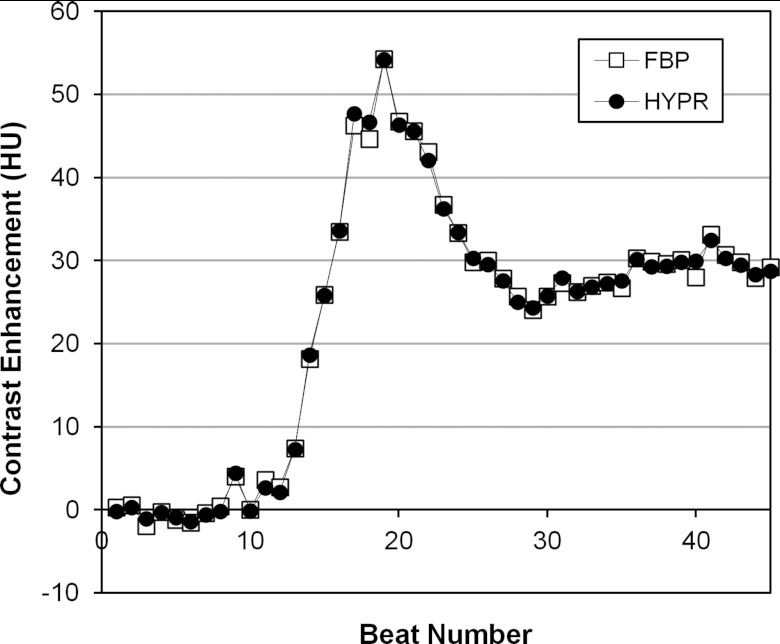
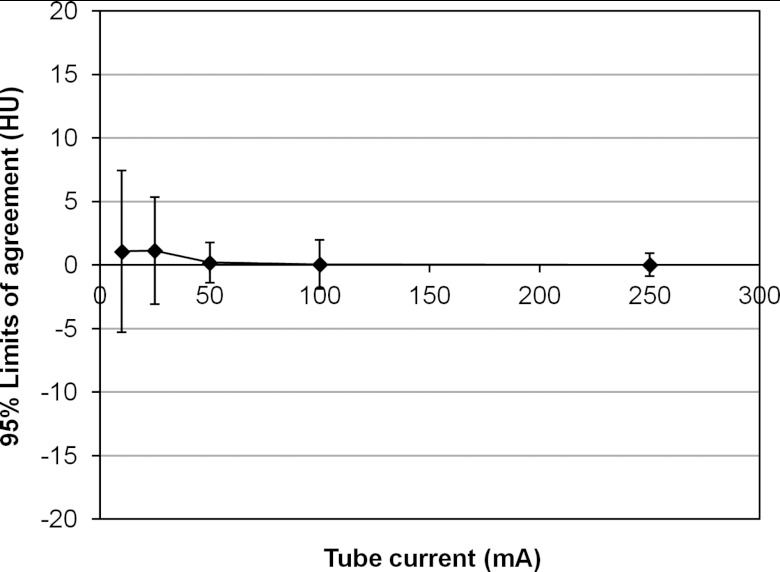
Figure 5 shows an example of HYPR and FBP TACs measured in a full AHA segment (segment 1, 100 mA, Pig 4) used to evaluate the agreement between HYPR and FBP image values. The 95% limits of agreement (mean difference +/−1.96 SD of differences) between values in the TACs were calculated in segments 1, 5, 6, and 7 of each animal at 250, 100, 50, 25, and 10 mA. Figure 6 summarizes the agreement, calculated by averaging the mean differences and standard deviations over all segments and animals at each mA. For 250, 100, and 50 mA scans, the HYPR vs FBP limits of agreement were similar, measuring 0.02+/−0.91, 0.04+/−1.92, and 0.19+/−1.59 HU, respectively. At 25 and 10 mA larger differences were observed, with limits of agreement measuring 1.13+/−4.22 and 1.07+/−6.37 HU, respectively. For comparison, the peak myocardial enhancement over baseline averaged 41 HU (+/−12 HU standard deviation) across different segments, animals, and scans.
Figure 5.
HYPR and FBP time-attenuation curves measured from a large, 15 216 voxel (2.3 cm3) volume of segment 1 in the 100 mA scan of Pig 4.
Figure 6.
Average limits of agreement between HYPR and FBP TACs versus tube current.
For arterial input functions measured from a volume in the left ventricle, the limits of agreement between HYPR and FBP TACs were −0.01+/−4.27, −2.05+/−14.28, 0.00+/−1.26, 0.00+/−2.47, and 0.84+/−12.01 HU, respectively, for 250 to 10 mA scans. For comparison, the peak left ventricular value averaged 598 HU (+/−87 HU standard deviation).
Image measurements in a fat region indicated good stability in CT number with respect to tube current. In each animal the scans were performed in a mixed-mA order: 500, 50, 250, 25, 100, 10 mA. The fat CT number measurements displayed a slight positive linear trend with respect to scan acquisition order (average slope = +3 HU per scan), indicative of a buildup of iodine contrast in the body over the course of the experiment. After trend correction, the fat CT number standard deviation was +/−3.1 HU across all mA values, in both HYPR and FBP images, and the mean value was −96 HU.
Precision of time-attenuation curves versus VOI size
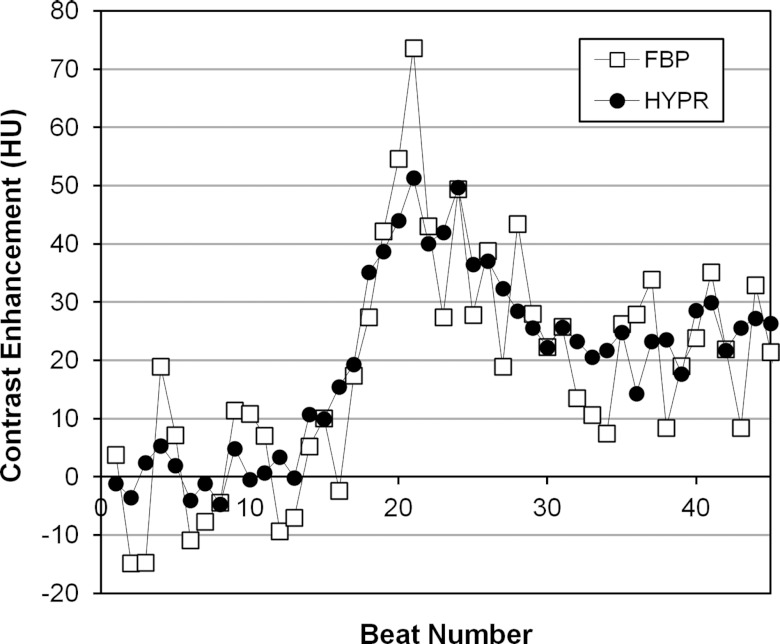
The effect of reduced voxel noise in HYPR images was determined from TACs extracted from smaller myocardial VOIs. Figure 7 compares the 50-mA FBP TAC measured from a subvolume of segment 1 obtained by 3D erosion (492 voxels, 0.073 cm3, Pig 4), and the 50-mA HYPR TAC from the same subvolume. Fluctuations in a TAC can arise from voxel noise as well as artifacts within the VOI which vary in intensity from one beat to the next (e.g., residual partial scan artifact). As anticipated from the reduction in voxel noise, the HYPR TAC in the subvolume exhibits smaller fluctuations.
Figure 7.
HYPR and FBP time-attenuation curves measured from a small, 492 voxel (0.07 cm3) volume of segment 1 in the 50 mA scan of Pig 4.
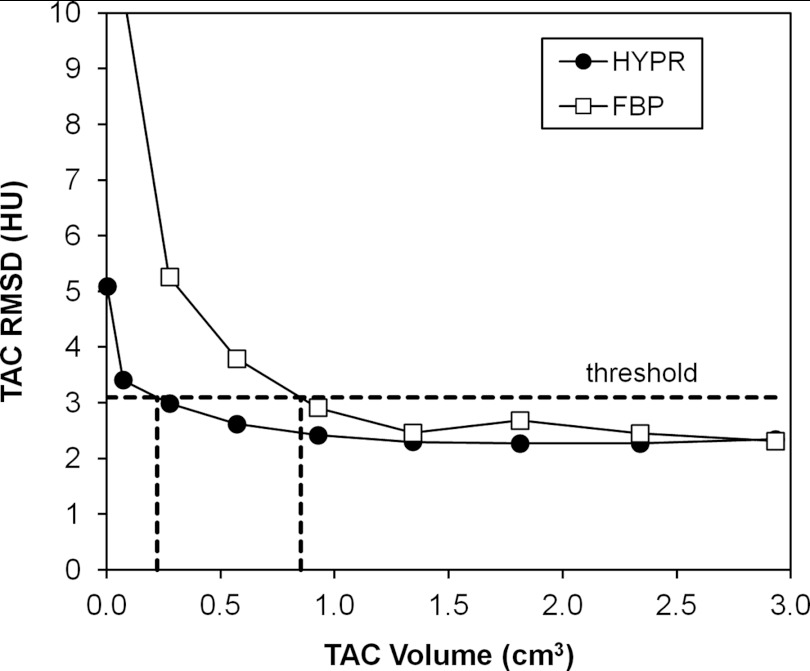
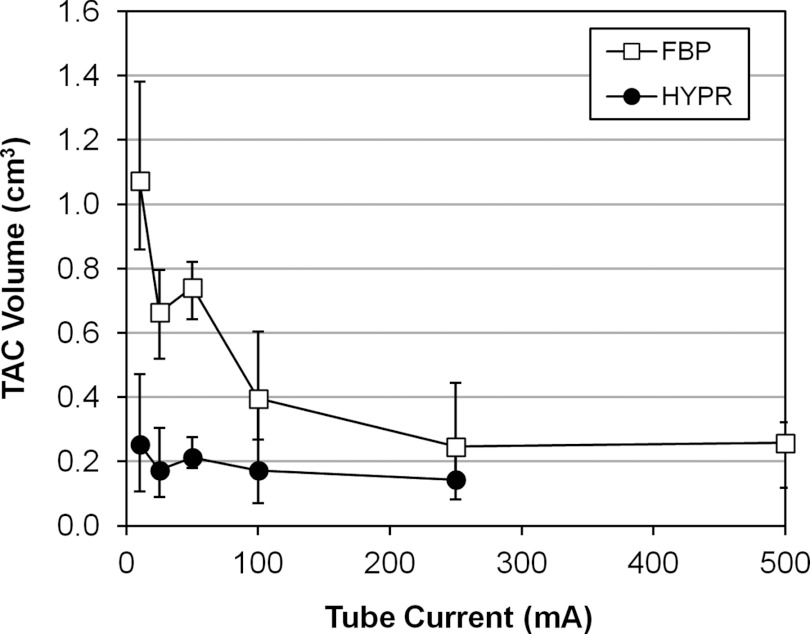
Figure 8 shows the RMSD of the TAC relative to the gamma variate fit as a function of VOI size for HYPR and FBP images (pig 4, segment 1, 50 mA). Initially the RMSD is stable as the VOI size decreases from its largest size. Then as VOI size is further reduced, the RMSD curves begin to rise rapidly due to the influence of voxel noise. This transition from stable to rising RMSD occurs at a smaller VOI size for the HYPR images. To summarize this behavior, each curve was analyzed to determine the smallest VOI size at which a fixed RMSD value was obtained. A RMSD threshold slightly higher than the RMSD measured with the largest VOI was used (33% higher; ∼5 HU average threshold). An example analysis is shown in Fig. 8. Figure 9 presents the results for each tube current, averaged over all segments and pigs. The bars represent the range of per-segment measurements after averaging over all pigs. The HYPR volume was less than the 500-mA FBP volume in 16 out of 20 cases (20 = 4 segment averages × 5 tube currents from 250 to 10 mA.)
Figure 8.
RMSD of TAC values relative to curve fit, as function of VOI size, in segment 1 of the 50 mA scan of Pig 4. Dashed lines show the calculation of HYPR and FBP VOI sizes at a RMSD threshold value of 3 HU.
Figure 9.
Smallest time-attenuation curve measurement volume for HYPR versus FBP images, as a function of tube current. Symbols represent the average over all segments and pigs. Bars represent the range of individual segment results, after averaging over all pigs.
DISCUSSION
Although the field of CT-MPI is still developing, concerns have been raised about the x-ray dose from dynamic protocols which require repeated imaging of the heart.29 Imaging techniques that enable tube current reduction without loss of image quality would address this concern. The results of this study demonstrate the feasibility of using HYPR processing to generate low-noise images and accurate time-attenuation curves from a low-mA time-resolved CT myocardial perfusion scan. The HYPR technique first reduces image noise by forming a set of composite images that represent a moving temporal average at each pixel position. Then each composite is multiplied by a weighting image that restores the pixel values at a given time point to the values estimated to prevail in that time frame. The resulting HYPR time frame images carry a noise level similar to the composite while preserving temporal dynamics.
In this study HYPR images were generated with the goal of matching the voxel noise level measured in a 500-mA FBP reconstruction. By increasing the size of the composite window, HYPR voxel noise within 11% of this target was achieved for tube currents from 250 mA down to 25 mA. However, it should be noted that the 25 mA HYPR images utilized all available beats in the composite, and a relatively large number of beats (∼50) were available since 50 s scans were performed. Due to breath hold limitations a more clinically realistic scan may be limited to 30 s (Refs. 16, 17, 18, 19) and ∼30 cardiac cycles acquired as contrast washes in and out of the myocardium. With a 30 beat limit imposed on the present study, the 500-mA FBP target noise level could have been achieved with tube currents down to 50 mA (20-beat composites). At 50 mA, good agreement was found between HYPR and FBP TAC values measured in large VOIs (0.19 +/−1.59 HU limits-of-agreement). Furthermore, the HYPR TACs measured in small VOIs exhibited less fluctuation than corresponding FBP TACs, indicating that HYPR supports the quantification of flow in smaller volumes.
Although the evaluation of image sharpness was beyond the scope of this study, we note several limiting factors in the present method. First, since no image registration methods were applied prior to forming the composite images, any beat-to-beat inconsistencies in the cardiac shape cause blurring. This was evident in HYPR images using very large composite windows, e.g., in the myocardial border of the 25 mA HYPR image shown in Fig. 3. The use of deformable image registration may address this. Second, although using nonsubtracted images carries the benefit of shortening overall breath hold time, the weighting image values at interfaces between significantly different attenuations (e.g., lung/myocardium) are inaccurate due to the finite spatial extent of the filter kernel. This study used a 7 voxel cubic filter kernel measuring 3.4 × 3.4 × 4.4 mm3. The size of the filter kernel also places a lower limit on the resolution of temporal dynamics within the myocardium. Further research is required to quantify and resolve these limitations. Finally, this study used healthy pigs, and was limited to the demonstration that HYPR can provide high quality time-attenuation curves from reduced tube current scans. While results are promising, additional studies are needed to quantify detectability and dose in an animal model with perfusion defect.
CONCLUSIONS
While dynamic CT-MPI has the potential for noninvasive assessment of the functional significance of coronary stenoses revealed by CCTA, it may also carry a larger radiation burden due to the extended imaging time. HYPR processing is a feasible method for generating low noise myocardial perfusion data from a low-mA dynamic CT myocardial perfusion scan. The method is applicable to current clinical scanners and uses conventional image reconstructions as input data.
ACKNOWLEDGMENTS
Financial support for this work was provided by National Institutes of Health (NIH) Grant No. R01 HL090776. The authors would like to thank Kari Pulfer and Kim Maurer for their assistance with the animal studies, and GE Healthcare, Inc. for assistance with preprocessing of the CT projection data.
References
- Budoff M. J. et al. , “Assessment of coronary artery disease by cardiac computed tomography: A scientific statement from the American Heart Association committee on cardiovascular imaging and intervention, council on cardiovascular radiology and intervention, and committee on cardiac imaging, council on clinical cardiology,” Circulation 114, 1761–1791 (2006). 10.1161/CIRCULATIONAHA.106.178458 [DOI] [PubMed] [Google Scholar]
- Paech D. C. and Weston A. R., “A systematic review of the clinical effectiveness of 64-slice or higher computed tomography angiography as an alternative to invasive coronary angiography in the investigation of suspected coronary artery disease,” BMC Cardiovasc. Disord. 11(32), 1–11 (2011). 10.1186/1471-2261-11-32 [DOI] [PMC free article] [PubMed] [Google Scholar]
- Taylor A. J., Cerqueira M., Hodgson J. M., Mark D., Min J., O’Gara P., and Rubin G. D., “ACCF/SCCT/ACR/AHA/ASE/NASCI/SCAI/SCMR 2010 Appropriate Use Criteria for Cardiac Computed Tomography: A Report of the American College of Cardiology Foundation Appropriate Use Criteria Task Force, the Society of Cardiovascular Computed Tomography, the American College of Radiology, the American Heart Association, the American Society of Echocardiography, the American Society of Nuclear Cardiology, the North American Society for Cardiovascular Imaging, the Society for Cardiovascular Angiography and Interventions, and the Society for Cardiovascular Magnetic Resonance,” J. Am. Coll. Cardiol. 56(22), 1864–1894 (2010). 10.1016/j.jacc.2010.07.005 [DOI] [PubMed] [Google Scholar]
- Klocke F. J. et al. , “ACC/AHA/ASNC guidelines for the clinical use of cardiac radionuclide imaging – executive summary: A report of the American College of Cardiology/American Heart Association Task Force on Practice Guidelines,” Circulation 108, 1404–1418 (2003). 10.1161/01.CIR.0000080946.42225.4D [DOI] [PubMed] [Google Scholar]
- George R. T., Silva C., Cordeiro M. A., DiPaula A., Thompson D. R., McCarthy W. F., Ichihara T., Lima J. A., and Lardo A. C., “Multidetector computed tomography myocardial perfusion imaging during adenosine stress,” J. Am. Coll. Cardiol. 48(1), 153–160 (2006). 10.1016/j.jacc.2006.04.014 [DOI] [PubMed] [Google Scholar]
- George R. T., Arbab-Zadeh A., Miller J. M., Kitagawa K., Chang H. J., Bluemke D. A., Becker L., Yousuf O., Texter J., Lardo A. C., and Lima J. A., “Adenosine stress 64- and 256-row detector computed tomography angiography and perfusion imaging: A pilot study evaluating the transmural extent of perfusion abnormalities to predict atherosclerosis causing myocardial ischemia,” Circ. Cardiovasc. Imaging 2, 174–182 (2009). 10.1161/CIRCIMAGING.108.813766 [DOI] [PMC free article] [PubMed] [Google Scholar]
- Blankstein R., Shturman L. D., Rogers I. S., Rocha-Filho J. A., Okada D. R., Sarwar A., Soni A. V., Bezerra H., Ghoshhajra B. B., Petranovic M., Loureiro R., Feuchtner G., Gewirtz H., Hoffmann U., Mamuya W. S., Brady T. J., and Cury R. C., “Adenosine-induced stress myocardial perfusion imaging using dual-source cardiac computed tomography,” J. Am. Coll. Cardiol. 54(12), 1072–1084 (2009). 10.1016/j.jacc.2009.06.014 [DOI] [PubMed] [Google Scholar]
- Rocha-Filho J. A., Blankstein R., Shturman L. D., Bezerra H. G., Okada D. R., Rogers I. S., Ghoshhajra B., Hoffmann U., Feuchtner G., Mamuya W. S., Brady T. J., and Cury R. C., “Incremental value of adenosine-induced stress myocardial perfusion imaging with dual-source CT at cardiac CT angiography,” Radiology 254(2), 410–419 (2010). 10.1148/radiol.09091014 [DOI] [PMC free article] [PubMed] [Google Scholar]
- Cury R. C., Magalhães T. A., Paladino A. T., Shiozaki A. A., Perini M., Senra T., Lemos P. A., Cury R. C., and Rochitte C. E., “Dipyridamole stress and rest transmural myocardial perfusion ratio evaluation by 64 detector-row computed tomography,” J. Cardiovasc. Comput. Tomogr. 5, 443–448 (2011). 10.1016/j.jcct.2011.10.012 [DOI] [PubMed] [Google Scholar]
- Magalhães T. A., Cury R. C., Pereira A. C., Moreira Vde M., Lemos P. A., Kalil-Filho R., and Rochitte C. E., “Additional value of dipyridamole stress myocardial perfusion by 64-row computed tomography in patients with coronary stents,” J. Cardiovasc. Comput. Tomogr. 5, 449–458 (2011). 10.1016/j.jcct.2011.10.013 [DOI] [PubMed] [Google Scholar]
- Ruzsics B., Schwarz F., Schoepf U. J., Lee Y. S., Bastarrika G., Chiaramida S. A., Costello P., and Zwerner P. L., “Comparison of dual-energy computed tomography of the heart with single photon emission computed tomography for assessment of coronary artery stenosis and of the myocardial blood supply,” Am. J. Cardiol. 104(3), 318–326 (2009). 10.1016/j.amjcard.2009.03.051 [DOI] [PubMed] [Google Scholar]
- Ko S. M., Choi J. W., Song M. G., Shin J. K., Chee H. K., Chung H. W., and Kim D. H., “Myocardial perfusion imaging using adenosine-induced stress dual-energy computed tomography of the heart: Comparison with cardiac magnetic resonance imaging and conventional coronary angiography,” Eur. Radiol. 21(1), 26–35 (2011). 10.1007/s00330-010-1897-1 [DOI] [PubMed] [Google Scholar]
- Meyer M., J. W.NanceJr., Schoepf U. J., Moscariello A., Weininger M., Rowe G. W., Ruzsics B., Kang D. K., Chiaramida S. A., Schoenberg S. O., Fink C., and Henzler T., “Cost-effectiveness of substituting dual-energy CT for SPECT in the assessment of myocardial perfusion for the workup of coronary artery disease,” Eur. J. Radiol. 81(12), 3719–3725 (2012). 10.1016/j.ejrad.2010.12.055 [DOI] [PubMed] [Google Scholar]
- Weininger M., Schoepf U. J., Ramachandra A., Fink C., Rowe G. W., Costello P., and Henzler T., “Adenosine-stress dynamic real-time myocardial perfusion CT and adenosine-stress first-pass dual-energy myocardial perfusion CT for the assessment of acute chest pain: Initial results,” Eur. J. Radiol. 81(12), 3703–3710 (2012). 10.1016/j.ejrad.2010.11.022 [DOI] [PubMed] [Google Scholar]
- Mahnken A. H., Klotz E., Pietsch H., Schmidt B., Allmendinger T., Haberland U., Kalender W. A., and Flohr T., “Quantitative whole heart stress perfusion CT imaging as noninvasive assessment of hemodynamics in coronary artery stenosis: Preliminary animal experience,” Invest. Radiol. 45(6), 298–305 (2010). [DOI] [PubMed] [Google Scholar]
- Bastarrika G., Ramos-Duran L., Rosenblum M. A., Kang D. K., Rowe G. W., and Schoepf U. J., “Adenosine-stress dynamic myocardial CT perfusion imaging: Initial clinical experience,” Invest. Radiol. 45(6), 306–313 (2010). 10.1097/RLI.0b013e3181c4f535 [DOI] [PubMed] [Google Scholar]
- Ho K. T., Chua K. C., Klotz E., and Panknin C., “Stress and rest dynamic myocardial perfusion imaging by evaluation of complete time-attenuation curves with dual-source CT,” JACC Cardiovasc. Imaging 3(8), 811–820 (2010). 10.1016/j.jcmg.2010.05.009 [DOI] [PubMed] [Google Scholar]
- Bamberg F., Becker A., Schwarz F., Marcus R. P., Greif M., von Ziegler F., Blankstein R., Hoffmann U., Sommer W. H., Hoffmann V. S., Johnson T. R., Becker H. C., Wintersperger B. J., Reiser M. F., and Nikolaou K., “Detection of hemodynamically significant coronary artery stenosis: Incremental diagnostic value of dynamic CT-based myocardial perfusion imaging,” Radiology 260(3), 689–698 (2011). 10.1148/radiol.11110638 [DOI] [PubMed] [Google Scholar]
- Wang Y., Qin L., Shi X., Zeng Y., Jing H., Schoepf U. J., and Jin Z., “Adenosine-stress dynamic myocardial perfusion imaging with second-generation dual-source CT: Comparison with conventional catheter coronary angiography and SPECT nuclear myocardial perfusion imaging,” AJR Am. J. Roentgenol. 198(3), 521–529 (2012). 10.2214/AJR.11.7830 [DOI] [PubMed] [Google Scholar]
- Mistretta C. A., Wieben O., Velikina J., Block W., Perry J., Wu Y., Johnson K., and Wu Y., “Highly constrained backprojection for time-resolved MRI,” Magn. Reson. Med. 55(1), 30–40 (2006). 10.1002/mrm.20772 [DOI] [PMC free article] [PubMed] [Google Scholar]
- Johnson K. M., Velikina J., Wu Y., Kecskemeti S., Wieben O., and Mistretta C. A., “Improved waveform fidelity using local HYPR reconstruction (HYPR LR),” Magn. Reson. Med. 59(3), 456–462 (2008). 10.1002/mrm.21505 [DOI] [PMC free article] [PubMed] [Google Scholar]
- Speidel M. A., Van Lysel M. S., Reeder S. B., Supanich M., Nett B. E., Zambelli J., Chang S. M., Hsieh J., Chen G.-H., and Mistretta C. A., “ECG-gated HYPR reconstruction for undersampled CT myocardial perfusion imaging,” Proc. SPIE 6510, 651014-1–651014-11 (2007). 10.1117/12.713740 [DOI] [Google Scholar]
- Supanich M., Tao Y., Nett B., Pulfer K., Hsieh J., Turski P., Mistretta C., Rowley H., and Chen G. H., “Radiation dose reduction in time-resolved CT angiography using highly constrained back projection reconstruction,” Phys. Med. Biol. 54(14), 4575–4593 (2009). 10.1088/0031-9155/54/14/013 [DOI] [PMC free article] [PubMed] [Google Scholar]
- Liu X., Primak A. N., Krier J. D., Yu L., Lerman L. O., and McCollough C. H., “Renal perfusion and hemodynamics: Accurate in vivo determination at CT with a 10-fold decrease in radiation dose and HYPR noise reduction,” Radiology 253(1), 98–105 (2009). 10.1148/radiol.2531081677 [DOI] [PMC free article] [PubMed] [Google Scholar]
- Primak A. N., Dong Y., Dzyubak O. P., Jorgensen S. M., McCollough C. H., and Ritman E. L., “A technical solution to avoid partial scan artifacts in cardiac MDCT,” Med. Phys. 34(12), 4726–4737 (2007). 10.1118/1.2805476 [DOI] [PMC free article] [PubMed] [Google Scholar]
- Stenner P., Schmidt B., Bruder H., Allmendinger T., Haberland U., Flohr T., and Kachelriess M., “Partial scan artifact reduction (PSAR) for the assessment of cardiac perfusion in dynamic phase-correlated CT,” Med. Phys. 36(12), 5683–5694 (2009). 10.1118/1.3259734 [DOI] [PubMed] [Google Scholar]
- Pijls N., Maximal Myocardial Perfusion as a Measure of the Functional Significance of Coronary Artery Disease (Kluwer, London, 1991). [Google Scholar]
- Keijer J. T., van Rossum A. C., van Eenige M. J., Karreman A. J. P., Hofman M. B. M., Valk J., and Visser C. A., “Semiquantitation of regional myocardial blood flow in normal human subjects by first-pass magnetic resonance imaging,” Am. Heart J. 130(4), 893–901 (1995). 10.1016/0002-8703(95)90092-6 [DOI] [PubMed] [Google Scholar]
- Blankstein R. and Jerosch-Herold M., “Stress myocardial perfusion imaging by computed tomography a dynamic road is ahead,” JACC Cardiovasc. Imaging 3(8), 821–823 (2010). 10.1016/j.jcmg.2010.06.008 [DOI] [PubMed] [Google Scholar]


