

Abstract
Objectives
We demonstrate that confocal Raman mapping spectroscopy provides rapid, detailed and accurate neurotransmitter analysis, enabling millisecond time resolution monitoring of biochemical dynamics. As a prototypical demonstration of the power of the method, we present real-time in vitro serotonin, adenosine, and dopamine detection, and dopamine diffusion in an inhomogeneous organic gel, which was used as a substitute for neurologic tissue.
Materials and Methods
Dopamine, adenosine and serotonin were used to prepare neurotransmitter solutions in DI water. The solutions were applied to the surfaces of glass slides, where they inter-diffused. Raman mapping was achieved by detecting non-overlapping spectral signatures characteristic of the neurotransmitters with an alpha 300 WITec confocal Raman system, using 532 nm Nd:YAG laser excitation. Every local Raman spectrum was recorded in milliseconds and complete Raman mapping in a few seconds.
Results
Without damage, dyeing, or preferential sample preparation, confocal Raman mapping provided positive detection of each neurotransmitter, allowing association of the high-resolution spectra with specific micro-scale image regions. Such information is particularly important for complex, heterogeneous samples, where changes in composition can influence neurotransmission processes. We also report an estimated dopamine diffusion coefficient two orders of magnitude smaller than that calculated by the flow-injection method.
Conclusions
Accurate nondestructive characterization for real-time detection of neurotransmitters in inhomogeneous environments without the requirement of sample labeling is a key issue in neuroscience. Our work demonstrates the capabilities of Raman spectroscopy in biological applications, possibly providing a new tool for elucidating the mechanism and kinetics of deep brain stimulation.
Keywords: Basic science, Raman spectroscopy, neurotransmitters, brain
I. INTRODUCTION
The purpose of this work is to demonstrate the prospects of confocal Raman spectroscopy mapping for fast and simultaneous detection of neurotransmitters such as dopamine, serotonin, and adenosine. This research is in response to the need for innovations in minimally invasive tools for biomedical research technology with optimal detection capability for the development of control systems. Although electrochemical detection such as amperometry, fast scan cyclic voltammetry, and chromatography are the methods most frequently applied for neurotransmitter measurements (1-4), applications of optical spectroscopy, such as fluorescence, reflectance and Raman scattering, would have the advantage of providing information about tissue composition at the molecular level (5-10).
Currently, the therapeutic success of deep brain stimulation for tremor associated with Parkinson’s disease (PD) and essential tremor (ET) has led to the early application of deep brain stimulation (DBS) for an increasing spectrum of conditions, ranging from movement disorders to neuropsychiatric conditions (11). Preclinical studies using fast scan cyclic voltammetry and carbon-fiber microelectrodes (CFM) have shown neurotransmitter release in various efferent targets during DBS (12-14). For example, it has been demonstrated that subthalamic nucleus (STN) DBS evokes dopamine release in the caudate in the intact rat and pig and, most significantly, in the parkinsonian rat 6-hydroxydopamine (6-OHDA) model (12-14). Another neurochemical mechanism that may be of particular importance to DBS is adenosine release. Proposed as a chemical mediator of thalamic DBS for the treatment of essential tremor (15), caudate adenosine release can be measured during electrical stimulation of the nigrostriatal dopaminergic tract (16). It has also been demonstrated that STN DBS elicits this release (14).
Whereas the use of CFM chemical microsensors offers the advantage of smaller real-time measurement probes than those previously used in microdialysis (e.g., 5 to 10 μm versus 200 to 400 μm diameter for microdialysis probes), their chemical stability is affected by the biological environment; they, therefore have the disadvantage of being long-term degradable. There remains a high demand for technological development, since a complete understanding of the DBS mechanism remains far from being achieved, in large part because of the technical difficulties in combining measurement modalities for global assessment of neural activity and chemical-specific sensing. As demonstrated in this in vitro research work, Raman spectroscopy, a non-destructive method of detection, provides the opportunity to combine precise, real time measurement of multiple neurotransmitters to imaging data.
If used in future clinical studies for better elucidation of the mechanism of action of DBS, Raman can also have the advantage of increasing the stability of the sensing mechanism by employing non-degradable optical fiber as sensing probes; fibers that can be produced with selected micro-scale dimensions. Furthermore, since light can be collected in real-time via optical fibers, from living tissue, the benefit of high sensitivity to functional changes and, consequently, of revealing the dynamics of cells in the nervous system, either via the absorption of light or emission of light via elastic or inelastic scattering, can be achieved (5-10). Whereas fluorescence/luminescence optical detection approaches have the advantage of strong signals, they have limitations as to the chemical moieties that can be detected simultaneously in a clinical environment. On the other hand, Raman spectroscopy can not only provide the most detailed and accurate analysis of the chemical composition of the sample under study, with no evidence of disruption of catecholamine detection due to the presence of amine-containing metabolites and proteins (5-10), but also, as will be demonstrated in this work, enables monitoring the chemical dynamics at millisecond time resolution, which is another important requirement for in vivo applications.
Thus, in the past few years, various Raman spectroscopic techniques such as surface-enhanced Raman (SERS) (5-7), surface enhanced spatially offset Raman spectroscopy (SESORS) (8), localized surface plasmon resonance (LSPR) (9), and ultraviolet resonance Raman (UVRRS) (10) have been proposed and developed for identification of biological molecules. These Raman techniques have been used for a wide-range of in vitro and in vivo diagnostic applications, such as non-invasively monitoring blood analytes and in working with coronary artery and Alzheimer’s diseases, breast cancer and brain tumors, and for minimally invasive but real-time diagnostics of superficial tissue (skin tissue) and deep tissue (mammalian tissue) (5-10). Further progress in Raman applications for rapid analyte detection is based on development of various correlation and classification algorithms such as the Savitzky–Golay second-derivative (SGSD) method (17), multivariate calibration (MVC) models (18), and multiobjective evolutionary algorithm (MOEA) (19).
Raman spectroscopy also has the advantage of label-free recognition of biomolecules (such as neourotransmitters, in this case), recording a unique vibrational spectrum for each different molecular species (every species has its own unique molecular bond configuration). In particular, this advantage is important in dynamic processes such as diffusion, since diffusion parameters can be measured by direct observation of the species of interest, avoiding the possible inaccuracy introduced by the use of chemical labels with molecules larger or smaller than that of the neurotransmitter analyzed, with possible resultant changes in biological activity. As a prototypical confirmation of the power of the method, in this article we also present an in vitro analysis of the real-time diffusion of dopamine in an inhomogeneous organic gel medium.
II. EXPERIMENTAL PROCEDURE
Materials and sample preparation
The detailed and straightforward sample preparation is as follows: dopamine, adenosine and serotonin were purchased from Sigma-Aldrich (Sigma-Aldrich Co.) and used as received to prepare solutions of 100 μM concentration in DI water and gelatin. The solutions were applied to the surfaces of microscopic glass slides where they inter-diffused, and then studied. For the preparation of samples for dopamine diffusion experiments in gelatin, 1.4g of Knox gelatin (Kraft Foods Global Inc, Tarrytown, NY) was dissolved in 25 mL of DI water with continuous stirring and moderate heat. The measured pH of the gelatin solution was set at 6 by titration. The solution was allowed to cool until it congealed and cut in small pieces. For each test, a new volume of gelatin was used as the matrix for the diffusion of the neurotransmitter, which was applied in solid form to the gelatin surface.
Experimental set-up and data acquisition
The Raman measurements in this study were acquired at ambient conditions with an alpha 300 WITec confocal Raman system (WITec Inc., Ulm, Germany), using the 532 nm excitation of a Nd:YAG laser and a 20X, NA=0.4, objective lens. Briefly, the experimental set-up, which is described in detail elsewhere in the literature (20), consists of a laser source that is coupled into a confocal microscope via a single mode optical fiber of 50 μm diameter; the fiber also has the effective role of a pinhole source for confocal microscopy. The reflected laser line and (elastically) Rayleigh-scattered light are eliminated by an edge filter, which allows only the (inelastically) Raman-scattered light to be focused and collected with a multimode optical fiber that is coupled to the spectrometer as an entrance slit. During measurements, the power output of the Nd:YAG (532 nm) laser was kept low at ~10 mW. For data acquisition, the WiTec Control software was employed; it also controls the piezoelectric stage for sample scanning.
Locally (i. e., at every image pixel), the Raman spectrum was recorded in milliseconds and the overall Raman mapping record of the inter-diffusion of the three neurotransmitters in a few minutes. Each consecutive 41.5 × 46.7 μm2 image in this Raman mapping of dopamine diffusion was acquired with an integration time of 6.4 s per image and 4 ms per local spectrum. To obtain the Raman mapping images, the Raman signal was detected by a 1024 × 127 pixel peltier cooled CCD camera with a spectral resolution of 4 wavenumbers; at each pixel a complete Raman spectrum was recorded.
III. RESULTS AND DISCUSSION
Direct evidence of the usefulness of the Raman technique in neurotransmitter detection is presented in Figs. 1 (a) - (d), where the confocal Raman mapping data acquired for the inter-diffusion of dopamine (pseudo-color: red), adenosine (pseudo-color: blue), and serotonin (pseudo-color: green) are shown. Not only do these figures confirm the coexistence of these compounds, but they also allow the correlation of spectroscopic data with specific micro-scale regions. This information is particularly important for complex, heterogeneous samples, where modification of the chemical or physical composition can influence the neurotransmission processes.
Figure 1.

(a) - (d) confocal Raman mapping images of dopamine (pseudo color: red), serotonin (pseudo color: green), and adenosine (pseudo color: blue) recorded in different spots, and (e) the standard Raman spectra of these neurotrasmitters, as labeled. The spectra are vertically translated for clarity and recorded for the 150 to 3500 cm-1 spectral region.
Some vibrations are common in these neurotransmitters, as revealed by Fig. 1 (e), where the standard Raman spectra of dopamine, adenosine, and serotonin are plotted using the same pseudo-colors as mentioned above. However, in this case, the Raman mapping was achieved by detecting and integrating non-overlapping characteristic spectral signatures of the compounds, as follows: for dopamine the vibration attributed to C-O stretching at 1289 cm-1, for serotonin, the indole ring stretching vibration at 1540 cm-1, and for adenosine either of the adenine ring vibrations at 320 cm-1 or 1336 cm-1 (10,21,22). One reason behind considering these frequencies, although other non-overlapping vibrations exist in these spectra at higher energies (the 2800 – 3500 cm-1 spectral region), is the potential interference, in the latter energy range, of common vibrations arising from molecular structures in living cells and other organic constituents of normal tissue, such as the strong CH-stretching band, the valence vibrations of CH2 and CH3 moieties in proteins and lipids, and the OH bands, mainly assigned to water. Our choice of frequencies thus establishes a sound basis for the current study, and, at the same time, anticipates its applicability to future in vivo investigations. The choice is also based on consideration of the more intense characteristic non-overlapping vibrations of the compounds of interest, thus increasing detection sensitivity and accuracy.
As reported in the literature, environmental factors (e.g., pH, solvents, noble metal surface characteristics, etc.), affect neurotransmitters Raman vibrational lines, mainly through chemical processes (6,7,9,20-22). Consequently, they exhibit changes such as frequency shifts, attenuation, and even complete disappearance. In this context, and for further confirmation of the appropriateness of previously selected frequencies in performing the Raman mapping, we present in Figs. 2 (a) and (b) the integrated spectra of these images and the standard Raman spectra of the analyzed neurotransmitters, respectively. A break between 1000 and 1200 cm-1 is applied to these spectra to allow inclusion of all regions of interests in the same figure. Also, for easier comparison and depiction of the features used for mapping such as the 320, 1289, 1336, and 1540 cm-1 vibrations, we highlight them using the same pseudo-colors (e.g., red for dopamine, blue for adenosine, and green for serotonin).
Figure 2.

(a) integrated spectra of the previously acquired Raman mapping images and (b) standard Raman spectra of the neurotrasmitters in the 150 to 1800 cm-1 spectral region of interest; the latter spectra are presented for comparison purposes.
Comparison of the frequency positions of these bands in Fig. 2 (a) and Fig. 2 (b) shows only very slight shifts, validating the suitability of our frequency selection for Raman mapping. More importantly, assessment of their relative intensities demonstrates that the Raman technique could also be used as a quantitative method for estimating the relative concentrations of neurotransmitters. For example, the adenosine 320 and 1336 cm-1 vibrations, which are highlighted with blue color in Fig. 2(a), have higher intensities in the Raman integrated spectrum of image (d), corroborating the strong blue color observed in this image (see Fig. 1 (d)). Furthermore, besides the dopamine vibration at 1289 cm-1, which was considered for Raman mapping, there is another unmarked dopamine Raman line around 400 cm-1 which has a higher intensity in the integrated spectrum of image (c) than in that of image (a). This observation is again in good agreement with the intensity of the red color seen in the Raman mapping presented in Fig 1 (c) as compared to that in Fig. 1 (a). However, an accurate quantitative analysis by taking into account the ratio of Raman peak cross-sections is obstructed by the above mentioned observed shifting and by the influence of other closely located vibrational modes, an influence that results in a broadening of these bands due to the possible convolution of various vibrations.
Further analysis of the complex process of neurotransmitter diffusion is presented in Fig. 3, where we consider only dopamine in a non-uniform gel medium for a fast-scan confocal Raman mapping. A good signal-to-noise (S/N) ratio was obtained because the green 532 nm wavelength does not excite the fluorescent molecules typical of the organic gelatin medium; therefore no interference from a high background signal was observed in the acquired data.
Figure 3.

Sequential confocal Raman mapping images of dopamine diffusion in gelatin.
There are three important and also interrelated issues to be considered for future in vivo investigations: a fast acquisition time, an acceptable S/N ratio, and the penetration depth of the laser wavelength employed. Concerning the S/N ratio and the penetration depth, a 785 nm near infrared (NIR) laser excitation of a diode laser has been used most commonly for in vivo experiments due to its deeper tissue penetration (of the order of millimeters) and its good S/N ratio, in spite of fluorescence signals expected from the cellular molecules of living tissue. An even longer-wavelength excitation, such as the 1064 nm line of the frequency doubled Nd:YAG laser, will further reduce the tissue fluorescence by approximately two orders of magnitude, therefore improving the S/N ratio. However, a drawback in using this excitation is the increased signal absorption by water at longer wavelengths.
On the other hand, because the intensity of the Raman signal is proportional to the fourth power of the frequency of the excitation, the signal obtained from the green light excitation (which was employed in our experiments) is much stronger than in the other cases, allowing us to decrease the acquisition time by more than an order of magnitude (for a similar S/N ratio). This short acquisition time was instrumental to obtaining information in real time about the diffusion of dopamine in an organic medium and without fluorescence interference, although just for a penetration depth of a few tens of micrometers, as is usual for the 532 nm excitation.
The Knox gelatin was used for the following reasons: it has higher heterogeneity than the standard agarose gel and has mechanical properties closer to those of brain tissue (23); thus, in a very simplified way, the diffusion of dopamine in a gelatin medium may provide a more appropriate model of the natural process occurring in brain tissue.
The sequential confocal Raman mapping images of Fig. 3 reveal the non-uniform “random walk” character typical of diffusion on the microscopic scale, in this case for dopamine. The estimation of the diffusion coefficient of locally deposited neurotransmitter was performed by fitting two consecutive cross-sectional average concentration-time profiles, which were obtained from two consecutive images. The results are presented in Fig. 4, where the thick solid line is the Gaussian fitting curve. For fitting we applied a simplex algorithm to a solution of the diffusion equation:
where C(x) is the concentration distribution, D is the diffusion coefficient, t is the time elapsed from the beginning of the diffusion, and A is related to the total amount of dopamine. The value of 1.28×10⁻⁸ cm2/s for the coefficient of diffusion D obtained in this way is two orders of magnitude smaller than the one calculated by the flow-injection method (24). Whereas the flow-injection method addresses the diffusion of dopamine in liquid, here we study a more involved problem, in which gelatin generates a porous gel-like structure in water (somewhat similar to the brain). Therefore, the diffusion depends strongly on the dimensions of the channels available to dopamine as well as on the gelatin structure, which might create traps (temporary or permanent) for dopamine. A temporary trap, where the dopamine is initially stored and then slowly released back into the gel network, as well as physical movement constraints due to the network structure, strongly reduce the long range diffusion, as suggested by the results of the fitting from Fig. 4.
Figure 4.
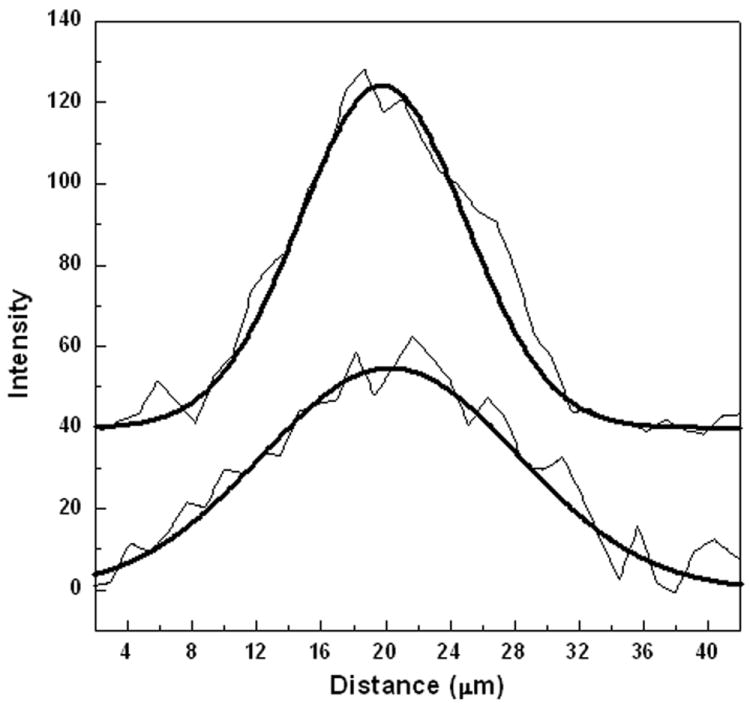
Dopamine diffusion curves. The solid line through each graph is the fitted theoretical curve.
IV. CONCLUSIONS
Since real-time and accurate detection of neurotransmitters in inhomogeneous environments by nondestructive characterization and without the requirement of sample labeling are key issues in bioscience, the work reported here demonstrates the capabilities of Raman spectroscopy in future neuroscience applications.
Although extensive research has been done in DBS, and preclinical studies (12-16) have demonstrated that the function of neurotransmitters such as dopamine, adenosine, and serotonin is affected by Parkinson’s, etc. diseases, the mechanism of DBS is far from being completely understood. As a contribution to this active field, it is possible that optical techniques such as those presented in this study, with their capacity for obtaining real time maps of molecular species concentrations, can create a basis for future visualization and measurement of neurotransmitter release in living systems and thereby provide significant insights into the action of DBS.
In the work reported here, in vitro inter-diffusion of dopamine, adenosine and serotonin have been directly visualized and analyzed using confocal Raman mapping, where integration of characteristic non-overlapping signatures of these neurotransmitters such as the 320, 1289, 1336, and 1540 cm-1 vibrations were considered for detection. Not only is chemical differentiation of these compounds observed at almost stationary time frames (4 ms integration time per spectrum), but the acquired results could form a strong foundation for further accurate quantitative analysis by dynamic functional imaging of chemical and morphological properties of these compounds’ biological environments. This quantitative analysis, based on the ratio of Raman peak cross-sections, is beyond the scope of the research presented here since some of the investigated Raman bands exhibit shifting and broadening; these phenomena require additional consideration from a theoretical modeling perspective.
We also report here a value of 1.28×10⁻⁸ cm2/s for the estimated diffusion coefficient of locally deposited dopamine, a value that is two orders of magnitude smaller than the one calculated by the flow-injection method. A lower value for this coefficient is expected in a solid non-uniform porous medium such as gelatin, since the process will depend on the various dimensions of the available channels for dopamine diffusion. Furthermore, the diffusion process can be quite complex in this gel network structure, which creates temporary or permanents traps for dopamine to be stored and then slowly released back into the medium; phenomena that will strongly reduce the long range diffusion. From this perspective, although in a very simplified way, the diffusion of neurotransmitters in gelatin mimics quite well the natural process occurring in brain tissue.
In conclusion, Raman spectroscopy can provide critical insights into the problems of accurate detection and fast monitoring of neurotransmitters’ diffusion and distribution in inhomogeneous environments. This technique has tremendous clinical potential, and there is substantial room for future advances.
Acknowledgments
Source(s) of financial support: This work has been supported by NIH K08 NS 52232 award and by a research agreement between Mayo Clinic and the University of Texas at El Paso and The Grainger Foundation to KEB and KHL.
Dr. Felicia S. Manciu provided the expertise in Raman Spectroscopy, designed the studies and the experimental approach. Prof. Kevin E. Bennet and Dr. Kendall Lee provided the relevance, additions to the studies and obtained the funding. Dr. Manciu developed the original manuscript with assistance from Prof. Bennet. Dr. Manciu and Dr. William Durrer conducted the experiments, analyzed the data, and made the figures. All authors reviewed the data and provided editorial improvements and approved the final manuscript.
Footnotes
Conflict of interest statement: The authors report no conflict of interest.
References
- 1.Phillips TM. Measurement of bioactive neuropeptides using a chromatographic imunosensor cartridge. Biomed Chromatogr. 1996;10:331–336. doi: 10.1002/(SICI)1099-0801(199611)10:6<331::AID-BMC614>3.0.CO;2-F. [DOI] [PubMed] [Google Scholar]
- 2.Lacroix M, Bianco P, Lojou E. Modified random assembly of microelectrodes for the selective electrochemical detection of dopamine. Electroanalysis. 1999;11:1068–1076. [Google Scholar]
- 3.Downard AJ, Roddick AD, Bond AM. Covalent modification of carbon electrode for voltammetric differentiation of dopamine and ascorbic acid. Anal Chim Acta. 1995;317:303–310. [Google Scholar]
- 4.Thorre K, Pravda M, Sarre S, Ebinger G, Michotte Y. New antioxidant mixture for long term stability of serotonin, dopamine and their metabolites in automated microbore liquid chromatography with dual electrochemical detection. J Chromatogr B: Biomed Sci & Appl. 1997;694(2):297–303. doi: 10.1016/s0378-4347(97)00126-6. [DOI] [PubMed] [Google Scholar]
- 5.Perera PN, Deb SK, Davisson VJo, Ben-Amotz D. Multiplexed concentration quantification using isotopic surface-enhanced resonance Raman scattering. J Raman Spectrosc. 2010;41:752–757. [Google Scholar]
- 6.Hanlon EB, Manoharan R, Koo T-W, Shaefer KE, Motz JT, Fitzmaurice M, Kramer JR, Itzkan I, Dassari RR, Feld MS. Prospects for in vivo Raman spectroscopy. Phys Med Biol. 2000;45:R1–R59. doi: 10.1088/0031-9155/45/2/201. [DOI] [PubMed] [Google Scholar]
- 7.Kirsch M, Schackert G, Salzer R, Krafft C. Raman spectroscopic imaging for in vivo detection of cerebral brain metastases. Anal Bioanal Chem. 2010;398:1707–1713. doi: 10.1007/s00216-010-4116-7. [DOI] [PubMed] [Google Scholar]
- 8.Stone N, Faulds K, Graham D, Matousek P. Prospects of Deep Raman Spectroscopy for Noninvasive Detection of Conjugated Surface Enhanced Resonance Raman Scattering Nanoparticles Buried within 25 mm of Mammalian Tissue. Anal Chem. 2010;82:3969–3973. doi: 10.1021/ac100039c. [DOI] [PubMed] [Google Scholar]
- 9.Das A, Zhao J, Schatz GC, Sligar SG, Van Duyne RP. Screening of Type I and II Drug Binding to Human Cytochrome P450-3A4 in Nanodiscs by Localized Surface Plasmon Resonance Spectroscopy. Anal Chem. 2009;81:3754–3759. doi: 10.1021/ac802612z. [DOI] [PMC free article] [PubMed] [Google Scholar]
- 10.Schulze HG, Greek LS, Barbisa CJ, Blades MW, Gorzalka BB, Turner RFB. Measurement of some small-molecule and peptide neurotransmitters in-vitro using a fiber-optic probe with pulsed ultraviolet resonance Raman spectroscopy. J Neurosci Methd. 1999;92:15–24. doi: 10.1016/s0165-0270(99)00081-3. [DOI] [PubMed] [Google Scholar]
- 11.Lyons MK. Deep brain stimulation: current and future clinical applications. Mayo Clin Proc. 2011;86:662–672. doi: 10.4065/mcp.2011.0045. [DOI] [PMC free article] [PubMed] [Google Scholar]
- 12.Lee KH, Blaha CD, Cooper S, Hitti FL, Leiter JC, Roberts DW, Kim U. Dopamine efflux in the rat striatum evoked by electrical stimulation of the subthalamic nucleus: potential mechanism of action in Parkinson’s disease. Eur J Neurosci. 2006;23:1005–1014. doi: 10.1111/j.1460-9568.2006.04638.x. [DOI] [PubMed] [Google Scholar]
- 13.Lee KH, Blaha CD, Garris PA, Mohseni P, Horne AE, Bennet KE, Agnesi F, Bledsoe JM, Lester DB, Kimble C, Min H-K, Kim Y-B, Cho Z-H. Evolution of deep brain stimulation: human electrometer and smart devices supporting the next generation of therapy. Neuromod. 2009;12:85–103. doi: 10.1111/j.1525-1403.2009.00199.x. [DOI] [PMC free article] [PubMed] [Google Scholar]
- 14.Shon YM, Chang SY, Tye SJ, Kimble CJ, Bennet KE, Blaha CD, Lee KH. Comonitoring of adenosine and dopamine using the Wireless Instantaneous Neurotransmitter Concentration System: proof of principle. J Neurosurg. 2010a;112:539–548. doi: 10.3171/2009.7.JNS09787. [DOI] [PMC free article] [PubMed] [Google Scholar]
- 15.Bekar L, Libionka W, Tian GF, Xu Q, Torres A, Wang X, Lovatt D, Williams E, Takano T, Schnermann J, Bakos R, Nedergaard M. Adenosine is crucial for deep brain stimulation-mediated attenuation of tremor. Nat Med. 2008;14:75–80. doi: 10.1038/nm1693. [DOI] [PubMed] [Google Scholar]
- 16.Cechova S, Venton BJ. Transient adenosine efflux in the rat caudate-putamen. J Neurochem. 2008;105:1253–1263. doi: 10.1111/j.1471-4159.2008.05223.x. [DOI] [PubMed] [Google Scholar]
- 17.Zhang D, Ben-Amotz D. Enhanced Chemical Classification of Raman Images in the Presence of Strong Fluorescence Interference. Appl Spectrosc. 2000;54:1379–1383. [Google Scholar]
- 18.Dingari NC, Barman I, Singh G, Kang JW, Dasari R, Feld M. Investigation of the specificity of Raman spectroscopy in non-invasive blood glucose measurements. Anal Bioanal Chem. 2011;400:2871–2880. doi: 10.1007/s00216-011-5004-5. [DOI] [PMC free article] [PubMed] [Google Scholar]
- 19.Jarvis RM, Rowe W, Yaffe N, O’Connor R, Knowles J, Blanch EW, Goodacre R. Multiobjective evolutionary optimisation for surface-enhanced Raman scattering. Anal Bioanal Chem. 2010;397:1893–1901. doi: 10.1007/s00216-010-3739-z. [DOI] [PubMed] [Google Scholar]
- 20.Hollricher O. Confocal Raman microscopy teams high-resolution capabilities with powerful materials analysis. OE Mag. 2003;3:16–20. [Google Scholar]
- 21.Pande S, Jana S, Sinha AK, Sarkar S, Basu M, Pradhan M, Pal A, Chowdhury J, Pal T. Dopamine Molecules on Aucore – Agshell Bimetallic Nanocolloids: Fourier Transform Infrared Raman, and Surface-Enhanced Raman Spectroscopy Study Aided by Density Functional Theory. J Phys Chem. 2009;113:6989–7002. [Google Scholar]
- 22.Tu Q, Chang C, Eisen J. Surface-enhanced Raman spectroscopy of indolic molecules adsorbed on gold colloids. J Biomed Opt. 2010;15:020512. doi: 10.1117/1.3400660. [DOI] [PubMed] [Google Scholar]
- 23.Ritter RC, Quate EG, Gillies gT, Grady MS, Howard MA, III, Broaddus WM. Measurement of friction on straight catheters in in vitro brain and phantom materials. IEEE Trans Biomed Eng. 1998;45(4):476–485. doi: 10.1109/10.664203. [DOI] [PubMed] [Google Scholar]
- 24.Gerhardt GA, Adams RN. determination of diffusion coefficients by flow-injection analysis. Anal Chem. 1982;54:2618–2620. [Google Scholar]