

Abstract
The standardized extract of the St. John’s wort plant (Hypericum perforatum) is commonly used to treat mild to moderate depression. Its active constituent is hyperforin, a phloroglucinol derivative that reduces the reuptake of serotonin and norepinephrine by increasing intracellular Na+ concentration through the activation of non-selective cationic TRPC6 channels. TRPC6 channels are also Ca2+-permeable, resulting in intracellular Ca2+ elevations. Indeed, hyperforin activates TRPC6-mediated currents and Ca2+ transients in rat PC12 cells, which induce their differentiation, mimicking the neurotrophic effect of NGF. Here, we show that hyperforin modulates dendritic spine morphology in CA1 and CA3 pyramidal neurons of hippocampal slice cultures through the activation of TRPC6 channels. Hyperforin also evoked intracellular Ca2+ transients and depolarizing inward currents sensitive to the TRPC channel blocker La3+, thus resembling the actions of the neurotrophin BDNF in hippocampal pyramidal neurons. These results suggest that the antidepressant actions of St. John’s wort are mediated by a mechanism similar to that engaged by BDNF.
Keywords: CA1 pyramidal neuron, CA3 pyramidal neuron, hippocampus, TRPC6, biolistic transfection, confocal microscopy, organotypic slice culture, siRNA-mediated knockdown
Introduction
Major depressive disorder is a devastating major health concern in developed countries, affecting over fifteen % of the population (Ustun et al.2004). Dysfunction in structural and functional plasticity is considered to be involved in the pathogenesis of depression (Duman2002; Duman2004; Pittenger et al.2008). Disruption of hippocampal function is thought to contribute to several aspects and symptoms of depression, such as deficits in concentration. The hippocampus shares anatomical connections to the amygdala, the frontal cortex, and the ventral tegmental area, all of which are implicated in mood and anhedonia. Indeed, brain imaging studies in depressed patients revealed decreased hippocampal volume, and postmortem brain studies showed moderate apoptosis and atrophy in the CA1 region and the dentate gyrus (MacMaster et al.2008; O'Brien et al.2004; Sheline et al.1999). Classical antidepressants, such as selective serotonin reuptake inhibitors (SSRI), may counteract these changes by increasing neuronal plasticity through enhanced serotonin and norepinephrine levels. The resulting activation of monoaminergic receptors and their respective postsynaptic signal cascades also includes neurotrophic factors such as brain derived neurotrophic factor (BDNF) and nerve growth factor (NGF) (Boldrini et al.2009; Malberg et al.2000; Nakagawa et al.2002). Intriguingly, reduced BDNF levels were observed in the hippocampus of patients with major depression disorder, and antidepressant treatment increased BDNF levels (Castren et al.2007; D'Sa et al.2002; Dwivedi et al.2003; Mattson et al.2004; Sen et al.2008). Therefore, neuroplastic changes mediated by neurotrophic factors ranging from neurogenesis to synaptogenesis and associated morphological changes of dendritic spines are considered the final biological action of antidepressants on the reversal of clinical symptoms (Hajszan et al.2005; Hajszan et al.2009; Pittenger et al.2008). Furthermore, the hypothesis that stress and depression are associated with the loss of hippocampal synapses and dendritic spines received recent attention (Hajszan et al.2005; Hajszan et al.2009). Dendritic spines are the main loci of synaptic plasticity, where long-term alterations of synaptic strength are converted into persistent morphological changes (Chapleau et al.2009; Kasai et al.2003; Segal2010). Classically, they have been categorized on the basis of their structure as thin, stubby, and mushroom spines (Peters et al.1969). The particular morphology of dendritic spines may affect the compartmentalization of electrical and/or biochemical signals generated in them, contributing to synaptic integration and plasticity in different ways (Alvarez et al.2007).
In addition to classical antidepressants such as SSRIs, the standardized extract of the plant St. John’s wort (Hypericum perforatum) is commonly used to treat mild to moderate depression (Linde et al.2005; Linde et al.2008; Muller2003). The active constituent of St. John’s wort is hyperforin, a phloroglucinol derivative (Muller et al.1998; Singer et al.1999). Like most synthetic antidepressants, hyperforin inhibits the reuptake of serotonin and norepinephrine (Singer et al.1999; Wonnemann et al.2000). In contrast to synthetic antidepressants however, hyperforin is not a competitive inhibitor of those neurotransmitter transporters. Instead, hyperforin selectively activates the canonical transient potential channel 6 (TRPC6) (Leuner et al.2007). TRPC6 channels belong to the superfamily of transient receptor potential channels (TRP). This TRP channel subfamily consists of seven members of non-selective cationic channels, TRPC1 – TRPC7 (Montell2006; Moran et al.2004), which are highly expressed in the brain, including the hippocampus (Strubing et al.2003). Increases in intracellular Na+ concentration resulting from the activation of Na+-permeable TRPC6 channels by hyperforin inhibits monoamine neurotransmitter uptake (Singer et al.1999; Treiber et al.2005). TRPC6 channels are also permeable to Ca2+, which results in intracellular Ca2+ elevations upon hyperforin activation, thus mimicking the neurotrophic effect of NGF in PC12 cells, inducing their differentiation (Leuner et al.2007).
TRPC channels are also downstream effectors of neurotrophin signaling in CNS neurons (Amaral and Pozzo-Miller 2007b; Li et al.1999). We recently showed that BDNF induces a slowly developing inward membrane current in hippocampal pyramidal neurons, which is associated with intracellular Ca2+ elevations that requires TRPC3 channel expression (Amaral and Pozzo-Miller 2007b). Furthermore, TRPC3 channels are necessary for BDNF to increase dendritic spine density in CA1 pyramidal neurons, specifically promoting the formation of the mature (i.e. stubby) spine morphological category (Amaral and Pozzo-Miller 2007a, 2007b; Li et al.2010). Here, we show that hyperforin modulates dendritic spine density and morphology in hippocampal pyramidal neurons through the activation of TRPC6 channels. These effects are reminiscent to those of BDNF because hyperforin also evokes Ca2+ transients and membrane currents in hippocampal pyramidal neurons.
Materials and Methods
All animal procedures adhered strictly to national and international guidelines for the ethical use of research animals, such as the Public Health Service (PHS) Policy on Humane Care and Use of Laboratory Animals (http://grants.nih.gov/grants/olaw/references/phspol.htm) and the Policies on the Use of Animals and Humans in Neuroscience Research (http://www.sfn.org/index.cfm?pagename=guidelinesPolicies_UseOfAnimalsandHumans) from the Society for Neuroscience. Lastly, the Institutional Animal Care and Use Committee (IACUC) of The University of Alabama at Birmingham (UAB) reviews and approves all animal procedures described in the present report on an biannual basis (UAB-IACUC Protocol Numbers 110109021 and 100108695).
Organotypic slice culture
Hippocampi were dissected from anesthetized postnatal day 7–11 (P7–11) Sprague Dawley rats (Harlan; Indianapolis, IN or Charles River; Wilmington, MA) and cut transversely into ~400 µm-thick slices using a custom-made wire-slicer fitted with 20 µm-thick gold-coated platinum wire (Miller et al.1993). The resulting hippocampal slices were plated on Millicell-CM filter inserts (Millipore; Billerica, MA) and cultured in 36°C, 5% CO2, 98% relative humidity incubators (Thermo-Forma; Waltham, MA) in culture media (Neurobasal-A plus B27, InVitrogen; Carlsbad, CA) containing 20% equine serum for the first 4 days in vitro (div). To exclude the confounding effects of hormones and growth factors in the serum, its concentration was gradually reduced over a period of 48 hrs starting at 4 div (24 hrs each in 10% and 5% serum). After a period of 24 hrs in serum-free media (Neurobasal-A plus B27), slices were ready to be used for electrophysiology (Tyler and Pozzo-Miller 2001). Each treatment group came from three independent preparations of slice cultures from different animals. For confocal imaging, slice cultures were treated as described above and in the original publications (Gahwiler1981; Pozzo Miller et al.1993; Stoppini et al.1991; Yamamoto et al.1989) and were transfected using a gene gun (see below).
Primary culture of dissociated postnatal neurons
Hippocampal neurons were prepared according to Amaral and Pozzo-Miller (2007a, 2007b). Briefly, hippocampi were dissected from anesthetized P2 rat pups and dissociated with papain (Worthington, Lakewood, NJ, USA). The tissue was triturated to obtain single cells, which were re-suspended in Neurobasal medium containing B-27 supplement, 10 IU/mL, penicillin-streptomycin and L-glutamine. Dissociated cells were plated on glass coverslips coated with poly-DL-lysine and cultured for 10–14 days at 37°C in 5% CO2, 98% relative humidity. Half of the culture medium was changed every 4 days.
TRPC6 shRNA interference, TRPC6dn and TRPC6 plasmids
shRNA plasmids (Origene, Rockville, USA) were designed to target TRPC6 channel subunits using the pRS vector. The sequences incorporated against TRPC6 are:
shRNA1: TGTCCAGTGAAGATCCAGTCATGACAGCT
shRNA2: AAGAAGGTTGGCTAATCGAGGACCAGCAT
shRNA3: TACAAGGAGCTCAGAAGATTTCCATTTAAA
shRNA random: CTACCGATCCTCAGATCATCTCTGAAGGT.
To confirm the efficacy of shRNA plasmids to knockdown TRPC6 channels, PC12 cells were transfected with 0.5 µg shRNA using Fugene (Roche, Basel, Switzerland). shRNA was diluted with Optimem (30 µL) and Fugene (1 µL) and mixed together for 15 min at 37° C. The transfection mixture was added to the cells, and after 48 hrs cells were harvested and processed for Western blotting, as described (Leuner et al.2007). TRPC6 and TRPC6dn were kindly provided by Dr. Michael Schaefer (Hofmann et al.1999).
Western blots from PC12 cell membrane fractions
Untransfected PC12 cells and PC12 cells transfected with shRNA 1, 2, 3, and shRandom were harvested by centrifugation (800 × g, 5 min, room temperature). Cells were resuspended in lysis buffer (50 mM Tris/HCl, 2 mM DTT, 0.2 µM benzamidine, 1 mM EDTA, pH 8.0) and homogenized. After removal of nuclei (800 × g, 2 min, 4 °C), supernatants were mixed with gel loading buffer (62.5 mM Tris/HCl, 10% glycerol, 5% mercaptoethanol, 2% SDS, 0.02% bromophenol blue, pH 6.8). After electrophoresis, the proteins were transferred on nitrocellulose membrane. The membrane was incubated with polyclonal rabbit anti-TRPC6 antibody or with polyclonal mouse anti-GAPDH (InVitrogen) over night. The antibodies were visualized by incubation with horseradish-antibody conjugate. Immunoblots were quantified by optical density (OD), and TRPC6 bands compared as ratios to the OD of the GADPH band.
Particle-mediated gene transfer
On 6 div, hippocampal slices were co-transfected with a plasmid encoding enhanced yellow fluorescent protein (eYFP; Clontech; Mountain View, CA), the TRPC6 shRNA, or a dominant negative knockdown of TRPC6 (TRPC6dn). A custom-modified Helios gene gun (Bio-Rad; Hercules, CA) was used to perform the biolistic transfection following established protocols (Alonso et al. 2004; Lo et al.1994). Briefly, plasmid cDNA and shRNA were precipitated onto 1.6 µm colloidal Au at a ratio of 50 µg eYFP plasmid to 100 µg siRNA oligo to 25 mg Au. This mixture was coated onto Tefzel tubing using 0.06 mg/mL polyvinylpyrrolidone. Slices were bombarded using He pressure at 100 psi at a distance of 15 mm. For experiments using only eYFP, gene transfer was performed as above, except the plasmid encoding eYFP was precipitated onto 1.6 µm colloidal gold at a ratio of 50 µg DNA to 25 mg Au.
Twenty-four hours after particle-mediated gene transfer, hyperforin (0.3 µM), and DMSO as vehicle control (0.01%) were added to the serum-free culture media. To facilitate penetration of the reagents an additional 50 µL of medium was gently placed on top of each slice. After 24 hrs of treatments, slices were fixed in 4% paraformaldehyde (100 mM phosphate buffer) for 60 min, rinsed in PBS and mounted on glass slides using Vectashield (Vector labs; Burlingame, CA).
Confocal microscopy
A FluoView300 laser-scanning confocal microscope (Olympus; Center Valley, PA) fitted with a 100× 1.4NA oil immersion objective was used to acquire images of apical secondary and tertiary dendrites of eYFP-transfected CA1 and CA3 neurons. eYFP was excited with the 488nm line of the Ar laser, and detected using standard FITC filters. Optical sections in the z-axis were acquired at 0.1 µm intervals.
Dendritic spine analysis
Dendritic spines were identified as small projections extending ≤ 3 µm from the adjacent dendrite, as described (Alonso et al.2004; Amaral and Pozzo-Miller 2007b; Tyler and Pozzo-Miller 2001, 2003). Spines were quantified on maximum-intensity projections of the z-stacks using ImageJ software (W.S. Rasband, U.S. National Institutes of Health, Bethesda, Maryland, USA; http://rsb.info.nih.gov/ij/, 1997–2009). To ensure that each spine was counted only once, their course was followed through the stack of z-sections. In addition, only those spines that appeared continuous with the parent dendrite were used for analysis. Dendritic spines were classified following the categories defined by Peters and colleagues (Peters et al.1969), as stubby (Type-I), mushroom (Type-II), and thin (Type-III) types. Individual spines were included in each category based on the specific ratios L/dn and dh/dn, where L is the length of the spine from its base at the dendrite to the tip of its head, dn is the maximum neck diameter, and dh is the maximum head diameter, as previously described (Harris et al.1992; Koh et al.2002). Stubby spines have a length similar to the diameter of the neck, which is similar to the diameter of the spine head, all typically ≤ 1µm (L ≈ dn ≈ dh). Mushroom spines are typically ≤ 1µm in length with a neck diameter much smaller than the diameter of the head (dn « dh). Generally, thin spines have lengths longer than 1µm, which is much greater than the neck diameter (L » dn). While the physical dimensions of individual dendritic spines were primarily used to define the morphological categories, they were also quantified and analyzed statistically. Due to the disparity of spine densities across treatment groups, the quantity of spines in each morphological class were analyzed, and are expressed, as the proportion to all spines (total number of spines). Spine density was calculated by quantifying the number of spines per length of imaged dendrite and then normalized to 10 µm of dendritic length. The cumulative length of dendritic segments imaged for spine density analyses from three different preparations was as follows: DMSO: 609.1 µm; hyperforin in CA1 neurons: 740.5 µm; hyperforin in CA3 neurons: 487.9 µm; hyperforin + shRNA3: 565.9 µm; hyperforin + random shRNA: 381.1 µm; hyperforin + TRPC6dn: 350.8 µm; shRNA3: 636.7 µm; TRPC6dn: 536.9 µm; TRPC6: 671.1 µm.
Dendritic complexity analysis
eYFP-transfected neurons were traced in three dimensions from the z-stack using Neurolucida (MicroBrightField) (Alonso et al. 2004). The intersections of traced dendrites with a series of concentric spheres starting at the soma and spaced at 20 μm intervals were used as a measure of dendritic complexity. The total dendritic length and number of dendritic branching points (nodes) were calculated and used for statistical comparisons.
Intracellular whole-cell recordings
Individual 7 div slice cultures or 300 µm-thick acute hippocampal slices from P30–40 wildtype C57/Bl6 mice (cut with a Leica VT1200S vibrating blade microtome) were transferred to a recording chamber mounted on a fixed-stage upright microscope (Zeiss Axioskop FS; Oberkochen, Germany), and continuously perfused (2mL/min) with aCSF at room temperature (24°C), containing (in mM): 124 NaCl, 2 KCl, 1.24 KH2PO4, 1.3 MgSO4, 17.6 NaHCO3, 2.5 CaCl2, 10 glucose, and 29.2 sucrose (310–320mOsm); aCSF was bubbled with 95% O2 / 5% CO2 (pH 7.4). Superficial CA3 pyramidal neurons were visualized with a water-immersion 63× objective (0.9NA) using IR-DIC microscopy. Whole-cell intracellular recordings were performed as described (Amaral and Pozzo-Miller, 2007a). Briefly, unpolished patch pipettes (tip resistance 3–4MΩ) that containing (in mM): 120 Cs-gluconate, 17.5 CsCl, 10 Na-HEPES, 4 Mg-ATP, 0.4 Na-GTP, 10 Na2-creatine phosphate, and 0.2 Na-EGTA (replaced by 200µM fura-2 for Ca2+ imaging) at 290–300 mOsm and pH 7.4. Membrane currents were recorded in the voltage-clamp mode at a holding potential of −65mV using an Axoclamp 200B amplifier (Molecular Devices; Sunnyvale, CA), filtered at 2kHz, and digitized at 10kHz. Recordings were accepted only if access (series) resistance was ≤ 30MΩ. Input resistance (Ri) was measured with hyperpolarizing voltage pulses (50ms, −20mV), and cells were discarded if any of those cell parameters (Cm, Ri, Rs) changed by ≥ 20% during the course of an experiment. Ca2+ imaging was performed by including the indicator fura-2 in the intracellular solution (200µM; Invitrogen, Carlsbad, CA). After 30min of whole-cell access, fura-2 was excited at 360 and 380nm with a galvanometric monochromator (Polychrome IV, TILL Photonics, Munich, Germany) and detected with a quantitative electron-multiplying CCD camera (QuantEM:512SC, Photometrics, Tucson, AZ). We have established that excitation of fura-2 at 360nm is more efficient than at 340nm when using water-immersion objectives. Alternating pairs of 360nm and 380nm excitation frames were acquired every 15sec. Background-subtracted fluorescence intensities were measured within regions of interest (ROIs) defined over the proximal and distal portions of primary dendrites. The average ratio of 360 and 380nm fluorescence within each ROI was used as an estimate of intracellular Ca2+ concentration as these two parameters are directly proportional to each other. Electrophysiology data were acquired on a single G4 Macintosh computer (Apple; Cupertino, CA) running custom-written software (TIWorkBench).
Hyperforin and Hyp2 were pressure-applied from a glass pipette (~2MΩ) containing a 10µM solution and connected to low-pressure regulator and a dry N2 tank (~0.4 PSI; World Precision Instruments, Sarasota, FL). Application pipettes were positioned ~50µm above the slice and ~200µm away from the soma of the CA3 pyramidal neuron under recording to avoid pressure and mechanical artifacts, and aimed at its apical dendrites within striatum lucidum and against the direction of aCSF flow in the recording chamber. Each 30-sec pulse delivered a maximum of 2µL of Hyperforin or Hyp2, which yielded a dilution actor of ~2,000. Hyperforin and Hyp2 were dissolved in DMSO (≤ 0.01% final concentration); vehicle controls using 0.01% DMSO were routinely performed and yielded no significant responses. All of the chemicals used for these experiments were obtained from Sigma (St. Louis, MO), Calbiochem (San Diego, CA), or Tocris (Ellisville, MO).
Calcium imaging
After 10–14 div, cultured hippocampal neurons were washed with HBSS composed of 138 mM NaCl, 6 mM KCl, 1 mM MgCl2, 2 mM CaCl2, 5.5 mM glucose, and 10 mM HEPES (adjusted to pH 7.4 with NaOH) and loaded for 30 min with fura-2AM (5 µM). After rinsing twice with HBSS, neurons were allowed to de-esterify fura-2 for 30 min. Digital imaging of fluorescent fura-2 emission (510nm longpass) was performed either using a cooled CCD camera (PXL-37, Photometrics) and a 20× (0.5NA) water immersion objective in a fixed-stage upright microscope (Axioskop FS; Carl Zeiss, Oberkochen, Germany) or a Attofluor camera (FLR-103-100, Attofluor) in an inverted microscope (Axiovert 100, Zeiss). Fluorescence excitation (350 nm and 380 nm, 20 nm bandpass) was provided by a galvanometer-driven monochromator (T.I.L.L. Photonics, Martinsried, Germany) or by a monochromator-based imaging system (Attofluor Ratio Vision system). After 60 sec of baseline imaging, hyperforin (1 – 10 µM, 0.1% DMSO) was applied to the imaging chamber. DMSO (0.1%) had no effect on [Ca2+]I and was used as negative control. To deplete intracellular stores, cells were preincubated with the SERCA inhibitor thapsigargin (1 µM) for 30 min. To remove extracellular Ca2+, cells were first loaded with fura-2AM in normal HBSS (2 mM Ca2+), and then washed 3 times with Ca2+-free HBSS. After 60 sec of baseline, hyperforin (10 µM) was applied in Ca2+-free HBSS, and after additional 100 sec, normal HBSS (2 mM Ca2+) was re-introduced in the imaging chamber.
Statistical analysis
Data were analyzed using unpaired Student’s t test with Prism software package (GraphPad Software, Inc.; San Diego, CA). p < 0.05 was considered significant. Data are presented as mean ± standard error of the mean (SEM).
Results
Hyperforin modulates dendritic spine morphology in hippocampal CA1 and CA3 pyramidal neurons
We previously showed that hyperforin causes neurite growth in PC12 cells expressing TRPC6 (Leuner et al.2007; Leuner et al.2010). Considering that (i) BDNF modulates spine morphology in hippocampal pyramidal neurons [47], likely through the activation of Ca2+-permeable TRPC3 channels [34]; (ii) TRPC3 and TRPC6 form heteromultimeric non-selective cationic channels (Moran et al.2004; Venkatachalam et al.2007); and (iii) both TRPC6 channel knockout and overexpression modulate spine density in hippocampal neurons [50, 51], we tested weather activation of TRPC6 channels by hyperforin affects dendritic spines in hippocampal pyramidal neurons. Representative examples of dendritic segments of eYFP-expressing CA1 and CA3 pyramidal neurons in 8 div hippocampal slice cultures per treatment group used for quantitative spine analyses are shown in Figure 1 A and D, respectively.
Figure 1. Hyperforin modulates dendritic spine morphology in hippocampal CA1 and CA3 pyramidal neurons.
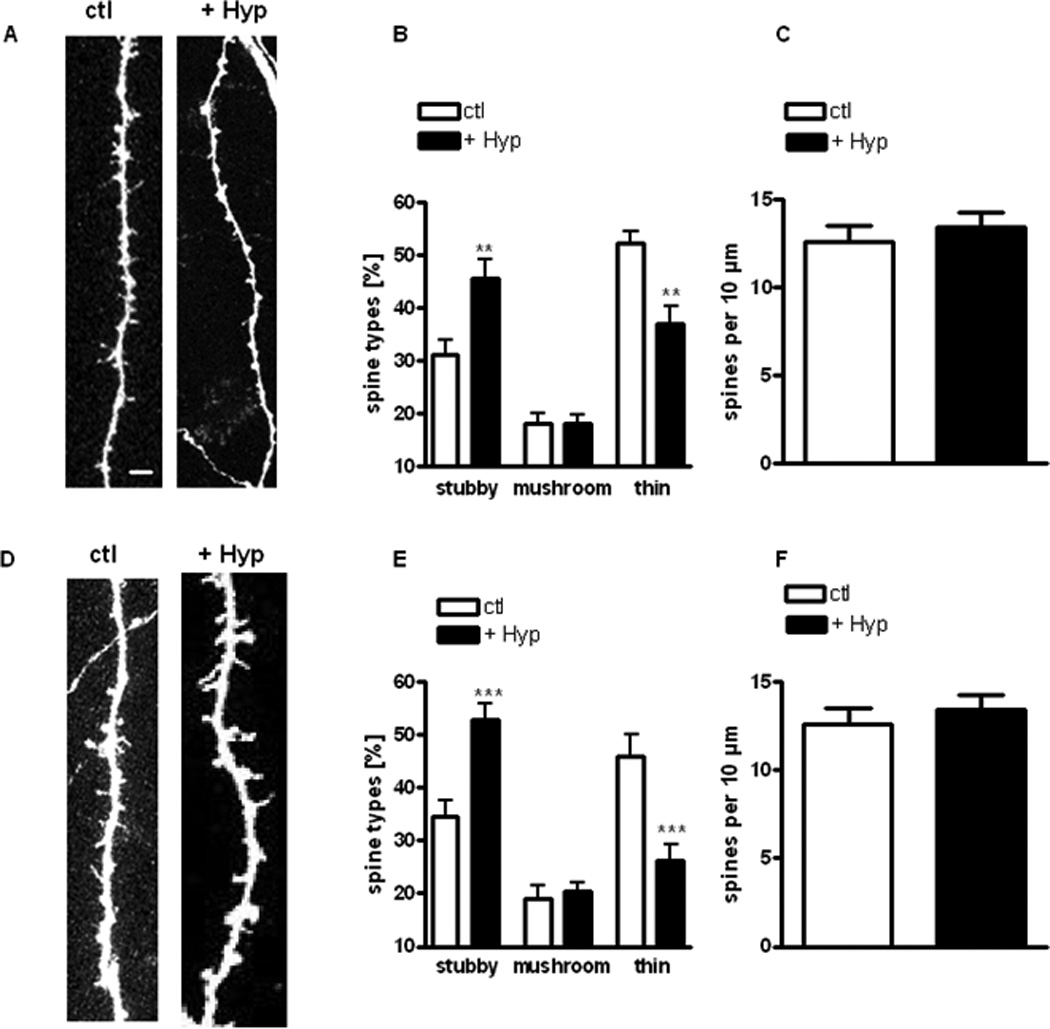
(A, D) Representative examples of maximum intensity projections of confocal z-stacks of apical dendrites of CA1 (A) and CA3 (D) pyramidal neurons (scale bar = 1 µm).
(B, E) Proportion of different spine types expressed as percentage of total spines in CA1 (B) neurons and CA3 (E) pyramidal neurons.
(C, F) Spine density expressed as number of spines per 10 µm of dendrite in CA1 (C) and CA3 (F) pyramidal neurons.
In this and all figures, data are expressed as mean ± SEM; *p<0.05, **p<0.01, ***p<0.005 compared with controls (unpaired Student’s t-test).
Hyperforin (0.3 µM, 24 hrs) significantly increased the proportion of mature stubby spines in CA1 pyramidal neurons compared to vehicle controls (hyperforin: 45.56 ± 3.48 %, n = 21 cells from 16 slices vs. Ctl: 31.11 ± 2.73 %, 12 cells/10 slices; p < 0.001; Fig. 1B). Similar results were observed in CA3 pyramidal neurons (hyperforin: 52.75 ± 3.01 %, 17 cells/12 slices vs. Ctl: 34.64 ± 2.92 %, 10 cells/10 slices; p < 0.001; Fig. 1E). In addition, hyperforin significantly decreased the proportion of immature thin spines in CA1 pyramidal neurons (hyperforin: 37.07 ± 3.24 %, 21 cells/16 slices vs. Ctl: 52.14 ± 2.23 %, 12 cells/10 slices; p < 0.001; Fig. 1B). Similar results were observed in CA3 pyramidal neurons (hyperforin: 26.36 ± 2.86 %, 17 cells/12 slices vs. Ctl: 45.87 ± 4.24 %, 10 cells/10 slices; p < 0.001; Fig. 1E). On the other hand, hyperforin did not affect mushroom spines in pyramidal neurons of neither CA1 (hyperforin: 18.07 ± 1.77 %, 21 cells/16 slices vs. Ctl: 18.03 ± 2.02 %, 12 cells/10 slices; p > 0.05) nor CA3 regions (hyperforin: 20.38 ± 1.83 %, 17 cells/12 slices vs. Ctl: 19.09 ± 2.31 %, 10 cells/10 slices; p > 0.05; Figs. 1B, 1E). In contrast, dendritic spine density was not affected by hyperforin, neither in CA1 (hyperforin: 10.51 ± 0.51 spines per 10 µm, 21 cells/16 slices vs. Ctl: 10.55 ± 1.01 spines/10 µm, 12 cells/10 slices; p > 0.05; Fig. 1C) nor in CA3 pyramidal neurons (hyperforin: 13.42 ± 0.86 spines/10 µm, 17 cells/12 slices vs. Ctl: 12.57 ± 0.94 spines/10 µm, 10 cells/10 slices; p > 0.05; Fig. 1F). Since the effects of hyperforin on CA1 and CA3 pyramidal neuron were not significantly different between them (p > 0.05), those data were pooled in the following experiments.
Functional TRPC6-containing channels are required for spine density maintenance and for hyperforin to modulate dendritic spine morphology
Knockdown of endogenous TRPC6 in PC12 cells with cDNA plasmids expressing small hairpin RNAs (shRNA) resulted in a 4-fold reduction in protein levels compared to a random shRNA, as evaluated by Western immunoblotting (Figure 2A). In pyramidal neurons of slice cultures transfected with TRPC6-specific shRNA3 (and eYFP for morphology) one day earlier, the TRPC6-specific shRNA showed lower spine density than those expressing a random shRNA (shRNA3: 7.54 ± 0.54 spines/10 µm, 12 cells/10 slices vs. Ctl 10.55 ± 1.01 spines/10 µm, 15 cells/10 slices; p < 0.05; Fig. 2B, D). On the other hand, TRPC6-knockdown did not affect the proportion of morphological types of spines (shRNA3: stubby spines 41.21 ± 4.82 %, mushroom spines 16.95 ± 2.47 %, thin spines 41.84 ± 3.44 %; 11 cells/10 slices vs. Ctl: stubby spines 32.34 ± 2.38 %, mushroom spines 18.71 ± 1.78 %, thin spines 48.26 ± 2.96 %, 15 cells/10 slices; p > 0.05; Fig. 2B, C).
Figure 2. TRPC6 channels are required for hyperforin to modulate dendritic spine morphology.
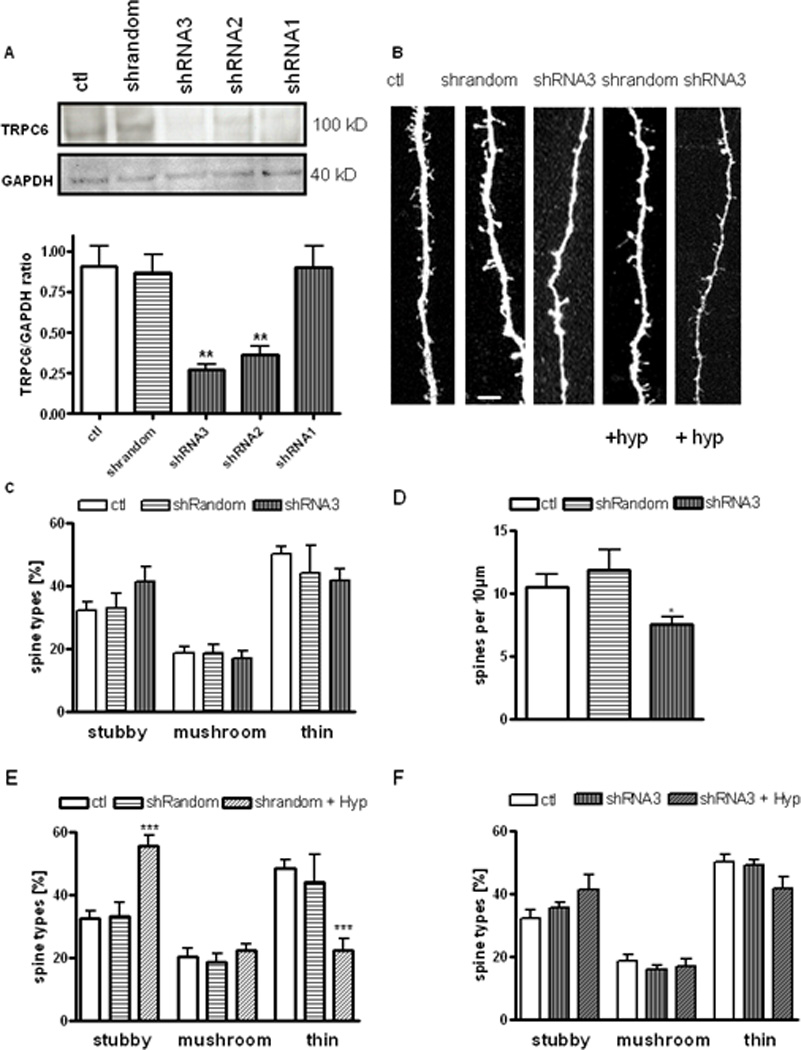
(A) TRPC6 knockdown in PC12 cells with cDNA plasmids expressing shRNAs. PC12 cells were transfected with cDNA plasmids expressing TRPC6-specific shRNAs (shRNA1, 2, 3) or random shRNA sequences. Membrane fractions were isolated 48 hrs later, and analyzed by Western blot analysis using anti-GAPDH and anti-TRPC6 antibodies. Mean optical density (OD) of bands as ratio of GAPDH levels: Ctl: 0.91 ± 0.12; random shRNA: 1.14 ± 0.38; shRNA3: 0.26 ± 0.03; shRNA2: 0.49 ± 0.12; shRNA1: 0.53 ± 0.09; n = 3 different Western blots.
(B) Representative examples of maximum intensity projections of confocal z-stacks of apical dendrites of pyramidal neurons (scale bar = 1 µm) expressing either shRNA random, TRPC6-specific shRNA3, and treated with hyperforin (0.3 µM).
(C) Proportion of different spine types expressed as percentage of total spines in pyramidal neurons expressing shRNA random, and TRPC6-specific shRNA3 compared to untransfected neurons.
(D) Spine density expressed as number of spines per 10 µm of dendrite of pyramidal neurons expressing shRNA random, and TRPC6-specific shRNA3 compared to untransfected neurons.
(E) Proportion of different spine types expressed as percentage of total spines in pyramidal neurons expressing shRNA random and TRPC6-specific shRNA3 treated with hyperforin (0.3 µM).
(F) Spine density expressed as numbers of spines per 10 µm of dendrite of pyramidal neurons expressing shRNA random, and TRPC6-specific shRNA3 treated with hyperforin (0.3 µM).
To evaluate of TRPC6 channels are necessary for hyperforin mediated spine morphology changes, the effects of hyperforin in shRNA3-expressing cells were investigated. Importantly, hyperforin (0.3 µM, 24 hrs) did not affect the proportions of dendritic spines (shRNA3 + hyperforin: stubby spines 34.58 ± 1.92 %, mushroom spines 15.60 ± 1.33 %, thin spines 50.50 ± 2.02%, 20 cells/15 slices vs. Ctl: stubby spines 32.34 ± 2.38 %, mushroom spines 20.43 ± 2.38 %, thin spines 48.26 ± 2.96 %, 15 cells/10 slices; p > 0.05; Fig. 2B, E). This effect was specific because the random shRNA that failed to affect TRPC6 protein levels did not prevent the effect of hyperforin on spine morphology (random shRNA + hyperforin: stubby spines 55.45 ± 3.54 %, mushroom spines 22.22 ± 2.15 %, thin spines 22.33 ± 3.68 %, 13 cells/10 slices vs. Ctl: stubby spines 32.34 ± 2.38 %, mushroom spines 20.43 ± 2.38 %, thin spines 48.26 ± 2.96 %, 15 cells/10 slices; p < 0.001; Fig. 2B, E). As in control neurons, dendritic spine density was not affected by hyperforin in neurons transfected with either shRNA plasmid (shRNA3 + hyperforin: 9.69 ± 0.90 spines/10 µm, 20 cells/15 slices; random shRNA + hyperforin: 11.42 ± 1.37 spines/10 µm, 13 cells/10 slices vs. Ctl: 11.39 ± 0.72 spines/10 µm, 15 cells/10 slices; p > 0.05; Fig. 2B, F).
Not only proper TRPC6 expression levels, but also functional TRPC6 channels were required for TRPC6 mediated decrease in spine density and hyperforin-induced changes in spine morphology. A TRPC6 dominant negative mutant reduced spine density (TRPCdn 7.16 ± 1.03 spines/10 µm, 11 cells/10 slices vs. Ctl: 10.55 ± 1.01 spines/10 µm, 15 cells/10 slices; p < 0.05; Fig. 3A, C) but did not affect the proportion of morphological types of spines (TRPC6dn: stubby spines 34.93 ± 5.43 %, mushroom spines 14.46 ± 1.98 %, thin spines 50.23 ± 4.39 %, 11 cells/10 slices vs. Ctl: stubby spines 32.34 ± 2.38 %, mushroom spines 18.71 ± 1.78 % thin spines 48.26 ± 2.96 %, 15 cells/10 slices; p > 0.05; Fig. 3A, B).
Figure 3. Overexpression of functional TRPC6 mimics the effect of hyperforin on spine morphology, while TRPC6dn reduces spine density without affecting their morphology and inhibits hyperforin mediated spine morphology changes.
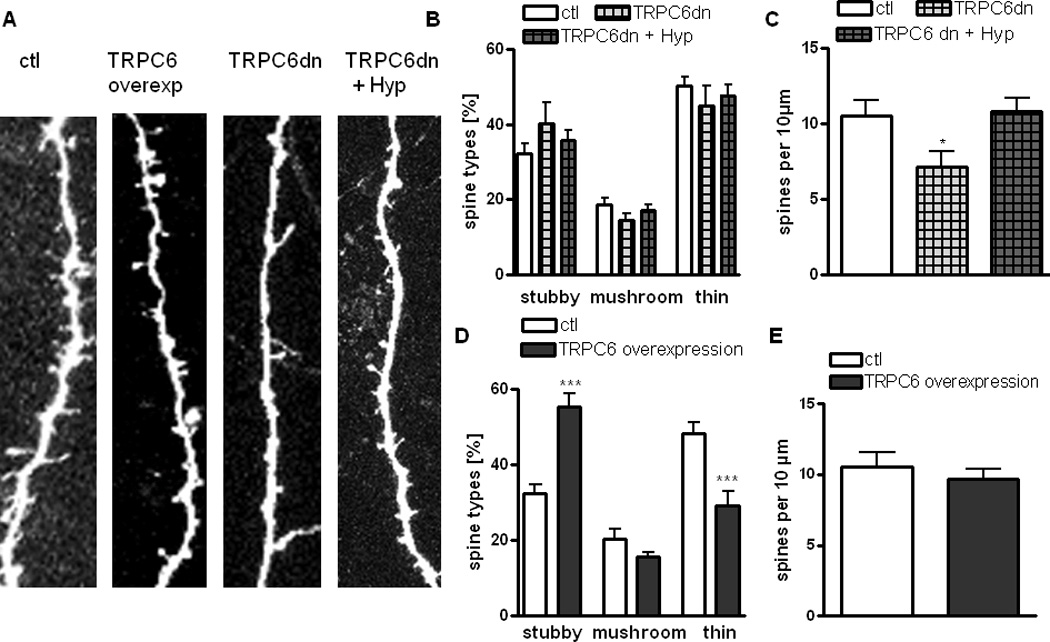
(A) Representative examples of maximum intensity projections of confocal z-stacks of apical dendrites of pyramidal neurons (scale bar = 1 µm) overexpressing TRPC6, TRPC6 dn and TRPC6dn treated with hyperforin.
(B) Proportion of different spine types expressed as percentage of total spines in pyramidal neurons expressing TRPC6dn in the presence or absence of hyperforin (0.3 µM) compared to untransfected controls.
(C) Spine density expressed as number of spines per 10 µm of dendrite of pyramidal neurons expressing TRPC6dn in the presence or absence of hyperforin (0.3 µM) compared to untransfected controls.
(D) Proportion of different spine types expressed as percentage of total spines in pyramidal neurons overexpressing TRPC6 channels compared with untransfected controls.
(E) Average spine density per 10 µm in pyramidal neurons overexpressing TRPC6 channels compared to untransfected controls.
As observed with shRNA3 mediated knockdown of TRPC6, overexpression of a pore-dead dominant-negative mutant (TRPC6dn) completely prevented the changes in the proportion of spine types induced by hyperforin (TRPC6dn + hyperforin: stubby spines 35.67 ± 2.73 %, mushroom spines 17.09 ± 1.42, thin spines 47.75 ± 2.81 %, 21 cells/16 slices vs. Ctl: stubby spines 32.34 ± 2.38 %, mushroom spines 20.43 ± 2.38 %, thin spines 48.26 ± 2.96 %, 15 cells/10 slices; p > 0.05; Fig. 3A, C).
Overexpression of functional TRPC6 mimics the effect of hyperforin on spine morphology
To further characterize the role of TRPC6-containing channels on dendritic spine density and morphology in hippocampal pyramidal neurons, we overexpressed wildtype functional TRPC6 in organotypic cultures of postnatal slices. Reminiscent of the effects of hyperforin, TRPC6 overexpression increased the proportion of stubby spines (TRPC6 overexpression: stubby spines 55.34 ± 3.48 %, 21 cells/15 slices vs. Ctl: stubby spines 32.34 ± 2.38 %, 15 cells/10 slices; p < 0.001; Fig. 3 A, D), while reducing that of thin spines (TRPC6 overexpression: thin spines 29.22 ± 3.79 %, 21 cells/15 slices vs. Ctl: thin spines 48.26 ± 2.96 %, 15 cells/10 slices; p < 0.001; Fig. 3 A, D). Again, no effects on mushroom spines were observed (TRPC6 overexpression: mushroom spines 15.43 ± 1.51 %, 21 cells/15 slices vs. Ctl: mushroom spines 20.43 ± 2.38 %, 15 cells/10 slices; p < 0.001; Fig. 3 A, D). On the other hand – and in contrast to observations in embryonic cultured neurons (Zhou et al.2008) and transgenic mice (Tai et al.2008) – we found that dendritic spine density in pyramidal neurons of hippocampal organotypic slice cultures was not affected by TRPC6 overexpression (TRPC6 overexpression: 9.66 ± 0.76 spines/10 µm, 21 cells/15 slices vs. Ctl: 10.55 ± 1.01 spines/10 µm, 15 cells/10 slices; p > 0.05; Fig. 3E).
Hyperforin does not affect dendritic length or branching
Considering that TRPC6 overexpression also affected apical dendritic length in hippocampal neurons in dissociated culture and in vivo (Tai et al.2008), we tested the effect of hyperforin on dendritic complexity and length in organotypic cultures of postnatal slices. Three-dimensional Sholl analyses of confocal z-stacks from apical dendrites of eYFP-expressing CA1 pyramidal neurons revealed that hyperforin (0.3 µM, 24 hrs) did not affect total length or branching point number compared to vehicle-treated controls (dendritic length: hyperforin 3015 ± 458.6 µm, 9 cells/9 slices vs. Ctl: 2765 ± 209.4 µm, 11 cells/11 slices; p > 0.05; branch points: hyperforin 17.22 ± 3.23 nodes, 9 cells/9 slices vs. Ctl: 15.55 ± 2.17 nodes, 11 cells/11 slices; p > 0.05; Fig. 4 A–D). Similar results were obtained in CA3 pyramidal neurons (dendritic length: hyperforin 3574 ± 241.1 µm, 11 cells/8 slices vs. Ctl: 3555 ± 256.6 µm, 7 cells/7 slices; p > 0.05; branching points: hyperforin 24.91 ± 2.44 nodes, 11 cells/8 slices vs. Ctl: 22.25 ± 3.79 nodes, 7 cells/7 slices; p > 0.05; Fig. 4 E–H). Thus, the effect of TRPC6 activation by hyperforin is selective for the morphology of dendritic spines in hippocampal pyramidal neurons.
Figure 4. Hyperforin does not affect the total length or branch points of apical dendrites of CA1 and CA3 pyramidal neurons.
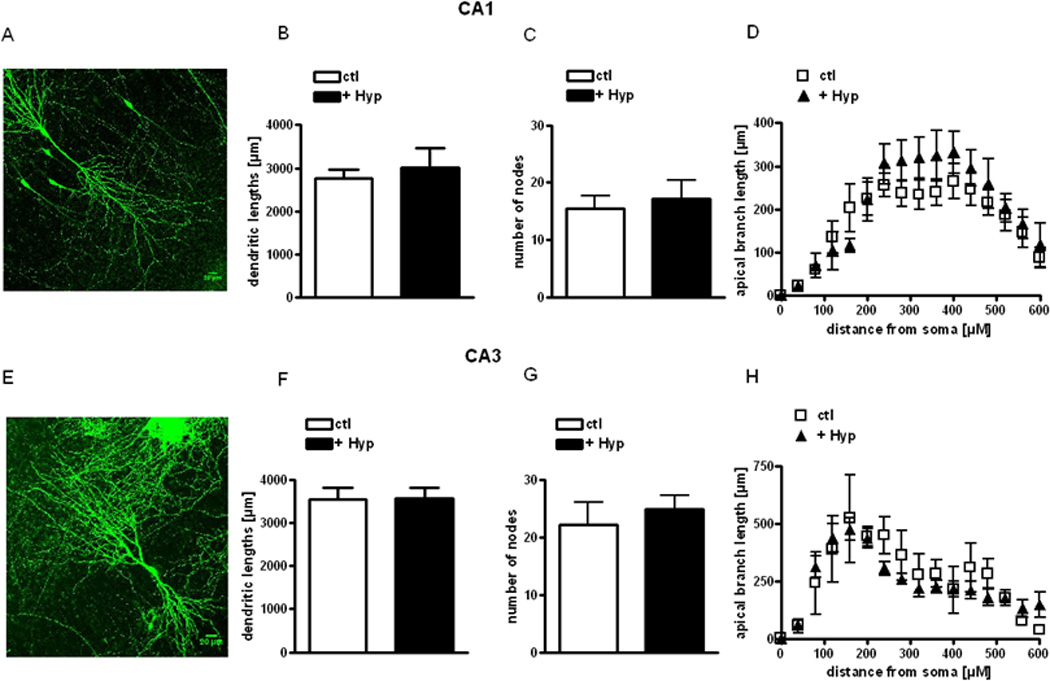
(A, E) Representative images of CA1 (A) and CA3 neurons (E) used for 3-dimensional Sholl analyses.
(B, C, D, F, G, H) Total dendritic length, number of branch points (nodes) and branch length as a function of distance from the soma were obtained from 3-dimensional Sholl analysis of confocal images of apical dendrites from eYFP-expressing CA1 (B, C, D) and CA3 pyramidal neurons (F, G, H).
Hyperforin evokes intracellular Ca2+ transients in hippocampal pyramidal neurons that represent Ca2+ influx through La3+-sensitive membrane channels
We previously showed that hyperforin caused intracellular Ca2+ elevations in PC12 cells expressing only TRPC6, but not other TRPC channel subunits (Leuner et al.2007; Leuner et al.2010). Hyperforin also induced Ca2+ transients in dissociated primary cultures of embryonic cortical neurons through channels displaying TRPC6-like properties (Tu et al.2009). Here, we show that hyperforin increased intracellular Ca2+ concentration ([Ca2+]i) in primary hippocampal neurons in a concentration-dependent manner (hyperforin: 0.3 µM Δ fura-2 ratio 0.20 ± 0.07; 1 µM Δ fura-2 ratio 0.23 ± 0.02; 3 µM Δ fura-2 ratio 0.55 ± 0.85; 10 µM Δ fura-2 ratio 0.59 ± 0.11; 8 coverslips/10–15 cells per measurement; Fig. 5 A, C). Hyperforin-induced [Ca2+]i transients represented Ca2+ influx exclusively, because they were absent in Ca2+-free media: in the continued presence of hyperforin, [Ca2+]i rose immediately after switching from Ca2+-free to Ca2+-containing media (Fig. 5 D). Consistent with this lack of contribution of intracellular Ca2+ stores, their depletion with the SERCA pump inhibitor thapsigargin (1 µM) did not affect hyperforin-induced [Ca2+]i transients (10 µM hyperforin: Δ fura-2 ratio 0.43 ± 0.06 vs. hyperforin + thapsigargin: Δ fura-2 ratio 0.44 ± 0.08, 8 coverslips/10–15 cells per measurement; p > 0.05; Fig. 5 E). On the other hand, the TRPC channel blocker La3+ (100 µM) significantly reduced hyperforin-induced [Ca2+]i transients (10 µM hyperforin: Δ fura-2 ratio 0.63 ± 0.06 vs. hyperforin + La3+ Δ fura-2 ratio 0.19 ± 0.06, 6 coverslips/10–15 cells per measurement; p < 0.01; Fig. 5 F).
Figure 5. Hyperforin evokes intracellular Ca2+ transients through La3+-sensitive membrane channels.
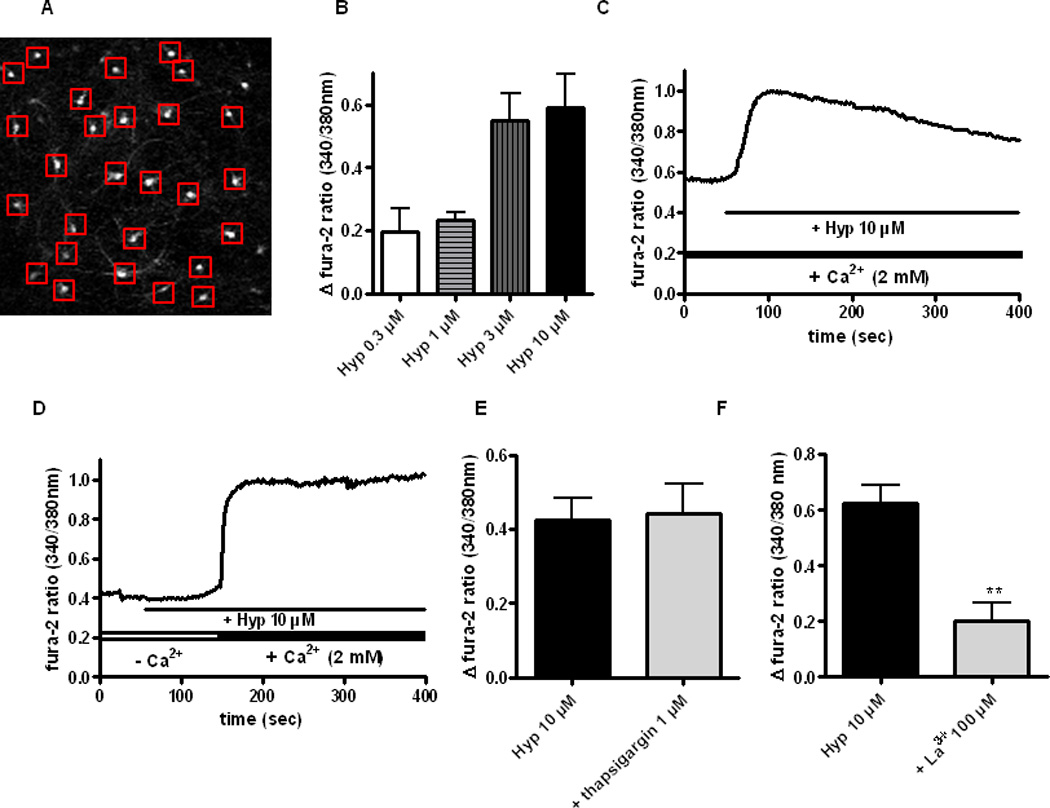
(A) Concentration-dependent effect of hyperforin on intracellular Ca2+ concentration in primary hippocampal neurons (0.3, 1, 3, 10 µM), assessed by fura-2 imaging.
(B) Representative field of cultured hippocampal neurons labeled with fura-2AM (5 µM).
(C) Representative example of hyperforin-induced [Ca2+]i elevation in the presence of extracellular calcium (2 mM).
(D) Representative example of hyperforin effects in the absence and presence of extracellular Ca2+ (2 mM). Note the lack of effect in Ca2+-free medium, and that the fura-2 ratio rose immediately upon reintroduction of extracellular Ca2+.
(E) Hyperforin increased intracellular Ca2+ levels in neurons pre-treated (30min) with the SERCA pump inhibitor thapsigargin (1 µM).
(F) The TRPC channel blocker La3+ prevented hyperforin-induced [Ca2+]i elevations.
Hyperforin induces La3+-sensitive inward currents in hippocampal pyramidal neurons and enhances miniature synaptic transmission
Finally, we tested the effects of hyperforin and Hyp2, a more chemically stable derivative (Leuner et al. 2010) on membrane currents and intracellular Ca2+ levels in voltage-clamped fura-2 loaded CA3 pyramidal neurons in acute hippocampal slices from wildtype mice. A single 30-sec application of Hyp2 in the presence of TTX (500nM) induced a slowly developing inward current at −65mV with an average amplitude of 51.3 ± 9.52 pA that was accompanied by a similarly slow Ca2+ elevation (fura-2 ratio 0.42 ± 0.10; 8 cells; Fig6A, C); DMSO vehicle did not affect membrane current and intracellular Ca2+ levels (5 cells; Fig. 6A, B). Consistent with our observations in PC12 cells (Leuner et al.2007; Leuner et al.2010), inward currents evoked by hyperforin in pyramidal neuorns in hippocampal slices were significantly reduced by the TRPC channel blocker La3+ (100 µM; 19.2%; 4 cells; p < 0.05).
Figure 6. Hyp2 induces membrane currents associated with Ca2+ elevations in hippocampal pyramidal neurons, as well as enhanced quantal transmitter release.
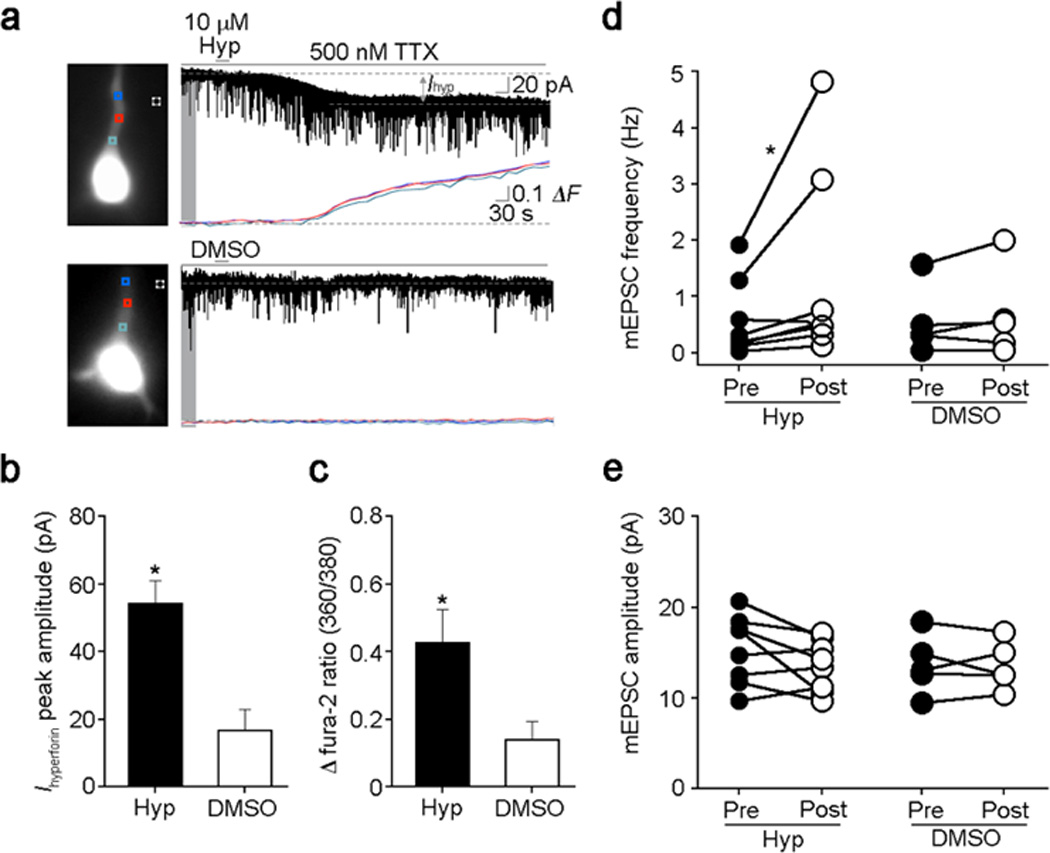
(A) Representative example of Hyp2-induced inward current and Ca2+ elevation in voltage-clamped fura-2-loaded CA3 pyramidal neurons (Vh: −65 mV; Cs-gluconate pipette; aCSF containing 500 nM TTX). Vehicle DMSO did not affect membrane conductance and Ca2+ levels.
(B) Average amplitude of Hyp2-induced inward currents (n=8 cells) compared to DMSO controls (n=5 cells); p < 0.05 Mann-Whitney U-test.
(C) Average increase in fura-2 ratio after Hyp2 application (n=8 cells) compared to DMSO controls (n=5 cells); p < 0.05 Mann-Whitney U-test.
(D) Hyp2-induced increase in mEPSC frequency (n=8 cells) compared to DMSO controls (n=5 cells); p < 0.05 Wilcoxon signed ranked test.
(E) Hyp2 did not affect mEPSC amplitude (n=8 cells) compared to DMSO controls (n=5 cells); p > 0.05 Wilcoxon signed ranked test.
In addition to the above postsynaptic responses, Hyp2 increased the frequency of miniature excitatory postsynaptic currents (mEPCSs) from a baseline of 0.56 ± 0.24 Hz to 1.32 ± 0.59 Hz (8 cells, p < 0.05; Fig. 6D), without affecting their amplitude (baseline: 15.61 ± 1.24 pA vs. Hyp2 13.95 ± 0.93 pA, 8 cells, p > 0.05; Fig.6 E) or the kinetics of individual events. DMSO vehicle did not affect mEPSC frequency, amplitude or individual kinetics (5 cells; Fig. 6A, B). These observations suggest that Hyp2 activates Ca2+-permeable TRPC6 channels located in presynaptic terminals causing enhanced quantal release by membrane depolarization, intracellular Ca2+-elevation, or both.
Taken altogether, we show that hyperforin and Hyp2 activate TRPC6-containing channels in hippocampal pyramidal neurons, causing membrane depolarization, Ca2+ influx, enhanced quantal transmitter release, and modulating dendritic spine morphology, all effects reminiscent to those of the neurotrophin BDNF through the activation of TRPC3-containing channels (Tyler and Pozzo-Miller 2001, 2003; Alonso et al. 2004; Amaral and Pozzo-Miller 2007a, 2007b; MDA, LP-M submitted).
Discussion
We described here several novel findings regarding the role of TRPC6 channels in hippocampal pyramidal neurons. First, the TRPC6 activator hyperforin modified dendritic spine morphology, changing the proportions of dendritic spine types: hyperforin increased mature stubby spines and decreased immature thin spines. This effect is completely mediated by TRPC6 channels because shRNA-mediated knockdown or expression a pore-dead TRPC6dn mutant abolished the effect of hyperforin on dendritic spine morphology. Second, TRPC6 channels are critical for maintaining spine density and morphology because TRPC6 overexpression affected spine morphology like hyperforin did. Intriguingly, TRPC6 knockdown or expression a pore-dead TRPC6dn reduced spine density without affecting their morphology. Third, hyperforin increased intracellular Ca2+ levels in cultured hippocampal neurons and activated slowly developing membrane currents and Ca2+ elevations in pyramidal neurons in acute and cultured hippocampal slices as it does in PC12 cells (Leuner et al.2007; Leuner et al.2010). Lastly, hyperforin increased quantal neurotransmitter release through a presynaptic mechanism. All these effects resemble the actions of BDNF through the activation of TRPC3 channels (Tyler and Pozzo-Miller 2001, 2003; Alonso et al. 2004; Amaral and Pozzo-Miller 2007a, 2007b; MDA, LP-M submitted).
Dendritic spines are structures highly sensitive to neuronal activity and the ensuing intracellular Ca2+ elevations, and their morphology is thought to be relevant for synaptic plasticity (Segal 2010). For example, thin-type spines with narrow and long heads are rather unstable because their necks may act as a barrier to transmit synaptic currents to the parent dendrite (Segal2010; Segal et al.2010). On the other hand, stubby-type spines are thought to contribute to more coordinate and widespread Ca2+ transients along their parent dendrites, synchronizing Ca2+ signaling among neighboring spines thus promoting synaptic plasticity (Tyler and Pozzo-Miller 2003). Intriguingly, not only hyperforin-mediated TRPC6 activation and BDNF-induced TRPC3 activation modulate dendritic spine morphology, but also chronic treatment with classical antidepressants does (Ampuero et al.2010; Marchetti et al.2010). However, the mechanisms involved are completely different. Classical antidepressants inhibit serotonin and norepinephrine transporters, thus enhancing their extracellular levels and receptor-mediated cyclic adenosine monophosphate (cAMP) intracellular signaling leading to CREB phosphorylation and increased BDNF expression. In this view, neuroplastic changes induced by BDNF are considered the final action of classical antidepressants (Pittenger et al.2008).
Until recently, the enhancement of hippocampal neurogenesis by classical antidepressants was considered to be the most relevant neurotrophic effect (Santarelli et al.2003). However, classical antidepressants only seem to increase neurogenesis in young rodents but not in older animals (Couillard-Despres et al.2009; Cowen et al.2008), which led to the conclusion that the therapeutic effects of antidepressants in elderly patients are probably not mediated by modulation of neurogenesis. In contrast, dendritic spine and synapse formation as well as changes in the morphology of existing dendritic spines and synapses still occur during aging. However, little is known about the effects of classical antidepressants on dendritic spine density and morphology. A recent study reported that the tricyclic antidepressant imipramine increased the number of excitatory spine synapses via the inhibition of serotonin and norepinephrine uptake (Chen et al.2008). In addition, inescapable footshock – a behavioral model for depression – caused spine synapse loss in hippocampal neurons (Hajszan et al.2009). Furthermore, chronic treatment with the SSRI fluoxetine (Ampuero et al.2010), or subchronic treatment with imipramine and rolipram (Marchetti et al.2010) increased stubby spines and decreased thin spines; however, these morphological changes were only observed after chronic (4 weeks) or subchronic (4 days) treatments. In contrast, hyperforin or BDNF modulate spine morphology in a much faster time scale (24 hrs in vitro), likely because of a direct mechanism of action.
The consequences of shRNA-mediated TRPC6 knockdown or expression of the pore-dead TRPC6dn mutant on dendritic spines of pyramidal neurons in organotypic slice cultures of postnatal hippocampal slices reported here are consistent with RNAi-mediated knockdown in dissociated cultures of embryonic hippocampal neurons (Tai et al.2008; Zhou et al.2008). In contrast to those studies however, we found no changes on dendritic length and branching. This apparent discrepancy may arise from differences between developmental ages (P7–11 slices vs. E18 dissociated neurons) and neuronal activity levels in the different preparations (organotypic slice cultures vs. dissociated cultures).
The role attributed to TRPC3 channels as mediators of the BDNF effect on dendritic spines in hippocampal neurons (Amaral and Pozzo-Miller 2007a, 2007b) may not be exclusive, because TRPC3 and TRPC6 are known to form heteromultimeric non-selective cationic channels (Moran et al.2004; Venkatachalam et al.2007). In addition, both TRPC3 and TRPC6 prevent cell death induced by serum deprivation in cerebellar granule neurons (Jia et al.2007). Furthermore, both TRPC3 and TRPC6 channels mediate BDNF-induced Ca2+ elevations in growth cones (Li et al.2005). In PC12 cells, the hyperforin mediated intracellular calcium increase was only mediated by influx of extracellular calcium via TRPC6 channels. Recently,Tu et al. (2009) reported that hyperforin also induced calcium release from mitochondria in cortical neurons.
Taken together, our findings suggest that hyperforin acts as a “BDNF mimetic” on hippocampal pyramidal neurons through the activation of Ca2+-permeable TRPC6-containing channels. These actions might be of special interest because hyperforin is the active constituent of St John’s wort extract, which has been used to treat mild to moderate depression for centuries (Linde et al.2005; Linde et al.2008).
Acknowledgements
We thank Dr. Willmar Schwabe for the supply of hyperforin. Supported by NIH-NINDS grants NS40593 and NS-065027 (LP-M). We also thank the instrumentation available in the UAB Intellectual and Developmental Disabilities Research Center (P30-HD38985), and the UAB Neuroscience and Blueprint Cores (P30-NS47466, P30-NS57098).
References
- Alonso M, Medina JH, Pozzo-Miller L. ERK1/2 activation is necessary for BDNF to increase dendritic spine density in hippocampal CA1 pyramidal neurons. Learn Mem. 2004;11:172–178. doi: 10.1101/lm.67804. [DOI] [PMC free article] [PubMed] [Google Scholar]
- Alvarez VA, Sabatini BL. Anatomical and physiological plasticity of dendritic spines. Annu Rev Neurosci. 2007;30:79–97. doi: 10.1146/annurev.neuro.30.051606.094222. [DOI] [PubMed] [Google Scholar]
- Amaral MD, Pozzo-Miller L. BDNF induces calcium elevations associated with I-BDNF, a nonselective cationic current mediated by TRPC channels. J Neurophysiol. 2007a;98:2476–2482. doi: 10.1152/jn.00797.2007. [DOI] [PMC free article] [PubMed] [Google Scholar]
- Amaral MD, Pozzo-Miller L. TRPC3 channels are necessary for brain-derived neurotrophic factor to activate a nonselective cationic current and to induce dendritic spine formation. J Neurosci. 2007b;27:5179–5189. doi: 10.1523/JNEUROSCI.5499-06.2007. [DOI] [PMC free article] [PubMed] [Google Scholar]
- Ampuero A, Rubio F, Sandoval M, Diaz-Veliz G, Gonzales R, Earle N, Dagnino-Subiarbe A, Aboitiz F, Orrego F, Wyneken U. Chronic fluoxetine treatment induces structural plasticity and selective changes in glutamate receptor subunits in the rat cerebral cortex. Neuroscience. 2010;169:98–108. doi: 10.1016/j.neuroscience.2010.04.035. [DOI] [PubMed] [Google Scholar]
- Boldrini M, Underwood MD, Hen R, Rosoklija GB, Dwork AJ, Mann JJ, Arango V. Antidepressants increase neural progenitor cells in the human hippocampus. Neuropsychopharmacology. 2009;34:2376–2389. doi: 10.1038/npp.2009.75. [DOI] [PMC free article] [PubMed] [Google Scholar]
- Castren E, Voikar V, Rantamaki T. Role of neurotrophic factors in depression. Curr Opin Pharmacol. 2007;7:18–21. doi: 10.1016/j.coph.2006.08.009. [DOI] [PubMed] [Google Scholar]
- Chapleau CA, Calfa GD, Lane MC, Albertson AJ, Larimore JL, Kudo S, Armstrong DL, Percy AK, Pozzo-Miller L. Dendritic spine pathologies in hippocampal pyramidal neurons from Rett syndrome brain and after expression of Rett-associated MECP2 mutations. Neurobiol Dis. 2009;35:219–233. doi: 10.1016/j.nbd.2009.05.001. [DOI] [PMC free article] [PubMed] [Google Scholar]
- Chen F, Madsen TM, Wegener G, Nyengaard JR. Changes in rat hippocampal CA1 synapses following imipramine treatment. Hippocampus. 2008;18:631–639. doi: 10.1002/hipo.20423. [DOI] [PubMed] [Google Scholar]
- Couillard-Despres S, Wuertinger C, Kandasamy M, Caioni M, Stadler K, Aigner R, Bogdahn U, Aigner L. Ageing abolishes the effects of fluoxetine on neurogenesis. Mol Psychiatry. 2009;14:856–864. doi: 10.1038/mp.2008.147. [DOI] [PubMed] [Google Scholar]
- Cowen DS, Takase LF, Fornal CA, Jacobs BL. Age-dependent decline in hippocampal neurogenesis is not altered by chronic treatment with fluoxetine. Brain Res. 2008;1228:14–19. doi: 10.1016/j.brainres.2008.06.059. [DOI] [PubMed] [Google Scholar]
- D'Sa C, Duman RS. Antidepressants and neuroplasticity. Bipolar Disord. 2002;4:183–194. doi: 10.1034/j.1399-5618.2002.01203.x. [DOI] [PubMed] [Google Scholar]
- Duman RS. Pathophysiology of depression: the concept of synaptic plasticity. Eur Psychiatry. 2002;17:306S–310S. doi: 10.1016/s0924-9338(02)00654-5. [DOI] [PubMed] [Google Scholar]
- Duman RS. Role of neurotrophic factors in the etiology and treatment of mood disorders. Neuromolecular Med. 2004;5:11–25. doi: 10.1385/NMM:5:1:011. [DOI] [PubMed] [Google Scholar]
- Dwivedi Y, Rizavi HS, Conley RR, Roberts RC, Tamminga CA, Pandey GN. Altered gene expression of brain-derived neurotrophic factor and receptor tyrosine kinase B in postmortem brain of suicide subjects. Arch Gen Psychiatry. 2003;60:804–815. doi: 10.1001/archpsyc.60.8.804. [DOI] [PubMed] [Google Scholar]
- Gahwiler BH. Organotypic monolayer cultures of nervous tissue. J Neurosci Methods. 1981;4:329–342. doi: 10.1016/0165-0270(81)90003-0. [DOI] [PubMed] [Google Scholar]
- Hajszan T, Dow A, Warner-Schmidt JL, Szigeti-Buck K, Sallam NL, Parducz A, Leranth C, Duman RS. Remodeling of hippocampal spine synapses in the rat learned helplessness model of depression. Biol Psychiatry. 2009;65:392–400. doi: 10.1016/j.biopsych.2008.09.031. [DOI] [PMC free article] [PubMed] [Google Scholar]
- Hajszan T, MacLusky NJ, Leranth C. Short-term treatment with the antidepressant fluoxetine triggers pyramidal dendritic spine synapse formation in rat hippocampus. Eur J Neurosci. 2005;21:1299–1303. doi: 10.1111/j.1460-9568.2005.03968.x. [DOI] [PubMed] [Google Scholar]
- Harris KM, Jensen FE, Tsao B. 3-Dimensional Structure of Dendritic Spines and Synapses in Rat Hippocampus (CA1) at Postnatal Day-15 and Adult Ages - Implications for the Maturation of Synaptic Physiology and Long-Term Potentiation. J Neurosci. 1992;12:2685–2705. doi: 10.1523/JNEUROSCI.12-07-02685.1992. [DOI] [PMC free article] [PubMed] [Google Scholar]
- Hofmann T, Obukhov AG, Schaefer M, Harteneck C, Gudermann T, Schultz G. Direct activation of human TRPC6 and TRPC3 channels by diacylglycerol. Nature. 1999;397:259–263. doi: 10.1038/16711. [DOI] [PubMed] [Google Scholar]
- Jia YC, Zhou J, Tai YL, Wang YZ. TRPC channels promote cerebellar granule neuron survival. Nat Neurosci. 2007;10:559–567. doi: 10.1038/nn1870. [DOI] [PubMed] [Google Scholar]
- Kasai H, Matsuzaki M, Noguchi J, Yasumatsu N, Nakahara H. Structure-stability-function relationships of dendritic spines. Trends Neurosci. 2003;26:360–368. doi: 10.1016/S0166-2236(03)00162-0. [DOI] [PubMed] [Google Scholar]
- Koh IYY, Lindquist WB, Zito K, Nimchinsky EA, Svoboda K. An image analysis algorithm for dendritic spines. Neural Comput. 2002;14:1283–1310. doi: 10.1162/089976602753712945. [DOI] [PubMed] [Google Scholar]
- Leuner K, Heiser JH, Derksen S, Mladenov MI, Fehske CJ, Schubert R, Gollasch M, Schneider G, Harteneck C, Chatterjee SS, Müller WE. Simple 2,4-Diacylphloroglucinols as Classic Transient Receptor Potential-6 Activators-Identification of a Novel Pharmacophore. Mol Pharmacol. 2010;77:368–377. doi: 10.1124/mol.109.057513. [DOI] [PubMed] [Google Scholar]
- Leuner K, Kazanski V, Müller M, Essin K, Henke B, Gollasch M, Harteneck C, Müller WE. Hyperforin a key constituent of St. John's wort specifically activates TRPC6 channels. FASEB J. 2007;21:4101–4111. doi: 10.1096/fj.07-8110com. [DOI] [PubMed] [Google Scholar]
- Li HS, Xu XZ, Montell C. Activation of a TRPC3-dependent cation current through the neurotrophin BDNF. Neuron. 1999;24:261–273. doi: 10.1016/s0896-6273(00)80838-7. [DOI] [PubMed] [Google Scholar]
- Li Y, Calfa G, Inoue T, Amaral MD, Pozzo-Miller L. Activity-Dependent Release of Endogenous BDNF From Mossy Fibers Evokes a TRPC3 Current and Ca2+ Elevations in CA3 Pyramidal Neurons. J Neurophysiol. 2010;103:2846–2856. doi: 10.1152/jn.01140.2009. [DOI] [PMC free article] [PubMed] [Google Scholar]
- Li Y, Jia YC, Cui K, Li N, Zheng ZY, Wang YZ, Yuan XB. Essential role of TRPC channels in the guidance of nerve growth cones by brain-derived neurotrophic factor. Nature. 2005;434:894–898. doi: 10.1038/nature03477. [DOI] [PubMed] [Google Scholar]
- Linde K, Berner M, Egger M, Mulrow C. St John's wort for depression: meta-analysis of randomised controlled trials. Br J Psychiatry. 2005;186:99–107. doi: 10.1192/bjp.186.2.99. [DOI] [PubMed] [Google Scholar]
- Linde K, Berner MM, Kriston L. St John's wort for major depression. Cochrane Database Syst Rev. 2008;4 doi: 10.1002/14651858.CD000448.pub3. CD000448. [DOI] [PMC free article] [PubMed] [Google Scholar]
- Lo DC, McAllister AK, Katz LC. Neuronal transfection in brain slices using particle-mediated gene transfer. Neuron. 1994;13:1263–1268. doi: 10.1016/0896-6273(94)90412-x. [DOI] [PubMed] [Google Scholar]
- MacMaster FP, Mirza Y, Szeszko PR, Kmiecik LE, Easter PC, Taormina SP, Lynch M, Rose M, Moore GJ, Rosenberg DR. Amygdala and hippocampal volumes in familial early onset major depressive disorder. Biol Psychiatry. 2008;63:385–390. doi: 10.1016/j.biopsych.2007.05.005. [DOI] [PMC free article] [PubMed] [Google Scholar]
- Malberg JE, Eisch AJ, Nestler EJ, Duman RS. Chronic antidepressant treatment increases neurogenesis in adult rat hippocampus. J Neurosci. 2000;20:9104–9110. doi: 10.1523/JNEUROSCI.20-24-09104.2000. [DOI] [PMC free article] [PubMed] [Google Scholar]
- Marchetti C, Tafi E, Middei S, Rubinacci MA, Restivo L, Ammassari-Teule M, Marie H. Synaptic adaptations of CA1 pyramidal neurons induced by a highly effective combinational antidepressant therapy. Biol Psychiatry. 2010;67:146–154. doi: 10.1016/j.biopsych.2009.09.017. [DOI] [PubMed] [Google Scholar]
- Mattson MP, Maudsley S, Martin B. BDNF and 5-HT: a dynamic duo in age-related neuronal plasticity and neurodegenerative disorders. Trends Neurosci. 2004;27:589–594. doi: 10.1016/j.tins.2004.08.001. [DOI] [PubMed] [Google Scholar]
- Montell C. TRP channels: Mediators of sensory signaling and roles in health and disease. Chem Senses. 2006;31:A45–A45. [Google Scholar]
- Moran MM, Xu H, Clapham DE. TRP ion channels in the nervous system. Curr Opin Neurobiol. 2004;14:362–369. doi: 10.1016/j.conb.2004.05.003. [DOI] [PubMed] [Google Scholar]
- Müller WE. Current St John's wort research from mode of action to clinical efficacy. Pharmacol Res. 2003;47:101–109. doi: 10.1016/s1043-6618(02)00266-9. [DOI] [PubMed] [Google Scholar]
- Müller WE, Singer A, Wonnemann M, Hafner U, Rolli M, Schafer C. Hyperforin represents the neurotransmitter reuptake inhibiting constituent of hypericum extract. Pharmacopsychiatry. 1998;31(Suppl: 1):16–21. doi: 10.1055/s-2007-979341. [DOI] [PubMed] [Google Scholar]
- Nakagawa S, Kim JE, Lee R, Malberg JE, Chen JS, Steffen C, Zhang YJ, Nestler EJ, Duman RS. Regulation of neurogenesis in adult mouse hippocampus by cAMP and the cAMP response element-binding protein. J Neurosci. 2002;22:3673–3682. doi: 10.1523/JNEUROSCI.22-09-03673.2002. [DOI] [PMC free article] [PubMed] [Google Scholar]
- O'Brien JT, Lloyd A, McKeith I, Gholkar A, Ferrier N. A longitudinal study of hippocampal volume, cortisol levels, and cognition in older depressed subjects. Am J Psychiatry. 2004;161:2081–2090. doi: 10.1176/appi.ajp.161.11.2081. [DOI] [PubMed] [Google Scholar]
- Peters A, Kaiserman-Abramof IR. The small pyramidal neuron of the rat cerebral cortex. The synapses upon dendritic spines. Z Zellforsch Mikrosk Anat. 1969;100:487–506. doi: 10.1007/BF00344370. [DOI] [PubMed] [Google Scholar]
- Pittenger C, Duman RS. Stress, depression, and neuroplasticity: A convergence of mechanisms. Neuropsychopharmacology. 2008;33:88–109. doi: 10.1038/sj.npp.1301574. [DOI] [PubMed] [Google Scholar]
- Pozzo Miller LD, Petrozzino JJ, Mahanty NK, Connor JA. Optical imaging of cytosolic calcium, electrophysiology, and ultrastructure in pyramidal neurons of organotypic slice cultures from rat hippocampus. Neuroimage. 1993;1:109–120. doi: 10.1006/nimg.1993.1004. [DOI] [PubMed] [Google Scholar]
- Santarelli L, Saxe M, Gross C, Surget A, Battaglia F, Dulawa S, Weisstaub N, Lee J, Duman R, Arancio O, Belzung C, Hen R. Requirement of hippocampal neurogenesis for the behavioral effects of antidepressants. Science. 2003;301:805–809. doi: 10.1126/science.1083328. [DOI] [PubMed] [Google Scholar]
- Segal M. Dendritic spines, synaptic plasticity and neuronal survival: activity shapes dendritic spines to enhance neuronal viability. Eur J Neurosci. 2010;31:2178–2184. doi: 10.1111/j.1460-9568.2010.07270.x. [DOI] [PubMed] [Google Scholar]
- Segal M, Vlachos A, Korkotian E. The Spine Apparatus, Synaptopodin, and Dendritic Spine Plasticity. Neuroscientist. 2010;16:125–131. doi: 10.1177/1073858409355829. [DOI] [PubMed] [Google Scholar]
- Sen S, Duman RS, Sanacora G. Meta-analysis of serum brain-derived neurotrophic factor (BDNF) levels in depression and antidepressant treatment. Biol Psychiatry. 2008;63:98S–98S. doi: 10.1016/j.biopsych.2008.05.005. [DOI] [PMC free article] [PubMed] [Google Scholar]
- Sheline YI, Sanghavi M, Mintun MA, Gado MH. Depression duration but not age predicts hippocampal volume loss in medically healthy women with recurrent major depression. J Neurosci. 1999;19:5034–5043. doi: 10.1523/JNEUROSCI.19-12-05034.1999. [DOI] [PMC free article] [PubMed] [Google Scholar]
- Singer A, Wonnemann M, Müller WE. Hyperforin, a major antidepressant constituent of St. John's Wort, inhibits serotonin uptake by elevating free intracellular Na+ J Pharmacol Exp Ther. 1999;290:1363–1368. [PubMed] [Google Scholar]
- Stoppini L, Buchs PA, Muller D. A simple method for organotypic cultures of nervous tissue. J Neurosci Methods. 1991;37:173–182. doi: 10.1016/0165-0270(91)90128-m. [DOI] [PubMed] [Google Scholar]
- Strübing C, Krapivinsky G, Krapivinsky L, Clapham DE. Formation of novel TRPC channels by complex subunit interactions in embryonic brain. J Biol Chem. 2003;278:39014–39019. doi: 10.1074/jbc.M306705200. [DOI] [PubMed] [Google Scholar]
- Tai Y, Feng S, Ge R, Du W, Zhang X, He Z, Wang Y. TRPC6 channels promote dendritic growth via the CaMKIV-CREB pathway. J Cell Sci. 2008;121:2304–2307. doi: 10.1242/jcs.026906. [DOI] [PubMed] [Google Scholar]
- Treiber K, Singer A, Henke B, Müller WE. Hyperforin activates nonselective cation channels (NSCCs) Br J Pharmacol. 2005;145:75–83. doi: 10.1038/sj.bjp.0706155. [DOI] [PMC free article] [PubMed] [Google Scholar]
- Tu P, Kunert-Keil C, Lucke S, Brinkmeier H, Bouron A. Diacylglycerol analogues activate second messenger-operated calcium channels exhibiting TRPC-like properties in cortical neurons. J Neurochem. 2009;108:126–138. doi: 10.1111/j.1471-4159.2008.05752.x. [DOI] [PubMed] [Google Scholar]
- Tyler WJ, Pozzo-Miller L. Miniature synaptic transmission and BDNF modulate dendritic spine growth and form in rat CA1 neurones. J Physiol. 2003;553:497–509. doi: 10.1113/jphysiol.2003.052639. [DOI] [PMC free article] [PubMed] [Google Scholar]
- Tyler WJ, Pozzo-Miller LD. BDNF enhances quantal neurotransmitter release and increases the number of docked vesicles at the active zones of hippocampal excitatory synapses. J Neurosci. 2001;21:4249–4258. doi: 10.1523/JNEUROSCI.21-12-04249.2001. [DOI] [PMC free article] [PubMed] [Google Scholar]
- Ustun TB, Ayuso-Mateos JL, Chatterji S, Mathers C, Murray CJL. Global burden of depressive disorders in the year 2000. Br J Psychiatry. 2004;184:386–392. doi: 10.1192/bjp.184.5.386. [DOI] [PubMed] [Google Scholar]
- Venkatachalam K, Montell C. TRP channels. Annu rev biochem. 2007;76:387–417. doi: 10.1146/annurev.biochem.75.103004.142819. [DOI] [PMC free article] [PubMed] [Google Scholar]
- Wonnemann M, Singer A, Müller WE. Inhibition of synaptosomal uptake of 3H-L-glutamate and 3H-GABA by hyperforin, a major constituent of St. John's Wort: the role of amiloride sensitive sodium conductive pathways. Neuropsychopharmacology. 2000;23:188–197. doi: 10.1016/S0893-133X(00)00102-0. [DOI] [PubMed] [Google Scholar]
- Yamamoto N, Kurotani T, Toyama K. Neural connections between the lateral geniculate nucleus and visual cortex in vitro. Science. 1989;245:192–194. doi: 10.1126/science.2749258. [DOI] [PubMed] [Google Scholar]
- Zhou J, Du W, Zhou K, Tai Y, Yao H, Jia Y, Ding Y, Wang Y. Critical role of TRPC6 channels in the formation of excitatory synapses. Nat Neurosci. 2008;11:741–743. doi: 10.1038/nn.2127. [DOI] [PubMed] [Google Scholar]