Abstract
The present study used an optical imaging paradigm to investigate plastic changes in the auditory cortex induced by fear conditioning, in which a sound (conditioned stimulus, CS) was paired with an electric foot-shock (unconditioned stimulus, US). We report that, after conditioning, auditory information could be retrieved on the basis of an electric foot-shock alone. Before conditioning, the auditory cortex showed no response to a foot-shock presented in the absence of sound. In contrast, after conditioning, the mere presentation of a foot-shock without any sound succeeded in eliciting activity in the auditory cortex. Additionally, the magnitude of the optical response in the auditory cortex correlated with variation in the electrocardiogram (correlation coefficient: −0.68). The area activated in the auditory cortex, in response to the electric foot-shock, statistically significantly had a larger cross-correlation value for tone response to the CS sound (12 kHz) compared to the non-CS sounds in normal conditioning group. These results suggest that integration of different sensory modalities in the auditory cortex was established by fear conditioning.
Keywords: Optical imaging, Voltage sensitive dye, Cross-modal, Plasticity, Acetylcholine
Introduction
Fear conditioning using sound and electric stimuli represents a common paradigm in research on emotional memory, and has also proved to be popular in the study of plasticity in the auditory cortex. Bakin and Weinberger (1990) reported that receptive fields in the auditory cortex are plastically changed by fear conditioning, and the best frequency strongly tunes to the frequency used for conditioning, if those frequencies are relatively close to one another. It is well established that the primary auditory cortex, and some other adjacent auditory fields, contain tonotopic maps, that is, systematic representations of acoustic frequency (e.g., reviewed in Read et al. 2002). Insofar as such maps are comprised of the preferential tuning of neurons across these fields, and frequency tuning is shifted during learning, it might be expected that the signal frequency would develop an expanded representation in the map during auditory fear conditioning. Such frequency-specific increase in representational area has been found in instrumental reward tasks involving training over months or weeks (Recanzone et al. 1993; Rutkowski and Weinberger 2005; Hui et al. 2009; Bieszczad and Weinberger 2010a, b; Ide et al. 2012).
Sensory cortices are defined by responses to physical stimuli in specific modalities. Recently, however, human neuroimaging studies have shown auditory cortex activation without sound (Kraemer et al. 2005; Zatorre and Halpern 2005; King 2006; Voisin et al. 2006), and it has been reported that auditory cortical neurons could be activated and/or modified by non-auditory stimulus (Fu et al. 2003; Brosch et al. 2005). Little is known about how the brain produces such activity. Here we study this topic with an entirely different paradigm, based on fear conditioning, using optical imaging with a voltage-sensitive dye in the guinea pig auditory cortex. Our data show that foot shocks alone, through conditioning, can activate the auditory cortex of guinea pigs in the absence of sound.
The traditional view that auditory cortex neurons are only activated by sound stimuli required revision when cross-modal activation was induced in the auditory cortex of monkey (Fu et al. 2003; Brosch et al. 2005). Fu et al. (2003) have found some neurons in caudomedial region of the macaque auditory cortex that could be activated by somatosensory stimulation, suggesting that there is a convergence of inputs from different sensory modalities at very early stages of cortical sensory processing. Moreover, Brosch et al. (2005) have observed acoustically responsive neurons whose firing was synchronized to the cue light or to the touch or release bar. These neurons were found in the primary auditory cortex and posterior belt areas of highly trained monkeys, suggesting that auditory cortex can be activated by visual and somatosensory stimulation and movements.
We reasoned that if auditory cortex activation can occur autonomously as a consequence of overlearning (e.g., a familiar song), then similar results might be obtained with nonhuman animals in a conditioning paradigm. To investigate effects of conditioning on auditory cortex activity, we used a fear-conditioning paradigm in guinea pigs, pairing pure tones with foot shocks. Fear conditioning (Galván and Weinberger 2002; Ide et al. 2012) and other behavioral and pharmacological paradigms (Ma and Suga 2005; Rutkowski and Weinberger 2005; Kacelnik et al. 2006) have induced plasticity in various aspects of mammalian auditory cortical representations, but the possibility of signals in the absence of sound, elicited through auditory fear conditioning, remained unexplored. To measure auditory cortex activity, we employed the optical imaging technique (Horikawa et al. 1996, 2001; Hosokawa et al. 2004; Ide et al. 2012), which registers electrophysiological activity of neuron populations at millisecond precision, by recording fluorescent signals from the cortical surface after the application of a voltage-sensitive dye.
In this work, to investigate whether auditory information could be retrieved by electric foot-shock after the conditioning or not, the auditory response to a foot-shock was investigated in three groups: normal conditioning, sham conditioning, and naïve.
Methods
Preparation
19 guinea pigs of 250–450 g, 3–6 weeks old females were used as experimental subjects. The body temperature of each animal was maintained at 37 °C by using a blanket system for animals (MK-900, Muromachi Kikai Co., LTD.) during the experiment. Each animal was anesthetized with a mixture of Ketamine (40 mg/kg, i.m.) and Xylazine (20 mg/kg, i.m.), and then anesthesia was maintained by supplementary doses of a mixture of Ketamine (20 mg/kg, i.m.) and Xylazine (10 mg/kg, i.m.). The trachea was cannulated and the head was clamped. The scalp was detached and a hole (approximately 8 by 8 mm square) was drilled in the left temporal bone and the dura and arachnoid membrane were removed. The auditory cortex was stained for 40–60 min with a voltage-sensitive dye, RH795 (0.125 mg/ml, dissolved in saline; molecular Probes). A piece of gelatin sponge soaked in a voltage-sensitive dye solution (with an amount of 0.1 ml) was placed on the cortical surface for staining. Then, the animal was artificially respirated after inducing paralysis with pancuronium bromide (0.2 mg/kg, i.m.). The experiments were carried out in a dark soundproof room. After the end of the experiment, each animal was administrated with an overdose of Nembutal, and cardiac arrest was monitored. All procedures were approved by the Tamagawa University Animal Care and Use Committee, and in accordance with its guidelines for animal care.
Fear conditioning
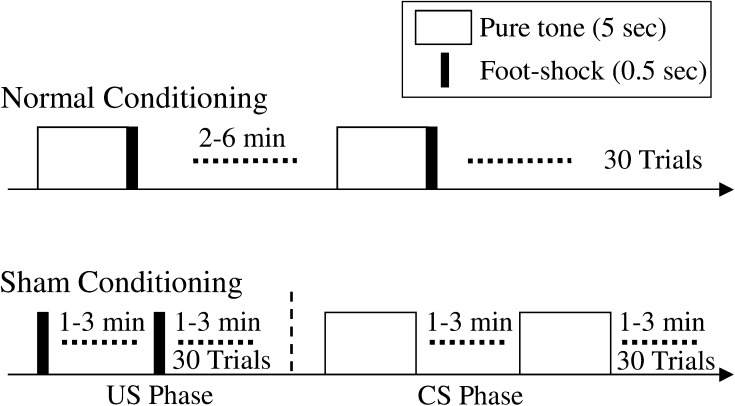
In this work, fear conditioning was carried out by using a sound stimulus (CS) and an electric foot-shock (US). Three groups (normal conditioning, sham conditioning and naïve) were prepared. Optical recording was carried out after the normal and sham conditioning. In the normal conditioning group, six guinea pigs were fear-conditioned while they were awake in the test cage, through a grid shock floor. The conditioning protocol is shown in Fig. 1. During the conditioning, CS (duration: 5 s, frequency: 12 kHz) was immediately followed by US (duration: 0.5 s, current intensity: 1.0–1.5 mA); in total 30 trials were carried out. The interval between each trial was randomly 2–6 min. In the sham conditioning group, six guinea pigs were sham conditioned while they were awake in the same test cage. The sham conditioning group was prepared as a control group. The sham conditioning protocol is shown in Fig. 1. Here, in order to prevent conditioning, CS and US were separately presented in a CS phase and a US phase, respectively. The interval between each stimulus was set randomly between 1 and 3 min; and CS and US were presented 30 times each. In order to confirm CR (the conditioned response), ECG (electrocardiogram) was measured before and after the normal and sham conditioning, which was before the surgery for optical imaging. In the naïve group, seven guinea pigs were prepared as a control. For these subjects, CS and US were never presented before the optical recording.
Fig. 1.
Normal conditioning and sham conditioning protocol
Optical imaging
Optical recording was carried out for the three groups of guinea pigs. The interval between the conditioning session and optical imaging session was approximately 3.5–4.0 h including the time for surgery and dye staining. Optical recording was performed with four kinds of pure tones, with a frequency of 4, 8, 12 and 16 kHz (duration: 30 ms, acoustic pressure: 65 dB SPL), and it was performed with electric foot-shock alone (duration: 0.5 s, current intensity: 0.5–1.5 mA).
The waveform of sound stimuli was generated by MATLAB (Version 6.5, Mathworks). The waveform data generated by MATLAB were transmitted as analog signals through the AD converter board (PCI-3337, Interface) installed in the personal computer. These signals were sent as output from a high-frequency speaker (ED1, ES1: 1041, Tucker-Davis Technologies) through the attenuator (PA5, Tucker-Davis Technologies). During the optical recording, sound stimuli were presented to the right ear of the guinea pig. The electrodes for the foot-shock were attached to the hind legs using conductive paste. The electric shock (pulse width: 5 ms, frequency: 60 Hz, duration: 0.5 s) was generated by using a stimulator (SEN-7203, Nihon Kohden), and was applied to the hind legs through an isolator (SS-202J, Nihon Kohden). The animal’s condition was monitored by ECG during the optical recording.
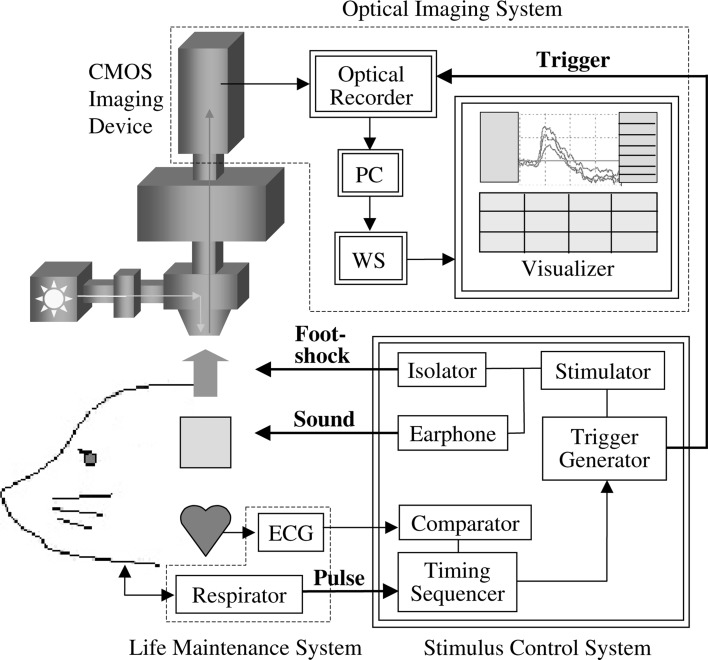
Figure 2 shows a schematic view of the optical recording system. An epi-illumination fluorescence microscopy (150 W halogen-tungsten lamp, 540 ± 30 nm band-pass filter, 580 nm dichroic mirror, 600 nm long-pass filter, ×1/NA 0.26 objective lens) was used for measuring neural activity in the auditory cortex. A 100 × 100 ch CMOS imaging device (MiCAM ULTIMA-L, Brainvision Inc., Tokyo) was used for recording the fluorescent signals from the brain surface. The amplified optical image data were sampled via a 12 bit A/D converter and sent to a workstation with 2.0 ms time resolution. In order to gain a sufficient S/N, 16 trials were carried out to record the optical responses. The respirator was stopped for a few seconds in order to eliminate the oscillation noise originating from respiration. Noise originating from heart pulsation was reduced by synchronizing the recording with the R-wave in the ECG and subtracting the recording without a stimulus from that with a stimulus. The illumination was turned on only during the recording period to minimize dye bleaching.
Fig. 2.
A schematic view of the optical recording system
ECG and CR
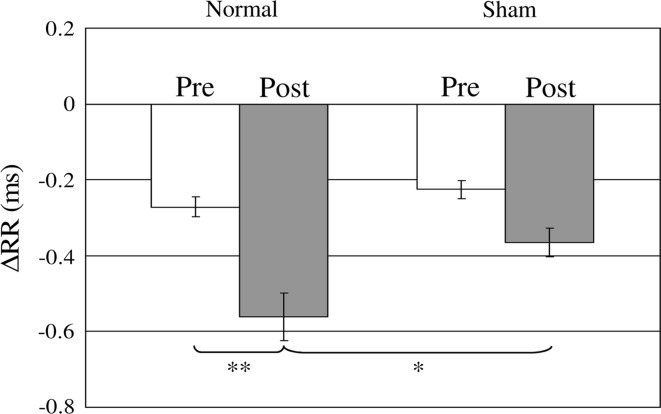
In fear conditioning, freezing and heart rate variation are usually used as the index of CR. Shibuki et al. (1984) has reported the presence of a CR (conditioned heart rate response) under α-chloralose and urethane anesthesia in rats. In this work, ECG was measured under Ketamine anesthesia before and after the normal and sham conditioning, which was before the surgery for optical imaging, in order to confirm CR in these two groups. ECG was measured for 20 s in a trial. CS (duration: 5 s, frequency: 12 kHz) was presented during 5 s at a time region of 5–10 s in a trial. The largest peak of the ECG amplitude is called the R wave. The variation of the R–R interval was used as the index of heart rate variation. Therefore, ∆RR, that is, the change of the R–R interval was investigated. ∆RR was defined as follows, ∆RR(t) = RR(t) − RRm. RR(t) is the R–R interval at a certain time t, and RRm is a mean value of the R–R interval during 5 s prior to the CS onset. The ∆RR shown in Figs. 3 and 6 represents the mean value of ∆RR(t) during 10 s after CS onset.
Fig. 3.
Comparison of the ∆RR value measured before and after normal and sham conditioning. White and gray color bars represent the ∆RR measured before and after the conditioning, respectively. The four bars represent the mean value of the ∆RR measured for 10 s after CS onset. Error bar is SEM. Normal: n = 6, Sham: n = 6, *p < 0.05, **p < 0.01
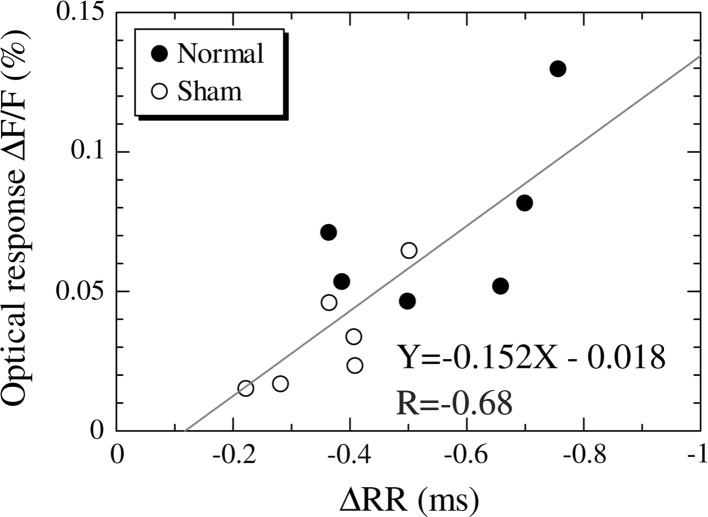
Fig. 6.
The correlation between the ∆RR measured after the normal and sham conditioning and the optical responses ∆F/F to foot-shock alone. The solid line represents the regression line (Y = −0.152X − 0.018). The value of R represents Spearman’s correlation coefficient
Data analysis
The following processing was carried out for the optical recording data. First, in order to correct for the difference of background fluorescence intensity, each optically detected activity was expressed as the ratio ∆F/F, where F and ∆F were the fluorescence light intensity at rest and the change in intensity induced by neuronal responses, respectively. Next, in order to eliminate the noise originating from heart pulsation, data recorded without any stimulation were subtracted from data recorded with each stimulus. Finally, in order to reduce noise such as shot noise, a 3 × 3 spatial median filter was used. To compare the optical responses of the three groups, the following procedure was carried out. We identified one representative pixel, which had maximum peak intensity in response to a 16 kHz pure tone. A matrix of 9 (3 × 3) pixels, which has the representative pixel at the center, was used for single-trial data.
In order to confirm CR, ∆RR was compared among the four groups: normal, sham, pre-conditioning and post-conditioning groups. ∆RR of those four groups were analyzed by two-way ANOVA, and then multiple comparisons were carried out by using the Tukey–Kramer method (Fig. 3).
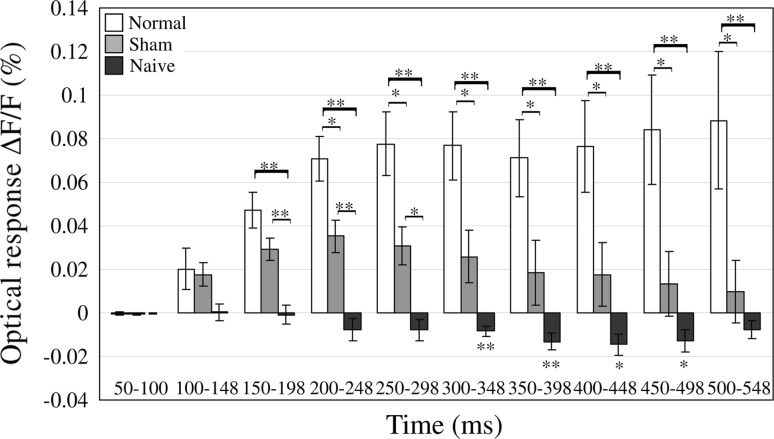
The optical imaging data were statistically analyzed by comparing the time course of the optical responses from the auditory cortex to foot-shock alone in the three groups. The time course was divided into 10 domains (bin = 48 ms), and the optical responses of each group were statistically compared (Fig. 5). First, the optical responses of the three groups in a bin were analyzed by repeated measures ANOVA, and then multiple comparisons were carried out by using the Tukey–Kramer method (Fig. 5).
Fig. 5.
Comparison of the mean optical responses to foot-shock alone in the three groups of the normal and sham conditioning and naïve in each bin. Bin width was set at 48 ms. The magnitude of each bar shows the mean optical responses in each bin. Error bar is SEM. Normal: n = 6, Sham: n = 6, Naïve: n = 7, *p < 0.05, **p < 0.01
In order to confirm the correlation between heart rate variation ∆RR and optical response ∆F/F in the auditory cortex, Spearman’s correlation coefficient R was calculated (Fig. 6). The mean value of the heart rate variation ∆RR and of the optical response ∆F/F for each guinea pig in the normal and sham conditioning group was used for the calculation of correlation coefficient. The vertical axis in Fig. 6 represents the mean optical response ∆F/F from 200 to 298 ms (Fig. 5). This time domain was adopted because significant differences in optical response were confirmed among all groups in this time domain.
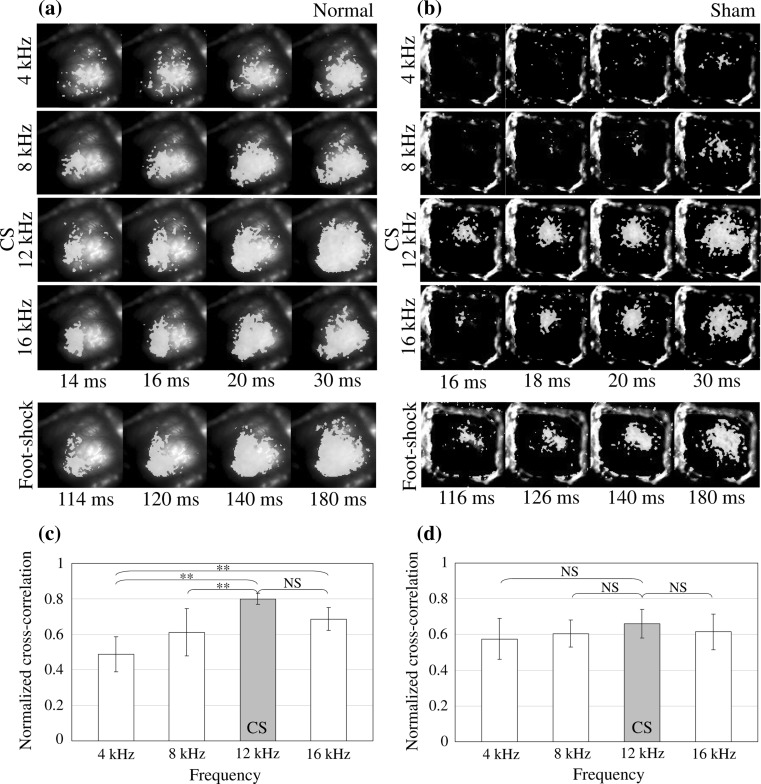
The activated area in the auditory cortex in response to CS sound and electric foot-shock was compared. In order to confirm the correlation between these areas, we calculated normalized cross-correlation between the area activated in response to an electric foot-shock and CS (12 kHz)/non-CS (4, 8, 16 kHz) sounds (Fig. 7). The normalized cross-correlation R was defined as:
 |
where fi,j and gi,j are the (i, j) th element of the matrix F and G. The matrix F and G represent 100 × 100 ch optical imaging data in response to electric foot-shock and CS/non-CS tone stimuli, respectively. Thus, N, M = 100 in the above formula. In the matrix F and G, the numerical values of fi,j and gi,j were converted into 0 or 1 from the real optical imaging data ∆F/F (%) according to the following rule: fi,j and gi,j = 0 when ∆F/F ≤ 3SD, and fi,j and gi,j = 1 when ∆F/F > 3SD (standard deviation) of the baseline.  and
and  are mean value of fi,j and gi,j, respectively. First, two-way ANOVA (repeated measure) was carried out for the two factors of frequencies (4-16 kHz) and conditioning groups (normal and sham). Next, one-way ANOVA was carried out for normal and sham conditioning groups. Finally, multiple comparison test (Tukey–Kramer) was carried out for normal conditioning group (Fig. 7c, d).
Fig. 7.
The neural activities in the auditory cortex to the CS (12 kHz)/non-CS (4, 8, 16 kHz) sounds and the electric foot-shocks in a the Normal conditioning group and b the Sham conditioning group. The normalized cross-correlation between the activated area in response to the CS (12 kHz)/non-CS(4, 8, 16 kHz) sounds and that to the electric foot-shock in c the Normal conditioning group and d the Sham conditioning group. Error bar is SEM. Normal: n = 6, Sham: n = 6, **p < 0.01, NS no significant differences
Drug application
To clarify the neural mechanism of the cortical activities in response to the foot-shock alone, the following procedure was performed. Two subjects in the normal conditioning group received direct cortical application (n = 2, 0.7 mM) of atropine sulfate. A piece of gelatin sponge soaked in an atropine solution (with an amount of 0.1 ml) was placed on the cortical surface for drug administration. The neural activities in the auditory cortex in response to pure tones and electric foot-shock alone were recorded before and after the direct cortical application of atropine sulfate. The direct cortical application of atropine sulfate was referred to in previous work (Bakin and Weinberger 1996; Ji and Suga 2008; Ji et al. 2005).
Results
The change of R–R interval (∆RR) in the ECG was measured in response to a tone (CS) in order to confirm the conditioning. Figure 3 shows the comparison of the ∆RR value measured before and after normal and sham conditioning. White and gray color bars represent the ∆RR measured before and after conditioning, respectively. The four bars represent the mean value of the ∆RR measured for 10 s after CS onset. There was a significant difference between pre and post in the normal conditioning group (p < 0.01), suggesting that the guinea pigs in the normal conditioning group were fear conditioned. On the other hand, there was no significant difference between pre and post in the sham conditioning group. Moreover, there was also a significant difference between normal and sham conditioning groups after the conditioning (p < 0.05).
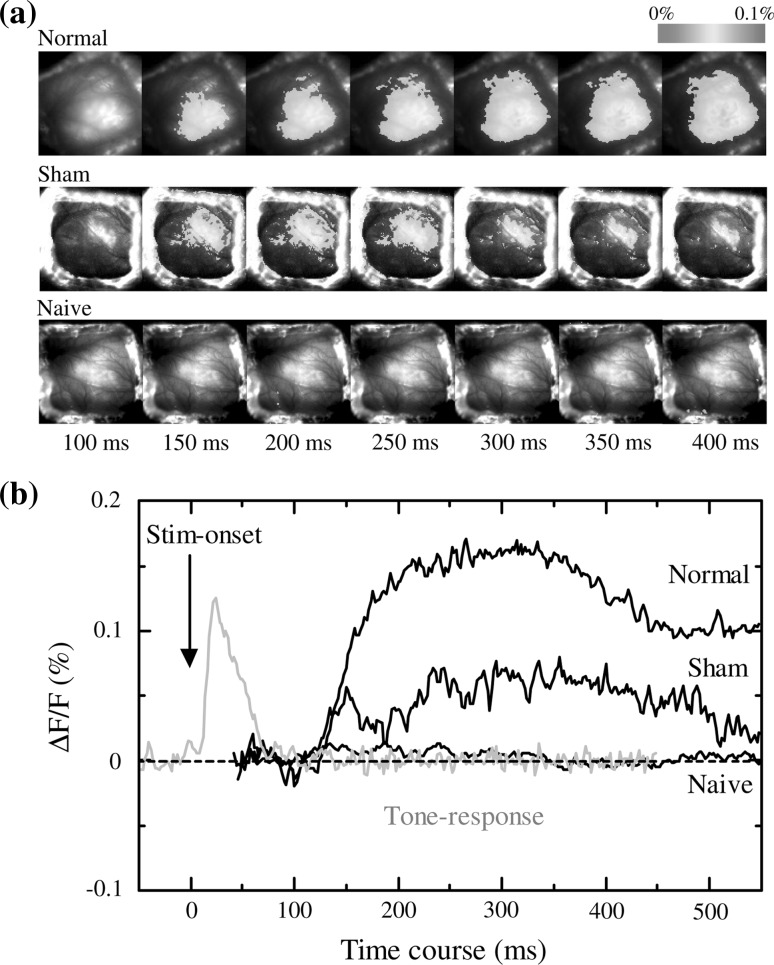
Next, the neural activities in the auditory cortex to electric foot-shocks alone were investigated without presenting any sound stimuli. Figure 4a shows the neural activities in the auditory cortex (optical responses) to foot-shock alone in the three groups. The neural activities in the auditory cortex could be clearly observed in both the normal and the sham conditioning groups, but no response could be observed in the naïve group. Figure 4b shows the time course of the optical response to foot-shock alone in the three groups. No response was observed in the naïve group, whereas responses were observed in both the normal and sham conditioning groups. ECG data show that the guinea pigs of the sham conditioning group were not statistically significantly conditioned. However there was a tendency of a difference between pre and post conditioning, implying that some level of conditioning or sensitization might have occurred (Fig. 3). The time course of the normal tone response (gray solid line) shows a peak onset latency of approximately 40 ms and an offset latency of approximately 100 ms. However, the time course of the auditory response to electric foot-shock alone (black solid lines) shows an onset latency of 120 ms and a very long duration of over 500 ms, suggesting that the time course of the optical response to electric foot-shock was very different from that of the responses to pure tones.
Fig. 4.
a The neural activities in the auditory cortex (optical responses) to foot-shock alone in the three groups of the normal and sham conditioning and naïve groups. b The time course of the neural activities in the auditory cortex to foot-shock alone in the three groups (black solid lines). Gray solid line represents the neural activities in the auditory cortex of a naïve animal to 12 kHz pure tone
The mean optical responses in the auditory cortex to foot-shock alone in the three groups were statistically compared in each bin (Fig. 5). Bin width was set at 48 ms. The magnitude of each bar shows the mean optical responses in each bin. Repeated measures ANOVA with time-bin and group were carried out, producing a statistically significant interaction between time-bin and groups (p < 0.000). Then, multiple comparisons were carried out using the Tukey–Kramer method. Significant differences were confirmed between normal conditioning and naïve from 150 to 548 ms (p < 0.01), between normal conditioning and sham conditioning from 200 to 548 ms (p < 0.05), and between sham conditioning and naïve from 150 to 248 ms (p < 0.01) and 250–298 ms (p < 0.05). Moreover, significant differences were confirmed between naïve and baseline (optical response ∆F/F = 0 %) from 300 to 398 ms (p < 0.01) and 400–498 ms (p < 0.05), suggesting that the neural activities in the auditory cortex to foot-shock alone were inhibitory before the conditioning.
Figure 6 shows the correlation between the ∆RR measured after the normal and sham conditioning and the optical response ∆F/F to foot-shock alone. The solid line shown in Fig. 6 represents the regression line (Y = −0.152X − 0.018, p < 0.01). In order to confirm the correlation between the ∆RR and the optical response, we calculated Spearman’s correlation coefficient. The correlation coefficient R amounted to −0.68, confirming that there was a significant negative correlation between the ∆RR and the neural activities in the auditory cortex ∆F/F.
Next, the activated areas in the auditory cortex to the CS sounds and the electric foot-shocks were compared. Figure 7a, b show the neural activities in the auditory cortex to the CS (12 kHz)/non-CS (4, 8, 16 kHz) sounds and electric foot-shocks in normal and sham conditioning group, respectively. As shown in Fig. 7a, there seemed to be a correlation between the shape and location of the activated area in response to the CS sound (12 kHz) and electric foot-shock in normal conditioning group, although there was a large difference in time scale. The activation pattern induced by non-CS (4, 8, 16 kHz) sounds also shows a similar tendency. However, compared to 12 kHz, the pattern is a bit different from that by foot-shock. Compared to normal conditioning group, there seemed to be a lower correlation between them in sham conditioning group, as shown in Fig. 7b. In order to compare quantitatively, the normalized cross-correlation between the activated area in response to the CS/non-CS sounds and that to the electric foot-shock was calculated in both normal and sham conditioning groups. First, two-way ANOVA (repeated measure) was carried out for the two factors of frequencies (4–16 kHz) and conditioning groups (normal and sham). As a result, there was a statistically significant main effect between frequencies (p < 0.000), and was also a statistically significant interaction between frequencies and conditioning groups (p < 0.05). Next, one-way ANOVA was carried out for normal and sham conditioning groups. As a result, there was a statistically significant difference in normal conditioning group (p < 0.000), however, there was no statistically significant difference in sham conditioning group (p > 0.25). Next, multiple comparison test (Tukey–Kramer) was carried out for normal conditioning group. Figure 7c shows that the activated area in response to electric foot-shock statistically significantly had a larger cross-correlation value for tone response to the CS sound (12 kHz) compared to the non-CS sounds in normal conditioning group, however, cross-correlation between the activated area in response to electric foot-shock and CS/non-CS sounds had no statistically significant difference in sham conditioning group, as shown in Fig. 7d.
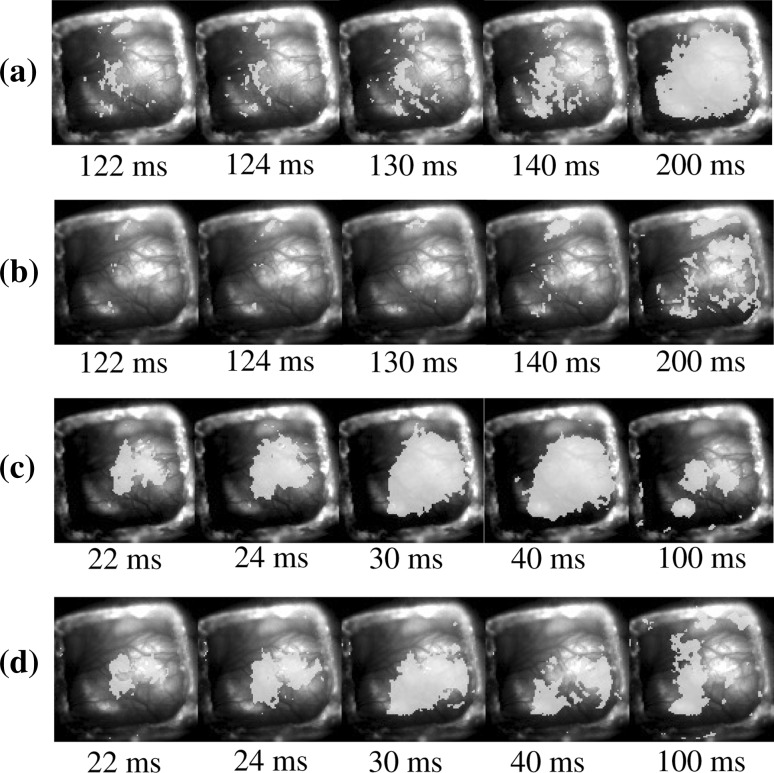
Finally, an effect of atropine sulfate on the cortical response to the electric foot-shock was investigated. Figure 8a, b show the neural activities in the auditory cortex to the electric foot-shock before and after the direct application of atropine sulfate to the auditory cortex, respectively. As a result, it was found that the neural activities in the auditory cortex to the electric foot-shock could be blocked by atropine sulfate. On the other hand, the neural activities in the auditory cortex to a pure tone could not be completely eliminated by atropine sulfate as shown in Fig. 8d. However, it was found that atropine reduced the tone response to some extent as shown in Fig. 8c, d, suggesting that atropine selectively reduces conditioned activity, rather than simply suppressing the general excitability of the cortex.
Fig. 8.
Effect of atropine sulfate on the neural activities in the auditory cortex to the electric foot-shock and a pure tone. The neural activities in the auditory cortex to the electric foot-shock a before and b after the direct application of atropine sulfate to the auditory cortex. The neural activities in the auditory cortex to a pure tone c before and d after the direct application of atropine sulfate to the auditory cortex
Discussion
The mere presentation of a foot-shock without any sound elicited activity in the auditory cortex after fear conditioning (Fig. 4). There were statistical significant differences in the mean optical responses to foot-shock alone among the three groups (Fig. 5), and there was a correlation between the heart rate variation ∆RR and the optical responses ∆F/F (Fig. 6). These results suggested that the neural activities in the auditory cortex to foot-shock alone reflect a function, not of shock magnitude but of the behavioral significance of the shock. On the other hand, the neural activities evoked in the normal and sham groups seem to be similar in quality and the main difference seems to be quantitative (Figs. 5, 6, 7), implying that some level of conditioning might have occurred for the animals in the sham group, as we have mentioned in the explanation for Fig. 4 in "Results".
Carretta et al. (1999) have investigated c-Fos expression related to the significance of acoustic signals in the rat auditory pathways during a sensory-motor reward task. As a result, in medial geniculate body (MGB), the number of Fos-like immunopositive cells was comparable in the normal and sham group, but higher than in the naïve group. On the other hand, in the auditory cortex, the number of Fos-like immunopositive cells differed between normal and sham group, suggesting that the auditory cortical areas may be involved in the encoding of the behavioral significance of the acoustic stimuli. The cortical activation induced by foot-shock as shown in Figs. 4, 5, 6, 7 might also represent the encoding of the behavioral significance of the acoustic stimuli. Additionally, the similarity of cortical activation induced by foot-shock between normal and sham group might be reflected by the non-selectivity of MGB between normal and sham group, because MGB might be involved in the cortical activity induced by foot-shock, as mentioned below.
Next, the normalized cross-correlation between the activated areas in the auditory cortex to the CS/non-CS sounds and the electric foot-shocks were compared. As a result, the activated areas in the auditory cortex to the foot-shock had statistically significant large cross-correlation value with that to CS sound in the normal conditioning group, however there was no statistically significant cross-correlation in the sham conditioning group, suggesting that the internal representation of CS sound could be activated by US presentation due to the associative learning effects of CS–US, resulting that similar activation area to CS sound in the auditory cortex was activated by US without CS presentation. In the sham conditioning group, the activated areas in the auditory cortex to the foot-shock had no statistically significant cross-correlation value with that to a sound of a specific frequency. On the other hand, optical imaging data showed that the auditory cortex was activated to some extent by foot-shock alone in the sham conditioning group after the sham conditioning, compared to no response in the naïve group. Therefore, this phenomenon in the sham conditioning might be induced by non-associative learning effect such as habituation or sensitization. Generally, it is known that repetitive presentation of tone or shock induces habituation or sensitization, respectively. Therefore, it might be possible that animals in the sham group were also influenced by habituation and sensitization.
The cerebral cortex consists of six layers, and it has been reported that optical imaging may record neural responses from layers II and III in the cerebral cortex (Horikawa et al. 1996; Lippert et al. 2006). It has been reported that the excitatory postsynaptic potential (EPSP) on the dendrites is involved in the optical response from the cortex observed by in vivo optical imaging with voltage sensitive dye (Grinvald et al. 1994).
Pharmacological experimental data in vivo have shown that responses of the auditory cortex to pure tones recorded by optical imaging consist of the following three main components: (1) non-NMDA (N-methyl-d-aspartate) glutamate receptor (non-NMDAR) dependent EPSP, which is a fast response component, (2) NMDAR dependent EPSP, which is a slow response component and (3) GABA (γ-amino butyric acid) receptor (GABAR) dependent inhibitory postsynaptic potential (IPSP) (Horikawa et al. 1996). The same study also showed that excitatory neuron activities based on NMDAR occur laterally beyond the iso-frequency band in the tonotopic map of the auditory cortex, whereas the tonotopy was formed by GABAergic inhibitory interneurons in the layers II and III.
It has been reported that neural circuits involving the medial geniculate body, the amygdala, the basal forebrain (BF) and the auditory cortex are very important for fear conditioning using sound and foot-shock, and that the plastic changes in the auditory cortex are induced by acetylcholine (ACh) released from the basal forebrain to the cortex during conditioning (Kilgard and Merzenich 1998; Weinberger and Bakin 1998; Edeline 1999). Bakin and Weinberger (1996) have first reported that NB stimulation produces tuning shifts. ACh affects pyramidal neurons and promotes plastic changes in the auditory cortex (Rasmusson 2000; Bandrowski et al. 2001). Moreover, several studies have reported learning-dependent increase of ACh release in the cortex (Acquas et al. 1996; Butt et al. 2009).
One notable characteristic of NMDAR dependent EPSP is that it shows a slow response: The rising velocity is slow and a large response is observed in a late time region, 50 ms later than onset latency (Horikawa et al. 1996). In line with this characteristic, our data in Fig. 4 showed that the rising velocity of the neural activities in the auditory cortex to foot-shock alone was slow, and a large response was obtained in a late time region, 50 ms later than the onset latency. This finding implies that NMDAR dependent late-EPSP might be a dominant component of the neural activities in the auditory cortex to foot-shock. However, it is not likely that the long duration (approximately over 500 ms) of the neural activities in the auditory cortex to foot-shock was solely due to NMDAR dependent EPSP.
Regarding other possible mechanisms, it has been reported that ACh release to the cortex induced by BF stimulation produces long-lasting (6 s) cortical desynchronization (Bakin and Weinberger 1996). It also affects cortical evoked potentials at a time of approximately over 100 ms later than BF stimulus onset (Golmayo et al. 2003). ACh also contributes to attentional modulation in V1 for 200–500 ms after stimulus onset (Herrero et al. 2008). Furthermore, Cole and Nicoll (1984) have reported that a slow EPSP, lasting 20–30 s, could be evoked in rat hippocampal pyramidal cells through ACh release induced by electrical stimulation of stratum oriens. In the present study, we were able to block the cortical response to the electric foot-shock alone by direct application of atropine sulfate to the auditory cortex, as shown in Fig. 8. However, the neural activities in the auditory cortex to a pure tone remained after atropine application (also shown in Fig. 8). Tone information is directly transferred to the auditory cortex by way of the ventral subdivision of the medial geniculate body (MGv). Thus, the neural activities in the auditory cortex to a pure tone was immune to atropine sulfate. These results suggest that ACh released from the BF to the cortex is deeply involved in the long-lasting neural activities in the auditory cortex to foot-shock alone, as shown in Figs. 4 and 5.
Furthermore, Bandrowski et al. (2001) demonstrated that lower level of ACh release induced hyperpolarization and higher level of ACh release induced depolarization of layer II and III pyramidal cells in the rat auditory cortex. Figure 5 shows that the cortical response to electric foot-shock was inhibitory response in the naive state and became excitatory response after conditioning, supporting those results. Letzkus et al. (2011) have demonstrated that stimulus convergence of tone and foot-shock in the auditory cortex is necessary for associative fear learning and clarified that layer I GABAergic interneurons in the mouse auditory cortex was activated by foot-shock mediated ACh release from basal forebrain. Activation of layer I interneurons showed long-lasting response for 1–2 s after foot-shock, suggesting that inhibitory response in the naive state in our data (Fig. 5) might be reflected by activation of layer I GABAergic interneurons. They have also clarified that activation of layer I interneurons generated inhibition of layer II and III parvalbumin-positive (PV+) interneurons, resulting in disinhibition in the auditory cortex. Layer II and III pyramidal neurons in the auditory cortex showed long-lasting disinhibition for 1–2 s after foot-shock, supporting our results of cortical activation induced by foot-shock alone after fear conditioning. Storozhuk et al. (2003) have also demonstrated that there is a constant tonic inhibitory control over the excitatory spike responses of pyramidal neurons in the sensorimotor cortex during conditioned reflex activity, also supporting our results.
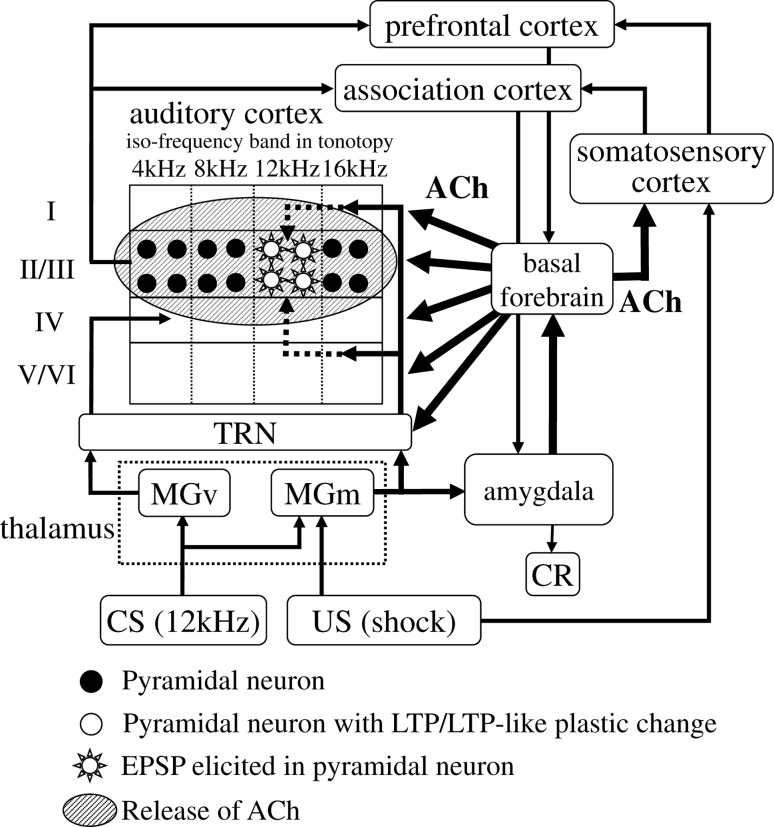
It has been reported that the magnocellular subdivision of the medial geniculate body (MGm), projecting to layer I, II and VI of the core and belt auditory cortices, responds to both auditory and somatosensory stimuli, and has relatively long-lasting plasticity induced by fear conditioning (Edeline and Weinberger 1992; Weinberger and Bakin 1998). From these observations, one might deduce the following hypothesis about neural mechanisms of auditory fear conditioning. Figure 9 shows a schematic diagram of the hypothesized neural circuit including the auditory cortex, the thalamus, the amygdala and the basal forebrain based on the models of Weinberger and Suga (Weinberger and Bakin 1998; Suga 2008). TRN (the thalamic reticular nucleus), which plays a key role in modulating the activity in the auditory thalamocortical pathway, is also incorporated in Fig. 9. Villa et al. (1996, 1999) reported that the cholinergic projection from the basal forebrain affects TRN, modifying the activity pattern in the auditory cortex through changes in the thalamus. First, CS (tone) information is directly transferred to the auditory cortex by way of MGv in the thalamus, such that pyramidal neurons in layers II and III produce EPSP (normal tone response). Next, US (foot-shock) information is transferred to the amygdala by way of MGm in thalamus, and ACh is released from BF to the auditory cortex. As a result, LTP and/or LTP-like plastic changes occur in MGm and in the pyramidal neurons in layers II and III of the auditory cortex, where EPSP is induced in response to CS. Then, after conditioning, when US alone is presented, learning-dependent increase in ACh release from BF occurs, cholinergic activation of layer I interneurons generate disinhibition of layer II and III pyramidal neurons and US information is transferred to the auditory cortex by way of MGm, eliciting EPSP in the pyramidal neurons where LTP and/or LTP-like plastic changes were induced by conditioning. This, in turn, would result in the emergence of the neural activities in the auditory cortex to a foot-shock alone, and might explain the correlation between the activated area in the auditory cortex in response to CS sound and US foot-shock. We conclude that integration of different sensory modalities in the auditory cortex was established by fear conditioning.
Fig. 9.
A neural model of CS-specific tuning plasticity in the primary auditory cortex according to associative learning. ACh acetylcholine, CR conditioned response, CS conditioned stimulus, US unconditioned stimulus, MGm the magnocellular subdivision of the medial geniculate body, MGv the ventral subdivision of the medial geniculate body, TRN the thalamic reticular nucleus
Acknowledgments
This work was supported by the 21st Century Center of Excellence (COE) Program and the Global COE Program at Tamagawa University and Grants-in-Aid for Scientific Research (A) 19200014, Grants-in-Aid for Young Scientists (B) 21700435 and Grants-in-Aid for Scientific Research on Innovative Areas 21120006 from the Ministry of Education, Culture, Sports, Science and Technology of Japan.
We are grateful to H. Fujii for useful advice and discussion.
References
- Acquas E, Wilson C, Fibiger HC. Conditioned and unconditioned stimuli increase frontal cortical and hippocampal acetylcholine release: effects of novelty, habituation, and fear. J Neurosci. 1996;16(9):3089–3096. doi: 10.1523/JNEUROSCI.16-09-03089.1996. [DOI] [PMC free article] [PubMed] [Google Scholar]
- Bakin JS, Weinberger NM. Classical conditioning induces CS-specific receptive field plasticity in the auditory cortex of the guinea pig. Brain Res. 1990;536:71–286. doi: 10.1016/0006-8993(90)90035-A. [DOI] [PubMed] [Google Scholar]
- Bakin JS, Weinberger NM. Induction of a physiological memory in the cerebral cortex by stimulation of the nucleus basalis. Proc Natl Acad Sci USA. 1996;93:11219–11224. doi: 10.1073/pnas.93.20.11219. [DOI] [PMC free article] [PubMed] [Google Scholar]
- Bandrowski AE, Moore SL, Ashe JH. Cholinergic synaptic potentials in the supragranular layers of auditory cortex. Synapse. 2001;41:118–130. doi: 10.1002/syn.1066. [DOI] [PubMed] [Google Scholar]
- Bieszczad KM, Weinberger NM. Remodeling the cortex in memory: increased use of a learning strategy increases the representational area of relevant acoustic cues. Neurobiol Learn Mem. 2010;94(2):127–144. doi: 10.1016/j.nlm.2010.04.009. [DOI] [PMC free article] [PubMed] [Google Scholar]
- Bieszczad KM, Weinberger NM. Representational gain in cortical area underlies increase of memory strength. Proc Natl Acad Sci USA. 2010;107(8):3793–3798. doi: 10.1073/pnas.1000159107. [DOI] [PMC free article] [PubMed] [Google Scholar]
- Brosch M, Selezneva E, Scheich H. Nonauditory events of a behavioral procedure activate auditory cortex of highly trained monkey. J Neurosci. 2005;25(29):6797–6806. doi: 10.1523/JNEUROSCI.1571-05.2005. [DOI] [PMC free article] [PubMed] [Google Scholar]
- Butt AE, Chavez CM, Flesher MM, Kinney-Hurd BL, Araujo GC, Miasnikov AA, Weinberger NM. Association learning-dependent increases in acetylcholine release in the rat auditory cortex during auditory classical conditioning. Neurobiol Learn Mem. 2009;92(3):400–409. doi: 10.1016/j.nlm.2009.05.006. [DOI] [PubMed] [Google Scholar]
- Carretta D, Hervé-Minvielle A, Bajo VM, Villa AE, Rouiller EM. c-Fos expression in the auditory pathways related to the significance of acoustic signals in rats performing a sensory-motor task. Brain Res. 1999;841(1–2):170–183. doi: 10.1016/S0006-8993(99)01840-5. [DOI] [PubMed] [Google Scholar]
- Cole AE, Nicoll RA. Characterization of a slow cholinergic post-synaptic potential recorded in vitro from rat hippocampal pyramidal cells. J Physiol. 1984;352:173–188. doi: 10.1113/jphysiol.1984.sp015285. [DOI] [PMC free article] [PubMed] [Google Scholar]
- Edeline JM. Learning-induced physiological plasticity in the thalamo-cortical sensory systems: a critical evaluation of receptive field plasticity, map changes and their potential mechanisms. Prog Neurobiol. 1999;57:165–224. doi: 10.1016/S0301-0082(98)00042-2. [DOI] [PubMed] [Google Scholar]
- Edeline JM, Weinberger NM. Associative retuning in the thalamic source of input to the amygdala and auditory cortex: receptive field plasticity in the medial division of the medial geniculate body. Behav Neurosci. 1992;106(1):81–105. doi: 10.1037/0735-7044.106.1.81. [DOI] [PubMed] [Google Scholar]
- Fu K-MG, Johnston TA, Shah AS, Arnold L, Smiley J, Hackett TA, Garraghty PE, Schroeder CE. Auditory cortical neurons respond to somatosensory stimulation. J Neurosci. 2003;23(20):7510–7515. doi: 10.1523/JNEUROSCI.23-20-07510.2003. [DOI] [PMC free article] [PubMed] [Google Scholar]
- Galván VV, Weinberger NM. Long-term consolidation and retention of learning-induced tuning plasticity in the auditory cortex of the guinea pig. Neurobiol Learn Mem. 2002;77:78–108. doi: 10.1006/nlme.2001.4044. [DOI] [PubMed] [Google Scholar]
- Golmayo L, Nunez A, Zaborszky L. Electrophysiological evidence for the existence of a posterior cortical–prefrontal–basal forebrain circuitry in modulating sensory responses in visual and somatosensory rat cortical areas. Neuroscience. 2003;119:597–609. doi: 10.1016/S0306-4522(03)00031-9. [DOI] [PubMed] [Google Scholar]
- Grinvald A, Lieke EE, Frostig RD, Hildesheim R. Cortical point spread function and long-range lateral interactions revealed by real-time optical imaging of macaque monkey primary visual cortex. J Neurosci. 1994;14(5):2545–2568. doi: 10.1523/JNEUROSCI.14-05-02545.1994. [DOI] [PMC free article] [PubMed] [Google Scholar]
- Herrero JL, Roberts MJ, Delicato LS, Giesemann MA, Dayan P, Thiele A. Acetylecholine contributes through muscarinic receptors to attentional modulation in V1. Nature. 2008;454:1110–1114. doi: 10.1038/nature07141. [DOI] [PMC free article] [PubMed] [Google Scholar]
- Horikawa J, Hosokawa Y, Kubota M, Nasu M, Taniguchi I. Optical imaging of spatiotemporal patterns of glutamatergic excitation and GABAergic inhibition in the guinea-pig. J Physiol. 1996;497:629–638. doi: 10.1113/jphysiol.1996.sp021795. [DOI] [PMC free article] [PubMed] [Google Scholar]
- Horikawa J, Hess A, Nasu M, Hosokawa Y, Scheich H, Taniguchi I. Optical imaging of neural activity in multiple auditory cortical fields of guinea pigs. NeuroReport. 2001;12(15):3335–3339. doi: 10.1097/00001756-200110290-00038. [DOI] [PubMed] [Google Scholar]
- Hosokawa Y, Sugimoto S, Kubota M, Taniguchi I, Horikawa J. Optical imaging of binaural interaction in multiple fields of the guinea pig auditory cortex. NeuroReport. 2004;15:1093–1097. doi: 10.1097/00001756-200405190-00002. [DOI] [PubMed] [Google Scholar]
- Hui GK, Wong KL, Chavez CM, Leon MI, Robin KM, Weinberger NM. Conditioned tone control of brain reward behavior produces highly specific representational gain in the primary auditory cortex. Neurobiol Learn Mem. 2009;92(1):27–34. doi: 10.1016/j.nlm.2009.02.008. [DOI] [PMC free article] [PubMed] [Google Scholar]
- Ide Y, Miyazaki T, Lauwereyns J, Sandner G, Tsukada M, Aihara T. Optical imaging of plastic changes induced by fear conditioning in the auditory cortex. Cogn Neurodyn. 2012;6(1):1–10. doi: 10.1007/s11571-011-9173-x. [DOI] [PMC free article] [PubMed] [Google Scholar]
- Ji W, Suga N. Tone-specific and nonspecific plasticity of the auditory cortex elicited by pseudoconditioning: role of acetylcholine receptors and the somatosensory cortex. J Neurophysiol. 2008;100:1384–1396. doi: 10.1152/jn.90340.2008. [DOI] [PMC free article] [PubMed] [Google Scholar]
- Ji W, Suga N, Gao E. Effects of agonists and antagonists of NMDA and ACh receptors on plasticity of bat auditory system elicited by fear conditioning. J Neurophysiol. 2005;94:1199–1211. doi: 10.1152/jn.00112.2005. [DOI] [PubMed] [Google Scholar]
- Kacelnik O, Nodal FR, Parsons CH, King AJ. Training-induced plasticity of auditory localization in adult mammals. PLoS Biol. 2006;4(4):627–638. doi: 10.1371/journal.pbio.0040071. [DOI] [PMC free article] [PubMed] [Google Scholar]
- Kilgard MP, Merzenich MM. Cortical map reorganization enabled by nucleus basalis activity. Science. 1998;279:1714–1718. doi: 10.1126/science.279.5357.1714. [DOI] [PubMed] [Google Scholar]
- King AJ. Auditory neuroscience: activating the cortex without sound. Curr Biol. 2006;16:410–411. doi: 10.1016/j.cub.2006.05.012. [DOI] [PMC free article] [PubMed] [Google Scholar]
- Kraemer DJ, Macrae CN, Green AE, Kelley WM. Musical imagery: sound of silence activates auditory cortex. Nature. 2005;434:158. doi: 10.1038/434158a. [DOI] [PubMed] [Google Scholar]
- Letzkus JJ, Wolff SB, Meyer EM, Tovote P, Courtin J, Herry C, Luthi A. A disinhibitory microcircuit for associative fear learning in the auditory cortex. Nature. 2011;480:331–335. doi: 10.1038/nature10674. [DOI] [PubMed] [Google Scholar]
- Lippert TM, Takagaki K, Xu W, Huang X, Wu J-Y. Methods for voltage-sensitive dye imaging of rat cortical activity with high signal-to-noise ratio. J Neurophysiol. 2006;98:502–512. doi: 10.1152/jn.01169.2006. [DOI] [PMC free article] [PubMed] [Google Scholar]
- Ma X, Suga N. Long-term cortical plasticity evoked by electrical stimulation and acetylcholine applied to the auditory cortex. Proc Natl Acad Sci USA. 2005;102:9335–9340. doi: 10.1073/pnas.0503851102. [DOI] [PMC free article] [PubMed] [Google Scholar]
- Rasmusson DD. The role of acetylcholine in cortical synaptic plasticity. Behav Brain Res. 2000;115:205–218. doi: 10.1016/S0166-4328(00)00259-X. [DOI] [PubMed] [Google Scholar]
- Read HL, Winer JA, Schreiner CE. Functional architecture of auditory cortex. Curr Opin Neurobiol. 2002;12:433–440. doi: 10.1016/S0959-4388(02)00342-2. [DOI] [PubMed] [Google Scholar]
- Recanzone GH, Schreiner CE, Merzenich MM. Plasticity in the frequency representation of primary auditory cortex following discrimination training in adult owl monkeys. J Neurosci. 1993;13(1):87–103. doi: 10.1523/JNEUROSCI.13-01-00087.1993. [DOI] [PMC free article] [PubMed] [Google Scholar]
- Rutkowski RG, Weinberger NM. Encoding of learned importance of sound by magnitude of representational area in primary auditory cortex. Proc Natl Acad Sci USA. 2005;102:13664–13669. doi: 10.1073/pnas.0506838102. [DOI] [PMC free article] [PubMed] [Google Scholar]
- Shibuki K, Hamamura M, Yagi K. Conditioned heart rate response: testing under anesthesia in rats. Neurosci Res. 1984;1:373–378. doi: 10.1016/0168-0102(84)90043-9. [DOI] [PubMed] [Google Scholar]
- Storozhuk VM, Khorevin VI, Razumna NN, Tetko IV, Villa AP. The effects of activation of glutamate ionotropic connections of neurons in the sensorimotor cortex in a conditioned reflex. Neurosci Behav Physiol. 2003;33(5):479–488. doi: 10.1023/A:1023415317960. [DOI] [PubMed] [Google Scholar]
- Suga N. The neural circuit for tone-specific plasticity in the auditory system elicited by conditioning. Learn Mem. 2008;15:198–201. doi: 10.1101/lm.791408. [DOI] [PubMed] [Google Scholar]
- Villa AE, Bajo Lorenzana VM, Vantini G. Nerve growth factor modulates information processing in the auditory thalamus. Brain Res Bull. 1996;39(3):139–147. doi: 10.1016/0361-9230(95)02085-3. [DOI] [PubMed] [Google Scholar]
- Villa AE, Tetko IV, Dutoit P, De Ribaupierre Y, De Ribaupierre F. Corticofugal modulation of functional connectivity within the auditory thalamus of rat, guinea pig and cat revealed by cooling deactivation. J Neurosci Methods. 1999;86(2):161–178. doi: 10.1016/S0165-0270(98)00164-2. [DOI] [PubMed] [Google Scholar]
- Voisin J, Bidet-Caulet A, Bertrand O, Fonlupt P. Listening in silence activates auditory areas: a functional magnetic resonance imaging study. J Neurosci. 2006;26:273–278. doi: 10.1523/JNEUROSCI.2967-05.2006. [DOI] [PMC free article] [PubMed] [Google Scholar]
- Weinberger NM, Bakin JS. Learning-induced physiological memory in adult primary auditory cortex: receptive field plasticity, model, and mechanisms. Audiol Neuro Otol. 1998;3:145–167. doi: 10.1159/000013787. [DOI] [PubMed] [Google Scholar]
- Zatorre RJ, Halpern AR. Mental concerts: musical imagery and auditory cortex. Neuron. 2005;47:9–12. doi: 10.1016/j.neuron.2005.06.013. [DOI] [PubMed] [Google Scholar]


