

Abstract
Dopamine can regulate signal generation and transmission by activating multiple receptors and signaling cascades, especially in striatum, hippocampus, and cerebral cortex. Dopamine modulates an even larger variety of cellular properties in retina, yet has been reported to do so by only D1 receptor-driven cyclic adenosine monophosphate (cAMP) increases or D2 receptor-driven cAMP decreases. Here, we test the possibility that dopamine operates differently on retinal ganglion cells, because the ganglion cell layer binds D1 and D2 receptor ligands, and displays changes in signaling components other than cAMP under illumination that should release dopamine. In adult rat retinal ganglion cells, based on patch-clamp recordings, Ca2+ imaging, and immunohistochemistry, we find that 1) spike firing is inhibited by dopamine and SKF 83959 (an agonist that does not activate homomeric D1 receptors or alter cAMP levels in other systems); 2) D1 and D2 receptor antagonists (SCH 23390, eticlopride, raclopride) counteract these effects; 3) these antagonists also block light-induced rises in cAMP, light-induced activation of Ca2+/calmodulin-dependent protein kinase II, and dopamine-induced Ca2+ influx; and 4) the Ca2+ rise is markedly reduced by removing extracellular Ca2+ and by an IP3 receptor antagonist (2-APB). These results provide the first evidence that dopamine activates a receptor in adult mammalian retinal neurons that is distinct from classical D1 and D2 receptors, and that dopamine can activate mechanisms in addition to cAMP and cAMP-dependent protein kinase to modulate retinal ganglion cell excitability.
INDEXING TERMS: retina, immunohistochemistry, dopamine, cAMP, CaMKII, Ca2+, excitability
Rod- and cone-driven circuits of duplex retinae enable diurnal animals to extract visual information at night and by daylight. Following light-induced release from wide-field interneurons, dopamine is thought to facilitate transitions from rod- to cone-driven signaling at all levels of the retina by modulating photoreceptor light responses, neurotransmitter release, neurotransmitter responses, electrical coupling, balance between receptive field components, voltage-gated currents in nonspiking cells, and spike generation (Witkovsky, 2004). These effects have been reported to be mediated by either classical D1- or D2-type receptors. At the former, dopamine and D1 agonist effects were attenuated by D1 antagonists, mimicked by raised intracellular cyclic adenosine monophosphate (cAMP) levels, and unaffected by D2 ligands (e.g., Hensler and Dubocovich 1986; Dearry et al., 1990; Feigenspan and Bormann, 1994); at the latter, dopamine and D2 agonist effects were attenuated by D2 antagonists and unaffected by D1 ligands (e.g., Pierce and Besharse, 1985; Iuvone et al., 1987; Manglapus et al., 1999).
Curiously, both D1 and D2 receptor antibodies, ligands, and mRNA probes bind to the mammalian retinal ganglion cell layer (Brann and Young, 1986; Cohen et al., 1992; Wagner et al., 1993; Bjelke et al., 1996; Veruki and Wassle, 1996; Hayashida et al., 2009; Van Hook et al., 2012). Whereas this could reflect mixtures of cells expressing either D1 or D2 receptors, dopamine responses in other preparations are known to involve more than one receptor subtype and, in some cases, different signaling cascades and heteromeric receptor complexes (Neve et al., 2004; Hasbi et al., 2010). Thus, D1 and D2 receptor coexpression might account for D1 and D2 ligand binding to the ganglion cell layer. This possibility is of functional interest because dopamine has been found to regulate resting potential, voltage-gated currents, photocurrents, spiking, and dye coupling in ganglion cells (Straschill and Perwein, 1969; Liu and Lasater, 1994; Vaquero et al., 2001; Hayashida and Ishida, 2004; Sakamoto et al., 2005; Mills et al., 2007; Chen and Yang, 2007; Hoshi et al., 2009; Hayashida et al., 2009; Hu et al., 2010; Van Hook et al., 2012), and dopaminergic activation of different signaling cascades modulates ion currents at different membrane potentials, speeds, and locations within striatal, hippocampal, and cortical neurons (e.g., Cantrell et al., 1999; Trantham-Davidson et al., 2004; Perez et al., 2006; Rashid et al., 2007; Rosenkranz and Johnston, 2007).
We therefore tested 1) whether illumination and dopa-mine activate signaling cascade components in addition to cAMP in adult rat retinal ganglion cells; 2) whether ganglion cell excitability is reduced by dopamine and by SKF 83959 (a dopamine receptor agonist that does not activate homomeric D1 or D2 receptors); and 3) whether D1 and D2 antagonists counteract these effects. We report here that full-field illumination elevates cAMP and activates Ca2+/calmodulin-dependent protein kinase II (CaMKII) in single ganglion cells; that dopamine induces Ca2+ influx; that ganglion cell spike firing is inhibited by SKF 83959 as well as by dopamine; and that D1 and D2 antagonists counteract all of these effects. These results provide the first evidence that dopamine and illumination concomitantly activate multiple dopamine receptors in individual adult mammalian retinal ganglion cells and that these activate signaling steps in parallel with the prototypical adenylyl cyclase→cAMP→protein kinase A cascade.
MATERIALS AND METHODS
Animals
Adult rats were used for the studies reported here based on the effect of D1 receptor agonists on retinal ganglion cell excitability (Hayashida et al., 2009) and on the antibody and ligand binding results cited in the introduction. To guard against the possibility that dopamine activates different receptors and signaling cascades at different ages (Fujieda et al., 2003; Rashid et al., 2007), rats of the same age were used in all experiments. P60-P100 Long-Evans rats of either sex were obtained from commercial suppliers (Harlan Bioproducts, San Diego, CA; Charles River Laboratories, Hollister, CA) and housed in standard cages at ~23°C on a 12/12-hour light/dark cycle. Prior to enucleating eyes for all of the experiments described here, rats were anesthetized using ketamine/ xylazine (50 mg/kg and 5 mg/kg), enucleated, and killed by a lethal dose of sodium pentobarbital (150 mg/kg, intraperitoneal [i.p.]). All animal care and experimental protocols were approved by the Animal Use and Care Administrative Advisory Committee of the University of California, Davis.
Whole-cell patch-clamp
To record spikes from dissociated retinal ganglion cell somata, we used dissociation protocols, cell immunopanning by anti-Thy1 antibody, whole-cell patch electrodes, a patch-clamp amplifier (Axopatch 200B; Molecular Devices, Sunnyvale, CA), stimulus generation and data acquisition via pCLAMP software (v. 9.2.1.9, Molecular Devices), ruptured-patch recording mode, U-tube micro-perfusion of solutions, liquid junction potential correction, and grounding via an agar bridge, as described elsewhere (Hayashida et al., 2009; Stradleigh et al., 2011). The recording electrode solution contained (in mM): 115 K D-gluconic acid, 15 KCl, 15 NaOH, 2.6 MgCl2, 0.34 CaCl2, 1 EGTA, 10 HEPES, and 5 glutathione (reduced). The pH of this solution was adjusted to 7.4 by adding methane-sulfonic acid (see below for the source of all chemicals used in this study). The extracellular solution contained (in mM): 125 NaCl, 26 NaHCO3, 1.25 NaH2PO4, 3.5 KCl, 1.0 CaCl2, 2.5 MgSO4, 10 D-glucose, and 0.05 sodium metabisulfite. The pH of this solution was adjusted to 7.4 by bubbling with carbogen (95% O2, 5% CO2). These solutions were designed to contain physiological Na+, K+, and Ca2+ concentrations. The osmolality of these solutions measured 260–280 mmol/kg and 290–310 mmol/kg, respectively. All data were collected at 34–35°C.
Ca2+ imaging
Changes in intracellular free Ca2+ concentration were detected by ratio-imaging fura-2 fluorescence intensity, following a protocol modified from that of Shahlaie et al. (2010). Prior to each imaging session, adult rat retinae were dissociated, cells were immunopanned as in the patch-clamp measurements described here, and fura-2 AM was dissolved in dimethyl sulfoxide and diluted to a final concentration of 5 μM in Neurobasal-A culture medium (supplemented with 2% B-27). The culture medium was replaced by this loading solution for 30–60 minutes at 37°C in the dark, and the loading solution was then replaced by modified DPBS (Dulbecco’s phosphate-buffered saline supplemented with 10 mM D-glucose, 5 mM pyruvate, and 0.05 mM sodium metabisulfite). These cells were transferred to the stage of an inverted microscope, superfused continuously with modified DPBS, and imaged within 6 hours thereafter at 33–37°C. Individual fura-loaded cells were examined with a water-immersion 40× objective (CFI Fluor, NA = 1.00; Nikon, Melville, NY) on the stage of an upright microscope (Eclipse E600FN, Nikon) and excited at 340 and 380 nm delivered from a xenon arc lamp (Lambda LS; Sutter Instruments, Novato, CA) through the epifluorescence port. Fura-2 emission was detected with a digital camera (Cool SNAP-ES; Photometrics, Tucson, AZ) controlled by SimplePCI software (v. 6.0.060805; Hamamatsu, Sewickley, PA). Cells were imaged at a rate of 1 image per 30 seconds while super-fusing dopamine receptor agonists and antagonists over them. The SimplePCI software was then used to calculate ratios of the emission intensities at the two excitation wavelengths to monitor the relative amounts of Ca2+-bound and Ca2+-free fura-2.
Antibody characterization
The species, type, source, and working concentration of primary antibodies used are listed in Table 1. The goat polyclonal anti-arrestin antibody (Santa Cruz Biotechnology, Santa Cruz, CA; sc-34547) was generated against a synthetic peptide corresponding to amino acids 290–320 of human retinal arrestin (P10523). The staining pattern in transretinal (“vertical”) sections matched that observed with other anti-arrestin antibodies in rat retina (Philp et al., 1987). Preincubation with the immunogen reduced binding to tissue below detectable levels (result not illustrated).
TABLE 1.
Summary of Primary Antibodies
| Antibody | Immunogen | Source | Species | Concentration |
|---|---|---|---|---|
| anti-cAMP, clone M486 | cyclic adenosine monophosphate conjugated to keyhole limpet hemocyanin | Abcam (#AB70280) | Mouse IgG1, monoclonal | 1 μg/mL |
| anti-P-CaMKII | CVASMMHRQEtVE, modified from human CaMKII, synthetic phosphopeptide (T286) | Cell Signaling (#3361) | Rabbit IgG, polyclonal | 1:1000 dilution |
| anti-arrestin | a.a. 290-320, human visual arrestin (P10523), synthetic peptide | Santa Cruz (#sc-34547) | Goat IgG, polyclonal | 0.4 μg/mL |
| anti-transducin | a.a. 90-120, human transducin alpha 1 (P11488), synthetic peptide | Santa Cruz (#sc-389) | Rabbit IgG, polyclonal | 0.2 μg/mL |
| anti-Brn3a | a.a. 108-138, human Brn3a (Q01851), synthetic peptide | Santa Cruz (#sc-31984) | Goat IgG, polyclonal | 0.4 μg/mL |
| anti-ChAT | human placental enzyme | Millipore(#AB144P) | Goat IgG, polyclonal | 2 μg/mL |
CaMKII: calcium/calmodulin-dependent protein kinase II; ChAT: choline acetyltransferase
The goat polyclonal anti-Brn3a antibody (Santa Cruz; sc-31984) was generated against a synthetic peptide corresponding to amino acids 108–138 of human Brn3a (Q01851). The staining patterns in vertical sections and flat-mounted preparations matched those found previously in rat retina with this (Nadal-Nicolás et al., 2009) and other (Wang et al., 2011) anti-Brn3a antibodies.
The rabbit polyclonal anti-phospho-CaMKII antibody (Cell Signaling Technology, Beverly, MA; 3361) was generated against a synthetic phosphopeptide corresponding to residues surrounding Thr286 of human CaMKII. Preincubation with the immunogen reduced binding to tissue below detectable levels.
The mouse monoclonal anti-cAMP antibody (Abcam AB70280) was generated against adenosine 3′,5′-cyclic monophosphate conjugated to keyhole limpet hemocyanin. Preincubation with cAMP reduced binding to tissue below detectable levels. The staining pattern in vertical sections matched that observed with other anti-cAMP antibodies in rat retina (Vaquero et al., 2001; Traverso et al., 2002).
The goat polyclonal antibody against choline acetyl-transferase (ChAT; Millipore, Bedford, MA; AB144P) was generated against ChAT extracted from human placenta. The staining pattern in vertical sections matched that found previously in rat retina with this (Fyk-Kolodziej and Pourcho, 2007) and other (Voigt, 1986) anti-ChAT antibodies.
The rabbit polyclonal anti-transducin antibody (Santa Cruz; sc-389) was generated against a synthetic peptide corresponding to amino acids 90–120 of human transducin alpha 1 (P11488). The staining pattern in vertical sections matched that found previously in rat retina with this (Song et al., 2007; Chen et al., 2008) and other (Kim et al., 2005) anti-transducin antibodies.
Immunohistochemistry
The binding of various antibodies was compared in retinae of dark- and light-adapted rats. As in previous studies of light adaptation (e.g., Song et al., 2007), rats were placed in light-tight boxes at 7 PM (ZT12). At 1 PM (ZT6) of the following day (viz., after 18 hours of dark adaptation), one of the boxes was kept dark while the interior of the other box was illuminated for 45 minutes by two arrays of 505-nm, light-emitting diodes (OVLGC0C6B9; Optek Technology, Carrollton, TX) attached to the box ceiling (see Results for additional details). Each rat was then killed (as described above) and enucleated. The eyes were nicked at the limbus with a scalpel blade and immersed for 18–24 hours at 4°C in fixative containing 4% paraformaldehyde, 0.1% glutaraldehyde, 200 mM sucrose, and 1 mM EGTA in sodium borate (33 mM Na2B4O7, pH 10). After rinsing the eyes in a Triton-Tris solution (100 mM Tris-HCl, 0.1% v/ v Triton X-100, pH 8), the retinae were isolated, trimmed with a razor, embedded in agarose (type VIIA, A6560; Sigma-Aldrich, St. Louis, MO), and sectioned on a vibratome (VT1000S; Leica Microsystems, Wetzlar, Germany) at a thickness of 50 μm into pools of Tris-Triton solution. The sections were then incubated for 24 hour at 4°C in a blocking solution containing normal donkey serum (5% v/v in Tris-Triton, pH 8), rinsed in Tris-Triton, and incubated for 48 hours at 4°C in primary antibodies (all diluted in Tris-Triton). The sections were then rinsed in Tris-Triton and incubated overnight at 4°C in donkey, species-specific, fluorophore-conjugated secondary antibodies (715-485-151, 711-505-152, 705-485-147, 705-495-147; Jackson ImmunoResearch Laboratories, West Grove, PA), all diluted in Tris-Triton (typically at 1:500 dilution). The fluorophores were DyLight488, DyLight549, or DyLight649. The sections were then rinsed in Tris-Triton, counterstained for 30 minutes at room temperature in Qnuclear Deep Red Stain (1:500 in Tris-Triton), rinsed in Tris-Triton, mounted to glass coverslips (#1.5), covered with Vecta-shield mounting medium (H-1000; Vector Laboratories, Burlingame, CA), and secured onto glass slides. Flat-mounted and organotypically cultured retinae were aldehyde-fixed and immunostained by the same chemicals, antibodies, and procedural steps as listed above for sectioned retinae.
For negative controls against nonspecific binding, the antibodies directed against cAMP, phospho-CaMKII (P-CaMKII), and arrestin were incubated for 24 hours at 4°C with a 3-fold excess of cAMP (116801; EMD Chemicals, Gibbstown, NJ), P-CaMKII (T286) blocking peptide (1712S, Cell Signaling Technology), and visual arrestin (E-12) peptide (sc-34357P, Santa Cruz Biotechnology), respectively. Pairs of vibratome sections (or pairs of flat-mounted portions) of a given retina were then processed identically except that one was incubated in raw antibody while the other was incubated in the corresponding, blocked antibody.
Confocal imaging
Images of the immunohistochemically stained preparations were obtained by exciting the fluorophores conjugated to the secondary antibodies and confocally imaging the fluorescence emission on a FluoView FV1000 Confocal System (v. 1.6; Olympus, Center Valley, PA) interfaced to an Olympus IX-81 inverted microscope. Data were collected using excitation lasers, objectives, sequential fluorophore excitation, independent fluorescence emission collection, optical section intervals, and frame averaging as described elsewhere (Stradleigh et al., 2011). Images of some fields were also collected with differential interference contrast. Images due to each fluorophore were separated and cropped, and changes in color space were applied as needed using the public domain program ImageJ (v. 1.45, available on the Internet at http://rsb.info.nih.gov/ij/). Any subsequent adjustments to brightness or contrast were performed and overlay images were generated in Photoshop CS4 (Adobe Systems, San Jose, CA).
Organotypic culture
Whole-mount retina cultures (Koizumi et al., 2007) were incubated in darkness, in a light-tight incubator, at 37°C and 5% CO2 for 18–20 hour in culture medium (Neurobasal-A, supplemented with 2% B-27, 1% N-2, 100 U/mL penicillin, 100 U/mL streptomycin, and 1% GlutaMAX. The pH of this solution was adjusted to 7.2–7.3 with NaOH, and the osmolality was adjusted to 290–310 mmol/kg with sucrose). Each retina was supported on a cell culture insert (PICM ORG 50, 0.4 μm Millicell; Millipore, Tuliagreen, Ireland) in the center of a 35-mm tissue culture dish.
Reagents
Reagents were obtained from the following sources: Abbott (Chicago, IL): sodium pentobarbital (0074-378-05); BDH Laboratory Supplies (Poole, UK): CaCl2; EMD Chemicals: tetrodotoxin (584411); Invitrogen (Grand Island, NY): custom B-27 Supplement (0080085-SA), Dulbecco’s phosphate-buffered saline (14040-133 and 14190-144), fura-2 AM (F-1221), GlutaMax (35050-061), Neurobasal-A medium (10888-022), N-2 Supplement (17502-048), penicillin-streptomycin (15140122), Qnuclear Deep Red Stain (Q10363); Jackson Immunoresearch: normal donkey serum (017000121); Lloyd Laboratories (Shenandoah, IA): xylazine (4821); Phoenix Pharmaceutical (St. Joseph, MO): ketamine (2010025); Sigma-Aldrich (St. Louis, MO): bovine serum albumin, fatty-acid free (A8806), dimethyl sulfoxide (D2650), dopamine hydrochloride (H8502), S(−)-eticlopride hydrochloride (E101), formaldehyde (252549), L-glutathione, reduced (G4251), SCH 23390 [R-(+)-7-chloro-8-hydroxy-3-methyl-1-phenyl-2,3,4,5-tetrahydro-1H-3-benzazepine; D054], SKF 83959 [6-chloro-7,8-dihydroxy-3-methyl-1-(3-methylphenyl)-2,3,4,5-tetrahydro-1H-3-benzazepine hydrobromide; S2816], sodium metabisulfite (255556), (S)-(−)-sulpiride (S7771); Ted Pella (Redding, CA): glutaraldehyde (18431); Tocris (Ellisville, MO): raclopride (1810), SCH 39166 [(6aS-trans)-11-chloro-6,6a,7,8,9,13b-hexahydro-7-methyl-5H-benzo[d]naphth[2,1-b]azepin-12-ol hydrobromide]. All other reagents (NaCl, EGTA, HEPES, etc.) were obtained from Sigma-Aldrich. Some of the SKF 83959 used in these experiments was kindly provided by the National Institute of Mental Health Chemical Synthesis and Drug Supply Program (Research Triangle Park, NC).
RESULTS
This study used whole-cell patch clamp recording, ratiometric fluorescence imaging, and immunohistochemistry to test whether dopamine activates D1- and D2-type dopamine receptors in adult rat retinal ganglion cells.
D1- and D2-type receptor antagonists
We began by testing whether D1 and D2 receptor antagonists block receptor activation by dopamine, while assaying receptor activation by dopamine-induced losses of spikes. To ensure that we measure effects mediated by receptors on ganglion cells (Hayashida et al., 2009) rather than receptors on cells presynaptic to ganglion cells (Pourcho, 1982; Thier and Alder, 1984), and to preclude the possibility that responses are influenced by endogenously released dopamine (Dearry and Burnside, 1986; Ribelayga et al., 2002; Hu et al., 2010), spikes were recorded in dissociated single cells. Figure 1 shows spikes elicited by 100-ms injections of small, intermediate, and larger constant currents (20, 30, and 40 pA, respectively). These are displayed in successive rows in the order they were recorded, starting from the top of the left-hand column. As labeled at the left side of each column of traces, the solution perfused over the cell was changed from control to 5 μM dopamine, to 5 μM dopamine plus 5 μM eticlopride, back to 5 μM dopamine, and finally to 5 μM dopamine plus 5 μM SCH 23390. These traces show that, at steady state, 1) dopamine inhibited spiking at all three stimulus intensities; 2) the inhibition showed no sign of weakening during maintained application of dopamine; 3) the loss of spikes was reversed by a D2 antagonist (eticlopride) and by a D1 antagonist (SCH 23390); and 4) the number of spikes elicited in the presence of the antagonists did not exceed those elicited in the control solution. In the course of suppressing spikes, dopamine inhibited spike firing elicited by the lowest stimulus intensities before those elicited by stronger stimuli, and each current injection elicited progressively fewer spikes than in the control solution. Conversely, antagonists reversed the inhibition of spike firing elicited by the stronger stimulus intensities before those elicited by the weaker stimuli. We recorded similar effects in a total of six cells. In four of these, the inhibition of spiking by dopamine (5 μM) was reversed by eticlopride (1 μM, n = 2; 5 μM, n = 2) and by SCH 23390 (1 μM, n = 2; 2 μM, n = 1; 5 μM, n = 1). In two additional cells, the inhibition of spiking by dopamine (5 μM) was reversed by a different D2 antagonist, raclopride (1 μM, n = 1; 2 μM, n = 1; e.g., Fig. 2A). The antagonist concentrations used in these experiments have been found in other studies to selectively inhibit responses mediated by homomeric D1 and D2 dopamine receptors (Lee et al., 2004; Rashid et al., 2007).
Figure 1.

Eticlopride and SCH 23390 block inhibition of spike firing by dopamine. Voltage responses to 100-ms constant-current injections in a single, dissociated retinal ganglion cell. Ruptured-patch, whole-cell mode at 35°C. Injection timing and intensity (20–40 pA) are indicated above the first row of traces and were identical in all other rows. Recordings displayed in the order they were collected, from upper left to lower right. Elapsed time indicated along the left side of each column of traces. Dopamine (5 μM), eticlopride (5 μM), and SCH 23390 (5 μM) included in superfusate as labeled next to each row of traces. First three rows show consistency and frequencies of spiking elicited in control solution. Dopamine inhibits this spiking, and both eticlopride and SCH 23390 block this inhibition. Note that dopamine was applied continuously from the fourth row of spikes (t = 2 min) until the end of the recording (lower right corner), and the antagonists were added to the dopamine-containing superfusate.
Figure 2.
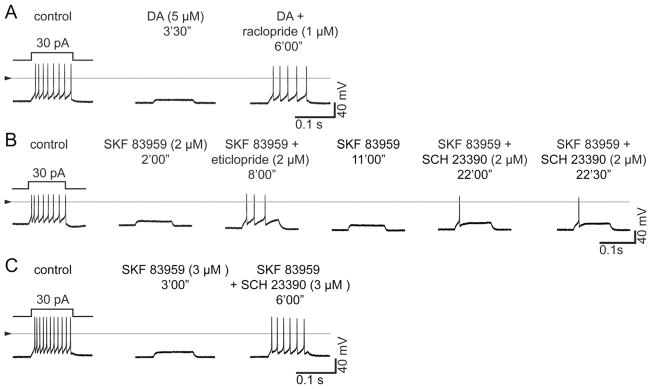
Block of spike firing inhibition by dopamine and by SKF 83959. Recording conditions as in Figure 1. Each row (A–C) shows voltage responses of a single dissociated retinal ganglion cell to 100-ms constant-current injections in solutions as labeled. Triangles and horizontal lines mark ground level for each row of recordings. (A) Spikes in control solution (left), inhibition of spike firing by dopamine (5 μM, middle), and reversal of this inhibition by raclopride (1 μM) (right). (B) Inhibition of spike firing by SKF 83959 (2 μM) is counteracted by eticlopride (2 μM) and by SCH 23390 (2 μM). After the control spikes were recorded in A–C, the indicated agonists (dopamine, SKF 83959) were continuously superfused over the cells recorded from for the remainder of each recording. Antagonists were applied together with the agonist and were washed away with agonist-containing superfusate. The inhibition of spiking is partially reversed by each antagonist at the concentrations shown. Repeated current injections confirm that SCH 23390 counteracts the inhibition by SKF 83959 (B). A fuller reversal of the SKF 83959 response was achieved with 3 μM SCH 23390 (C).
The ability of both D1 and D2 antagonists to counteract the dopaminergic inhibition of ganglion cell spiking resembles effects found in mouse striatal neurons and in heterologously expressed heteromeric combinations of D1- and D2-type dopamine receptors (Rashid et al., 2007; Hasbi et al., 2010). Although dopamine would be expected to activate heteromeric and homomeric dopamine receptors, the synthetic agonist SKF 83959 activates two of the heteromers reported to date (D1–D2 and D2–D5) without activating homomeric D1 receptors (Panchalingam and Undie, 2001; Jin et al., 2003; Rashid et al., 2007; Hasbi et al., 2010). We therefore tested whether SKF 83959 inhibits ganglion cell spike firing, and whether this response is antagonized by D1 and D2 antagonists. Figure 2B shows that SKF 83959 (2 μM) inhibits spiking in ganglion cells. As with dopamine, this inhibition showed no sign of weakening during maintained SKF 83959 applications (not illustrated). Figure 2B shows that the SKF 83959 response was counteracted by eticlopride (2 μM) and by SCH 23390 (2 μM). At the concentrations used, these antagonists did not completely return spiking to control levels. However, 1) this was also found with the low concentration of raclopride used in Figure 2A and with SCH 23390 in Figure 1; 2) repeated current injections confirmed that SCH 23390 counteracted the inhibition by SKF 83959 (Fig. 2B); and 3) a fuller reversal of the SKF 83959 response was achieved with 3 μM SCH 23390 (Fig. 2C) and by washing with agonist-free solution (not illustrated). Figure 2C shows also that SKF 83959 can reduce spike firing, and that SCH 23390 can counteract this response, without changes in resting potential. This is consistent with effects of dopamine, SKF 38393, and SCH 23390 on other ganglion cell preparations (Liu and Lasater, 1994; Vaquero et al., 2001; Hayashida et al., 2009).
We recorded similar effects in a total of six cells. In one of these, the inhibition of spiking by SKF 83959 (2 μM) was counteracted by SCH 23390 (3 μM) and by a different D2 antagonist (sulpiride, 2 μM; not illustrated); in three other cells, the response to SKF 83959 (2 or 3 μM) was counteracted by SCH 23390 (2 μM, n = 1 cell; 3 μM, n = 2 cells); and in two additional cells, the SKF 83959 response was counteracted by sulpiride (2 μM SKF 83959, 2 μM sulpiride, n = 1 cell; 6 μM SKF 83959, 6 μM sulpiride, n = 1 cell).
Ca2+
The abilities of dopamine and SKF 83959 to inhibit spike firing, and of D1 and D2 antagonists to counteract these responses, raise the possibility that dopamine activates a mixture of receptors (e.g., D1 and D1–D2, or D1 and D2–D5) in retinal ganglion cells. SKF 83959 is useful for distinguishing these possibilities because it can elevate intracellular Ca2+ by activating D1–D2 receptors in the absence of extracellular Ca2+ (Lee et al., 2004; Rashid et al., 2007) and its ability to raise intracellular Ca2+ by activating D2–D5 receptors is diminished by the removal of extracellular Ca2+ (So et al., 2009; Hasbi et al., 2010). Moreover, the Ca2+ increases mediated by these heteromeric receptors are antagonized by SCH 23390 and by eticlopride (Rashid et al., 2007; So et al., 2009). We therefore tested whether dopamine and SKF 83959 alter intracellular free Ca2+, whether the changes are blocked by D1 and D2 antagonists, and whether the changes require extracellular Ca2+. As in other studies, we monitored changes in intracellular Ca2+ from the ratio of fura-2 fluorescence intensities within the profiles of dissociated cells at two excitation wavelengths (340 and 380 nm). In a total of six cells plated from three dissociations, these ratios rose to 171 ± 25% (mean ± SEM) of the control values within 4 minutes after application of dopamine (5 μM). Figure 3A shows that addition of either SCH 23390 (5 μM) or eticlopride (5 μM) counteracted these increases in a single ganglion cell, lowering the Ca2+ to levels indistinguishable from those measured in control saline. In 2-tailed paired t-tests, the differences between the fluorescence intensity ratios for each cell measured in control and dopamine were statistically significant (P < 0.05), and we found no statistically significant difference between the control values and those measured after addition of either SCH 23390 or eticlopride to the dopamine-containing medium (P = 0.4 for control vs. SCH 23390, Fig. 3B; P = 0.5 for control vs. eticlopride; Fig. 3C).
Figure 3.

SCH 23390 and eticlopride block increases in intracellular free Ca2+ by dopamine and by SKF 83959. A: Continuous plot of fluorescence intensity ratio (340/380 nm) of fura-2 (Ca2+-bound/Ca2+-free) in single retinal ganglion cell. Cell is continuously superfused with saline at 33°C. Dopamine (DA, 5 μM), SCH 23390 (5 μM), and eticlopride (5 μM) were included in superfusate during times indicated by horizontal bars under fluorescence ratio plot. Dopamine elevates free Ca2+, and both SCH 23390 and eticlopride suppress this increase. Note that dopamine was applied continuously from t = 250 seconds until t = 1,400 seconds, and that each dopamine receptor antagonist reduces Ca2+ back to the control level. After washing away the dopamine and eticlopride, dopamine elicits a third increase in Ca2+ with a peak and rate of rise similar to that of the first response. Summary of measurements obtained in all imaging sessions with dopamine and SCH 23390 (B, n = 6 cells) and dopamine and eticlopride (C, n = 3 cells). Fluorescence intensity ratios in test solutions are normalized for each cell to value measured in control solution. Height of bars plot means. Error bars plot 1 SEM. D: Continuous plot of fura-2 fluorescence intensity ratio, measured and formatted as in (A). SKF 83959 (3 μM) and dopamine (DA, 5 μM) included in superfusate during times indicated by horizontal bars. Both agonists increase free Ca2+, and these rises are reversed by washing with agonist-free solution. In this and other figures the response to SKF 83959 rose as quickly as the response to dopamine, but typically reached a smaller peak amplitude. E: Summary of dopamine and SKF 83959 response amplitudes (n = 4 cells, normalized and formatted as in B) shows that both agonists produced statistically significant increase in fluorescence intensity ratio. F: Continuous plot of fura-2 fluorescence intensity ratio, measured and formatted as in (A). SKF 83959 (3 μM) and eticlopride (3 μM) included in superfusate during times indicated by horizontal bars. G,H: Summary of peak intensity ratios (normalized and formatted as in A) show that SKF 83959 produced statistically significant increase in fluorescence intensity ratio and that these ratios were reduced to control levels by eticlopride (G, n = 5 cells) and by SCH 23390 (H, n = 4 cells).
In a total of 14 cells plated from 12 dissociations, the fura-2 fluorescence intensity ratios rose to 135 ± 11% (mean ± SEM; P = 0.005, 2-tailed paired t-tests) of the control values within 4 minutes after application of SKF 83959 (3 μM). Cells that responded to dopamine also responded to SKF 83959 (n = 4 cells, plated from three dissociations; Fig. 3D). Moreover, the response to SKF 83959 (3 μM) was suppressed by eticlopride (3 μM; Fig. 3F,G) and by SCH 23390 (3 μM; Fig. 3H). The SKF 83959 responses tended to be smaller than those elicited by dopamine, even when both were measured in single cells (e.g., Fig. 3D,E). However, we did not test the basis of this, because high agonist concentrations activated responses which we could not reverse with antagonists or by extended periods of washing with agonist-free solutions (not illustrated), and because we were unable to maintain stable recordings long enough to compare responses of single cells to different doses of both agonists.
To test the Ca2+-dependence of these responses, we used dopamine (because it is the agonist released in vivo) and lowered the extracellular Ca2+ level from 1.0 mM to 0.1 mM (by equimolar Mg2+ substitution in order to avoid changes in surface potential or membrane permeability). Figure 4 shows that dopamine elevated intracellular Ca2+ slightly, if at all, in the low Ca2+ medium, but elicited a robust Ca2+ increase when the extracellular Ca2+ was raised to 1.0 mM. This result is consistent with a dopamine-activated influx of extracellular Ca2+ and, in turn, the possibility that dopamine activates D2–D5 receptors, rather than D1–D2 receptors, in ganglion cells.
Figure 4.
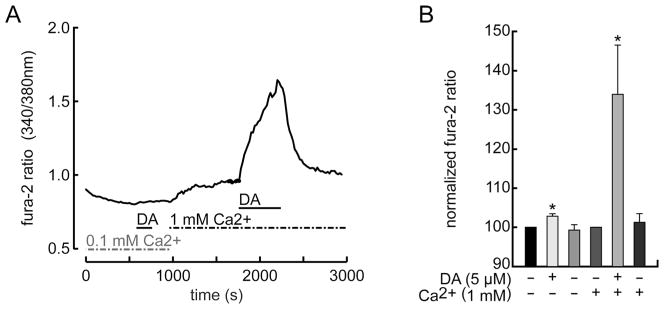
Elevation of intracellular Ca2+ depends on extracellular Ca2+. A: Continuous plot of fura-2 fluorescence intensity ratio, measured and formatted as in Figure 3. Dopamine (DA, 5 μM, at t = 600–750 sec) barely increases free Ca2+ after extracellular Ca2+ is lowered from 1.0 mM to 0.1 mM, but elicits robust increase in Ca2+ after extracellular Ca2+ is raised back to 1 mM. B: Summary of peak intensity ratios (normalized and formatted as in Fig. 3) shows that dopamine response was markedly reduced by reducing extracellular Ca2+ from 1.0 to 0.1 mM (n = 4 cells).
Because dopamine receptor agonists can elevate free intracellular Ca2+ concentration by activating phospholipase Cβ (PLCβ) and inositol trisphosphate (IP3) receptors (Neve et al., 2004), we tested whether dopamine raises Ca2+ in cells exposed to reagents that inhibit either PLC (U-73122 and edelfosine) or IP3-mediated Ca2+ release (2-aminoethoxydiphenylborate, 2-APB) in other preparations (Lee et al., 2004; Horowitz et al., 2005; Rashid et al., 2007; Patel et al., 2009). Figure 5A shows that dopamine (5 μM) failed to elevate Ca2+ in the presence of 30 μM 2-APB, but elicited clear increases in Ca2+ prior to the application of 2-APB and also a few minutes after washing the 2-APB-exposed cells with control solution. Figure 5B shows that, in a total of seven cells plated from three dissociations, the fura-2 fluorescence intensity ratio rose to 154 ± 21% (mean ± SEM, paired t-test, P < 0.05) of the control values after application of dopamine (5 μM) prior to the application of 2-APB, did not rise in the presence of 10–30 μM 2-APB, and then rose to 137 ± 15%, (mean ± SEM, paired t-test, P < 0.05) of the control values after washing in 2-APB-free control saline for 15–30 minutes. By contrast, U-73122 and edelfosine elevated Ca2+ in the absence of dopamine (results not illustrated). Because these Ca2+ rises were often irreversible and as large as those elicited in other cells by dopamine, we did not test whether dopamine increased Ca2+ after exposure to either U-73122 or edelfosine. Although unusual, previous studies have also reported that U-73122 and edelfosine produced side effects unrelated to PLC inhibition (Won et al., 2009), including agonist-independent Ca2+ increases (Horowitz et al., 2005).
Figure 5.
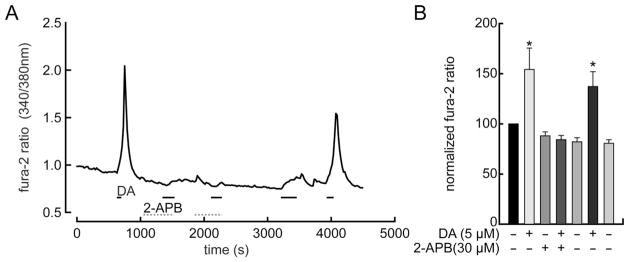
2-APB blocks elevation of intracellular Ca2+ by dopamine. A: Continuous plot of fura-2 fluorescence intensity ratio, measured and formatted as in Figure 3. Dopamine and 2-APB are added to superfusate during times indicated by horizontal bars. Due to multiple applications, time-base is slower than in other figures. First application of dopamine (DA, 5 μM) reversibly elevates intracellular free Ca2+ in control solution. Twenty μM 2-APB reduces Ca2+ rise by second dopamine application. Thirty μM 2-APB completely precludes Ca2+ increase by third dopamine application. After washing with control saline for ~1,000 seconds, dopamine elicited a small increase in Ca2+ (at t = 3,300 sec). Ca2+ returned to the baseline level after washing with control saline. The final dopamine application (around t = 4,000 sec) elicited a robust and fully reversible Ca2+ increase. B: Summary of peak intensity ratios (normalized and formatted as in Fig. 3) shows that the dopamine response was suppressed by 2-APB, that this suppression was reversed by washing with control solution, and that 2-APB by itself did not reduce intracellular Ca2+ level below control levels (n = 7 cells).
cAMP and CaMKII
Because illumination increases endogenous dopamine release (Kramer, 1971; Witkovsky et al., 1993), we next tested whether light altered signaling cascade component levels in retinal ganglion cells in vivo, and whether SCH 23390 and eticlopride blocked these changes. We chose to test for changes in cAMP because previous studies found that 1) rat retinal ganglion cells bind antibodies against D1 receptors (Hayashida et al., 2009); 2) dopamine increased the number and intensity of cells stained by anti-cAMP antibody in the ganglion cell layer of turtle (Liu and Lasater, 1994) and goldfish (Vaquero et al., 2001) retinae; and 3) dopamine increased the fluorescence intensity of a cAMP-dependent protein kinase (PKA) activity reporter expressed in neonatal rat retinal explants (Dunn et al., 2006). In the same retinae, we tested for changes in phosphorylated Ca2+/calmodulin-dependent protein kinase (P-CaMKII) because SKF 83959-induced rises in Ca2+ have been found to trigger CaMKII phosphorylation (Rashid et al., 2007; Ng et al., 2010) and previous studies detected CaMKII in rat retinal ganglion cells (Bronstein et al., 1988; Terashima et al., 1994). For both tests, we opted against using the fluorescent dyes and fluorophore-conjugated indicators that are currently available for monitoring changes in cAMP and Ca2+ (Dunn et al., 2006; Berrera et al., 2008) to avoid direct and indirect activation of photoreceptors (Euler et al., 2009) and of dopamine release. Instead, we used immunohistochemical methods to compare the number and intensity of cells that bound antibodies directed against cAMP (Liu and Lasater, 1994; Vaquero et al., 2001; Traverso et al., 2002) and Thr286-phosphorylated CaMKII (Wayman et al., 2011) in dark- versus light-adapted retinae.
In each experiment, two groups of rats were dark-adapted overnight in light-tight enclosures. One group (the “light-adapted” rats) was then illuminated for 45 minutes by light-emitting diode (LED) arrays attached to the enclosure ceiling, while the “dark-adapted” rats remained in darkness. The output of one array was constant and measured 1 μW/cm2 (1.3 lux) while the output of the other array fluctuated sinusoidally at 2 Hz, between 0 and 16 μW/cm2 (0–46 lux) at the walls near the enclosure floor. The LEDs emitted maximally between 499 and 511 nm to stimulate at and near the peak spectral sensitivity of rat rods and M cones (Deegan and Jacobs, 1993), the irradiance was within the range that stimulates dopamine synthesis and utilization in rat retina (Brainard and Morgan, 1987), and the fluctuation rate was previously shown to increase endogenous dopamine release (Kramer, 1971; Mills et al., 2007). The retinae of the dark-and light-adapted rats were then collected under dim light (0.87 μW/cm2) provided by a 650-nm LED. Figure 6 shows that anti-cAMP and anti-P-CaMKII antibodies did not bind to somatic profiles in the ganglion cell layer of dark-adapted rats (Fig. 6A,B,D), but that the fluctuating-plus-steady illumination stimulated an increase in the binding of both antibodies (Fig. 6F,G,I). The cAMP-like immunoreactivity increased throughout the cytoplasm of ganglion cell layer somata and in small (~1 μm) points throughout the inner plexiform layer (Fig. 6F,I,K). Preincubation of the cAMP antibody with cAMP (Vaquero et al., 2001) reduced binding of the primary and associated secondary antibodies (Fig. 6K) to undetectably low levels (Fig. 6L).
Figure 6.

Light elevates cAMP and activates CaMKII in retinal ganglion cell somata. Vertical vibratome sections of dark- and light-adapted retinae collected and processed side-by-side; immunostained for cAMP, phosphorylated CaMKII, cell markers, and a nuclear stain. Fields are confocally imaged under epifluorescence illumination (A–D,F–I,K–N) or differential interference contrast (DIC) illumination (E,J). One optical section of a dark-adapted retina with the cAMP-, P-CaMKII-, and choline acetyltransferase (ChAT)-like immunoreactivities assigned to the green (A,C,D), red (B,D), and blue (D) channels, respectively. The green, red, and blue channels are merged in D. E: The DIC image of the same field as in A–D. The retinal sublayers in A–D match those in E, namely IS (inner segments), ONL (outer nuclear layer), INL (inner nuclear layer), IPL (inner plexiform layer), and GCL (ganglion cell layer). C: Imaged at a higher photomultiplier gain than A to show the cAMP signal in the photoreceptor inner segment layer. F–J show a light-adapted retina, formatted identically as in A–E. F–I are imaged at identical confocal microscope settings as corresponding panels in A–D. Light adaptation increases number and intensity of cells binding cAMP and P-CaMKII antibodies in the ganglion cell layer, without noticeably changing the intensity or characteristic pattern of ChAT antibody binding in IPL (D,I). Illumination elevates cAMP in the cytoplasm of ganglion cell layer somata, elevates P-CaMKII in cytoplasm and nuclei of the same somata (e.g., those at blue arrowheads), and lowers cAMP staining in the IS. K–N are paired sections of light-adapted retinae, bound to Brn3a and either cAMP or P-CaMKII antibodies, stained with a nuclear stain (Qnuclear), imaged at identical settings, and oriented as in A-J. Pairs compare binding of cAMP antibody (K) and cAMP antibody preincubated in cAMP (L), and P-CaMKII antibody (M) and P-CaMKII antibody preincubated in immunogen (N). All three color channels are merged in each panel, showing cAMP elevation (K) and CaMKII activation (M) by illumination in Brn3a-immunopositive ganglion cells, and the absence of detectable binding of cAMP antibody preincubated in cAMP (L) and of P-CaMKII antibody preincubated in immunogen (N) despite light-adaptation. A magenta-green copy of this figure is available online as Supporting Information. Scale bar = 20 μm in F (applies to all).
The fluctuating-plus-steady light also increased P-CaM-KII-like immunoreactivity in the cytoplasm and nuclei of ganglion cell layer somata (Fig. 6G,I,M). Preincubation of the P-CaMKII antibody with immunogen reduced binding of the primary and associated secondary antibodies (Fig. 6M) to undetectably low levels (Fig. 6N). Figure 6B shows that the P-CaMKII-like immunoreactivity is so low in the dark-adapted ganglion cell layer that the somata appear to be missing, although they are seen in the differential interference contrast image of the same field (Fig. 6E). Because the staining for choline acetyltransferase was similarly bright in the inner plexiform layer of the dark-and light-adapted retinae (compare Fig. 6D,I), differences in other immunoreactivities (between dark- and light-adapted retinae) are unlikely to be due to differences in antibody diffusion through these preparations.
In the preparations that bound anti-cAMP and anti-P-CaMKII antibodies (e.g., Fig. 6K,M), somata were identified as ganglion cells based on their Brn3a-like immunoreactivity (Nadal-Nicolás et al., 2009) and somata throughout the ganglion cell layer were stained by Qnuclear. In a total of nine (nonserial) vibratome sections cut from light-adapted retinae, we found a total of 107 Qnuclear-stained ganglion cell layer somata; 54 of these were Brn3a-immunopositive (i.e., ganglion cells) and, of these, 52 (i.e., 96%) were cAMP-immunopositive. Thirty-five other cAMP-immunopositive somata were found in these sections and these were Brn3a-immunonegative. In a total of two (non-serial) vibratome sections cut from light-adapted retinae, we found a total of 47 Qnuclear-stained ganglion cell layer somata; 25 of these were P-CaMKII-immunopositive and, of these, 23 (i.e., 92%) were Brn3a-immunopositive. Two other P-CaMKII-immunopositive somata were found in these sections and these were Brn3a-immunonegative. Double-labeled preparations showed that P-CaMKII-like immunoreactivity increased in the cytoplasm and nuclei of the ganglion cell layer somata that displayed an increase in cAMP-like immunoreactivity (e.g., those near the arrowheads in Fig. 6G,I). These colocalizations, plus the cAMP- and P-CaMKII immunoreactivity of Brn3a-immunopositive ganglion cells (Fig. 6K,M), provide evidence that light elevates cAMP and P-CaMKII levels in individual ganglion cells.
Changes in three markers provide independent evidence that the retina in Figure 6A–E was dark-adapted, and that the retinae in Figure 6F–N were light-adapted. First, illumination decreased cAMP-like immunoreactivity in the photoreceptor inner segments (Fig. 6C,E,H,J), consistent with observations in other species (Farber et al., 1981; Cohen et al., 1992; Vaquero et al., 2001; Traverso et al., 2002). Second, illumination decreased arrestin-like immunoreactivity in the photoreceptor inner segment layer and increased it in the photoreceptor outer segment layer (Fig. 7A,C,D,F), consistent with translocation from the inner to outer segments (Calvert et al., 2006). Third, comparison of Figure 7B,C vs. E,F shows that light reduced transducin-like immunoreactivity in the photoreceptor outer segments (Calvert et al., 2006).
Figure 7.

Light adaptation of distal retina by illumination that alters cAMP and P-CaMKII in ganglion cells. A–C: Single vertical vibratome section of the same dark-adapted retina as in Figure 6A–E. D–F: Single vertical vibratome section of the same light-adapted retina as in Figure 6F–J. Sections are immunostained for arrestin (green) and transducin (red), and counterstained with Qnuclear (blue). C,F: Merge arrestin, transducin, and Qnuclear panels of dark- and light-adapted retinae, respectively. Each pair of images (A/D, B/E) was confocally imaged at identical settings. A,C,F: Arrestin immunoreactivity in inner segment layer of dark-adapted retina but not in light-adapted retina. Comparison of A vs. D, B vs. E, C vs. F shows that light adaptation increases intensity of arrestin staining and concomitantly decreases intensity of transducin staining in outer segment layer. Retinal layers labeled in C and F as in Figure 6. A magenta-green copy of this figure is available online as Supporting Information. Scale bar = 20 μm in B (applies to all).
Results similar to those in Figures 6 and 7 were obtained in each of three experimental sessions in which the rats were awake and unanesthetized during the dark and light adaptation steps. Although the light intensities reaching the retinae in these animals may have varied due to movement, we did not test whether illumination produces similar effects in animals immobilized by anesthetics, to avoid effects on dopamine release (Masuzawa et al., 2003), dopamine responses (Seeman and Kapur, 2003), and/or retinal ganglion cell spiking (Schmidt and Creutzfeldt, 1968).
Lastly, we tested whether D1 and D2 antagonists preclude the increases in cAMP and P-CaMKII immunoreactivity produced by illumination. Because intraperitoneally injected D1 antagonists block dopamine responses in various brain regions (Terry and Katz, 1994), we tested whether intraperitoneal injections of either SCH 23390 or SCH 39166 into dark-adapted rats 15–60 minutes prior to light onset prevented light-induced increases in cAMP and P-CaMKII immunoreactivity. These injections failed to produce consistent effects. This was not entirely surprising because previous studies (Jensen and Daw, 1986) showed that D2 antagonists alter ganglion cell spiking and light responses if applied by superfusion but not if administered intraarterially. We therefore tested whether D1 and D2 antagonists block the light response of ganglion cells in isolated retinae. Figure 8 shows that fluctuating-plus-steady 505-nm light (identical to that used in the whole-animal experiments above) increased the cAMP and P-CaMKII immunoreactivity of ganglion cell layer somata (compare Fig. 8A vs. E; B vs. F; C vs. G) in retinae maintained in complete darkness overnight in organotypic culture (Koizumi et al., 2007), and that the increases in both of these signals were reduced by application of either 6 μM SCH 23390 (compare Fig. 8I–L vs. E–H) or 6 μM eticlopride (compare Fig. 8M–P vs. E–H) in absolute darkness 5 minutes prior to the onset of illumination. We did not test whether SKF 83959 reduces elevation of cAMP by SKF 81297 (Jin et al., 2003).
Figure 8.

D1 and D2 antagonists block light-induced cAMP increase and CaMKII activation in situ. Flat-mounted retinae maintained overnight in absolute darkness by organotypic culture and immunostained for cAMP and P-CaMKII. These retinae were dissected, cultured, processed, and imaged together. Each row shows a different retina, confocally imaged at the ganglion cell layer. Each field is 10,627 μm2 and merges four serial optical sections (0.44-μm steps). As labeled at the left of each row, A–D was aldehyde-fixed in darkness; E–H was illuminated (as in Figs. 6, 7) for 45 minutes prior to fixation; I–L was exposed to 4 μM SCH 23390 in darkness for 5 minutes, illuminated for 45 minutes (with an additional 2 μM SCH 23390 added), then aldehyde-fixed; and M–P was exposed to 4 μM eticlopride in darkness for 5 minutes, illuminated for 45 minutes (with an additional 2 μM eticlopride added), then aldehyde-fixed. As labeled at the top of the figure, A,E,I,M show the cAMP-like immunoreactivity in these retinae; B,F,J,N show the P-CaMKII-like immunoreactivity in the same fields; C,G,K,O merge the cAMP and P-CaMKII fields; and, on top of these, D,H,L,P show the cells stained by Qnuclear. A magenta-green copy of this figure is available online as Supporting Information. Scale bar = 20 μm in P (applies to all).
Results similar to those in Figure 8 were obtained in each of three experimental sessions in which the retinae exposed to the different conditions (darkness alone; darkness then illumination; receptor antagonists prior to and during illumination) were either sliced portions of a single retina, retinae of both eyes of single rats, or retinae isolated from different rats. Multiple fields were imaged in each retina to test for consistency of the immunostaining patterns in each experimental condition. In the light-adapted fields (n = 11, total area = 0.49 mm2, not counting blood vessels), a total of 1,729 ganglion cell layer somata were stained by Qnuclear, and 73% of these (n = 1,254) were both cAMP- and P-CaMKII-immunopositive. The density of these immunopositive cells (~2500 cells/ mm2) is less than the maximum ganglion cell density found in adult rat (Reese and Cowey, 1986; McCall et al., 1987). However, the percent (73%) is greater than the fraction of the ganglion cell layer somata that has been identified as ganglion cells rather than displaced amacrine cells (Perry, 1981).
DISCUSSION
Dopamine modulates retinal function on a global scale. Although the full extent of this control is not yet known in any species, dopamine has been found to alter biophysical properties of at least some members of every cell class, and to regulate membrane proteins ranging from Na+-K+-ATPase and connexins to Na+, Ca2+, K+, mixed-cation, and Cl− channels gated by cGMP, cAMP, voltage, glutamate, and/or GABA. Whereas each of these effects has been reported to be mediated by either a D1 or D2 receptor, and to involve a change in cAMP concentration, the present study provides evidence that, in adult mammalian retinal ganglion cells, dopamine activates multiple receptors and, in turn, a signaling cascade in parallel with an adenylyl cyclase→cAMP→PKA sequence. Cascades consistent with the results published to date are discussed below, along with functional advantages they might confer.
Multiple signaling cascades
Dopamine appears to activate two pairs of signaling components in retinal ganglion cells: cAMP and PKA, and Ca2+ and CaMKII. The primary lines of evidence for the former are that 1) membrane-permeable cAMP analogs and an adenylyl cyclase activator mimic effects of dopamine (Liu and Lasater, 1994; Stellwagen et al., 1999; Vaquero et al., 2001; Hayashida and Ishida, 2004; Chen and Yang, 2007; Hayashida et al., 2009; Van Hook et al., 2012); 2) an inhibitor of transmembrane adenylyl cyclases (2′,5′-dideoxyadenosine) blocks the elevation of cAMP by dopamine (Dunn et al., 2009); 3) dopamine activates PKA (Dunn et al., 2006); and 4) PKA inhibitors preclude dopamine responses (Liu and Lasater, 1994; Vaquero et al., 2001; Chen and Yang, 2007; Van Hook et al., 2012). These responses have displayed two similarities. First, dopamine has elevated cAMP and activated PKA, regardless of species and at different ages (Figs. 6, 8; see also Liu and Lasater, 1994; Stellwagen et al., 1999; Vaquero et al., 2001; Dunn et al., 2006; Chen and Yang, 2007). Second, some of the adenylyl cyclase activated by dopamine appears to be Ca2+-insensitive because dopamine inhibits spiking under conditions that block voltage-gated Ca2+ influx (Vaquero et al., 2001; Hayashida and Ishida, 2004; Chen and Yang, 2007; Hayashida et al., 2009) and reduce dopamine-activated rises in Ca2+ (Fig. 4).
In parallel with this cascade, our results show that dopamine also elevates intracellular free Ca2+ levels (Figs. 3–5), that light adaptation increases P-CaMKII immunoreactivity in ganglion cells (Fig. 6), and that D1 and D2 antagonists block this Ca2+ rise (Fig. 3) and CaMKII activation (Fig. 8). This is consistent with the elevation of Ca2+ by dopamine in neonatal rat retinal ganglion cell layer somata (Stellwagen et al., 1999) and with the presence of calmodulin and CaMKII in adult rat retinal ganglion cell layer somata (Wood et al., 1980; Bronstein et al., 1988; Yoshida et al., 1996). Our findings that light adaptation activates CaMKII is of particular interest for two reasons.
One is that dopamine activates CaMKII more rapidly than PKA, at least in heterologously expressed homomeric and heteromeric receptors (Lee et al., 2004; Rashid et al., 2007). It is not yet known how quickly dopamine activates these kinases in ganglion cells or how quickly ganglion cells can respond to dopamine. To date, we and others have only found slow and sustained responses (e.g., Fig. 1; see also Thier and Alder, 1984; Liu and Lasater, 1994; Feigenspan and Bormann, 1994; Hayashida and Ishida, 2004; Hayashida et al., 2009), and presume these are sufficient given the sustained release of dopamine during daylight hours (Witkovsky et al., 1993). At the same time, the light fluctuations that release dopamine in situ (Fig. 8; also Kramer, 1971; Mills et al., 2007) would be expected to cause membrane potential fluctuations in ganglion cells. Because these may partially inactivate voltage-gated currents that contribute to ganglion cell spiking (Kim and Rieke, 2003; Hayashida and Ishida, 2004), it will be of interest to compare the speeds at which dopamine and voltage fluctuations modulate excitability when methods for doing so become available.
Second, our detection of P-CaMKII in light-adapted ganglion cell nuclei and cytoplasm (Fig. 6) suggests that dopamine exerts an even broader range of influences than previously thought. Because light adaptation elevated cAMP and activated CaMKII in individual ganglion cells (Figs. 6, 8), cytoplasmic PKA and CaMKII might coordinate to control net phosphorylation levels; alternatively, CaMKII might phosphorylate proteins at different sites than PKA and/or proteins besides those listed above (e.g., Lisman et al., 2012). However, because light adaptation also generated P-CaMKII in ganglion cell nuclei (Figs. 6, 8), our results contrast with the cytoplasmic localization of calmodulin (Pochet et al., 1991) and raise the possibility that dopamine phosphorylates nuclear proteins as well as cell membrane proteins. One possibility is cAMP-response element binding protein, known to be phosphorylated by flashing light (Yoshida et al., 1995) and by CaMKII (Takeda et al., 2007) in the rat retinal ganglion cell layer. Consistent with the possibility that this light response occurs in other species, anti-P-CaMKII antibodies also bind to the cytoplasm and nuclei of ganglion cell layer somata in mouse retina (Hauck et al., 2006).
D1 and D2–D5 receptors
Comparisons with heterologously expressed dopamine receptors and other central neurons suggest that two types of receptor might mediate adult rat retinal ganglion cell responses to dopamine. One is D1 (a.k.a. D1a), based on the binding of monoclonal and polyclonal antibodies directed against amino acid sequences in the rat D1 receptor but not the rat D5 (a.k.a. D1b) receptor (Hayashida et al., 2009). Our finding that SCH 23390 blocks light-induced elevation of cAMP in ganglion cells is consistent with this receptor type, because SCH 23390 binds to D1 receptor protein in rat retina (Makman and Dvorkin, 1986), D1a receptors characteristically activate adenylyl cyclases (Neve et al., 2004), and enzyme-linked immuno-assays have shown that SCH 23390 blocks the elevation of cAMP by dopamine in rat retinal ganglion cells (G.J. Partida, H. Oi, C.S. Lester, and A.T. Ishida, unpubl. obs.).
The other is a heterooligomeric D2–D5 receptor (So et al., 2009; Hasbi et al., 2010), based on the inhibition of spike firing by SKF 83959 (Fig. 2), the blockade of agonist responses by D1 and D2 antagonists (SCH 23390, eticlopride, raclopride, and sulpiride; e.g., Figs. 1, 2), the elevation of free intracellular Ca2+ by dopamine in a Ca2+-containing external solution but substantially less after replacing most of the external Ca2+ with Mg2+ (Fig. 4), the suppression of agonist responses by an IP3 receptor antagonist (2-APB; Fig. 5), and the SCH 23390- and eticlopride-sensitive activation of CaMKII by light (Fig. 8).
How retinal ganglion cells utilize D1 and/or D2-D5 receptors will depend on their distribution in structural compartments of single cells (Hersch et al., 1995; Lee et al., 2004), the G-proteins recruited (Neve et al., 2004), whether dopamine activates Ca2+-stimulated as well as Ca2+-insensitive adenylyl cyclases (Abdel-Majid et al., 2002; Dunn et al., 2009) in individual cells, whether the effects of calmodulin and adenylyl cyclase activation are additive or synergistic (Gnegy et al., 1984; Sano, 1985), the duration and intensity of Ca2+ rises (Dunn et al., 2006, 2009), and the relative strengths of the signals they drive. For example, the rise in cAMP could be due to activation of adenylyl cyclases by D1a receptors and Gs or Golf (Neve et al., 2004), or to activation of adenylyl cyclases by Ca2+ influx following D2–D5 receptor and Gq activation (Hasbi et al., 2010). Likewise, the rise in free Ca2+ (which activates CaM and CaMKII) could result from activation of D2–D5 receptors, PLCβ, and Ca2+-induced Ca2+ influx (So et al., 2009) or from activation of Ca2+ channels by a D1 receptor-mediated cAMP rise (Surmeier et al., 1995). Clearly, the means to compare the distribution of dopamine receptors and G-proteins would help sort through these possibilities. Unfortunately, we know of no previous demonstration that rat retinal ganglion cells bind antibodies directed against Gs, Golf, and/or Gq. Moreover, the anti-D2 and anti-D5 receptor antibodies we have tested to date did not stain ganglion cells consistently, or with sufficient intensity, to test for colocalization with D1 receptors.
Previous studies used radiolabeled ligands, fluorophore-conjugated ligands, and anti-D1 and anti-D2 receptor antibodies to map dopamine receptors in mammalian retinae (Schorderet and Nowak, 1990; Witkovsky, 2004). Except for intrinsically photosensitive ganglion cells (Van Hook et al., 2012), these studies did not identify any of the labeled cells as ganglion cells, visualize the shape of any single ganglion cells, or resolve whether receptors are homomerically or heteromerically organized. Because 1) more than 10 morphological types of ganglion cell have been identified in rat retina (see Stradleigh et al., 2011); 2) it is not known if all cell types possess the same receptor cohort (Cohen et al., 1992; Wagner et al., 1993; Mills et al., 2007; Chen and Yang, 2007; Hayashida et al., 2009; Huberman et al., 2009; Hu et al., 2010; Van Hook et al., 2012); and 3) D1 and D2 receptors are known to colocalize at some, but not all, points in the membranes of single central neurons (Hersch et al., 1995; Lee et al., 2004), identifying the receptors mediating dopamine responses of ganglion cells in further detail will require methods to localize receptor types precisely, in various combinations, on a large scale, and with single-cell resolution. Detailed maps of dopamine receptors might identify structural compartments (e.g., dendrites vs. somata) where dopamine effects result from D1 receptor-driven cAMP increases and/or D2 receptor-driven cAMP decreases (Mills et al., 2007; Chen and Yang, 2007; Hu et al., 2010; Van Hook et al., 2012), and other compartments where D1 and D2 antagonists exert similar effects, and dopamine regulates both cAMP and CaMKII, as we report here. Our results predict that SKF 83959 binding sites should identify the latter.
Supplementary Material
Acknowledgments
The authors thank M.B. Jekabsons, W.K. Stell, and I.N. Pessah for discussions; G.G. Gurkoff and R.F. Berman for use of a fura-2 imaging system; C. Jin and J. Driscoll for a sample of SKF 83959; and H. Lincicome for the anti-CaM-KII antibody blocking peptide used in this study.
Grant sponsor: National Institutes of Health (NIH); Grant number: EY08120; Grant sponsor: NIH American Recovery and Reinvestment Act Award; Grant number: EY08120-20S1; Grant sponsor: National Eye Institute Core grant; Grant number: P30 EY12576; Grant sponsor: Department of Ophthalmology from Research to Prevent Blindness, Inc., New York, NY departmental grant; Grant sponsor: NIH-IMSD Fellowship; Grant number: R25 56765 (to T.W.S.); Grant sponsor: NIH-NEI Training Grant; Grant number: T32 EY015387; Grant sponsor: NIH Research Supplement to Promote Diversity in Health-Related Research; Grant number: EY08120-17S1.
Footnotes
CONFLICT OF INTEREST
No identified conflicts.
Additional Supporting Information may be found in the online version of this article.
ROLE OF AUTHORS
All authors had full access to all the data in the study and take responsibility for the integrity of the data and the accuracy of the data analysis. Study concept and design: A.T.I., G.O., T.W.S., G.J.P. Acquisition of data: G.O., T.W.S., G.J.P. Analysis and interpretation of data: G.O., T.W.S., G.J.P., A.T.I. Drafting of the article: A.T.I. Critical revision of the article for important intellectual content: G.J.P. Statistical analysis: G.O., T.W.S., G.J.P., A.T.I. Obtained funding: A.T.I. Administrative, technical, and material support: none. Study supervision: A.T.I.
LITERATURE CITED
- Abdel-Majid RM, Tremblay F, Baldridge WH. Localization of adenylyl cyclase proteins in the rodent retina. Mol Brain Res. 2002;101:62–70. doi: 10.1016/s0169-328x(02)00163-8. [DOI] [PubMed] [Google Scholar]
- Berrera M, Dodoni G, Monterisi S, Pertegato V, Zamparo I, Zaccolo M. A toolkit for real-time detection of cAMP: insights into compartmentalized signaling. Handb Exp Pharmacol. 2008;186:285–298. doi: 10.1007/978-3-540-72843-6_12. [DOI] [PubMed] [Google Scholar]
- Bjelke B, Goldstein M, Tinner B, Andersson C, Sesack SR, Steinbusch HW, Lew JY, He X, Watson S, Tengroth B, Fuxe K. Dopaminergic transmission in the rat retina: evidence for volume transmission. J Chem Neuroanat. 1996;12:37–50. doi: 10.1016/s0891-0618(96)00176-7. [DOI] [PubMed] [Google Scholar]
- Brainard GC, Morgan WW. Light-induced stimulation of retinal dopamine: a dose-response relationship. Brain Res. 1987;424:199–203. doi: 10.1016/0006-8993(87)91211-x. [DOI] [PubMed] [Google Scholar]
- Brann MR, Young WS., III Dopamine receptors are located on rods in bovine retina. Neurosci Lett. 1986;69:221–226. doi: 10.1016/0304-3940(86)90483-0. [DOI] [PubMed] [Google Scholar]
- Bronstein JM, Wasterlain CG, Bok D, Lasher R, Farber DB. Localization of retinal calmodulin kinase. Exp Eye Res. 1988;47:391–402. doi: 10.1016/0014-4835(88)90050-4. [DOI] [PubMed] [Google Scholar]
- Calvert PD, Strissel KJ, Schiesser WE, Pugh EN, Jr, Arshavsky VY. Light-driven translocation of signaling proteins in vertebrate photoreceptors. Trends Cell Biol. 2006;16:560–568. doi: 10.1016/j.tcb.2006.09.001. [DOI] [PubMed] [Google Scholar]
- Cantrell A, Scheuer T, Catterall W. Voltage-dependent neuromodulation of Na+ channels by D1-like dopamine receptors in rat hippocampal neurons. J Neurosci. 1999;19:5301–5310. doi: 10.1523/JNEUROSCI.19-13-05301.1999. [DOI] [PMC free article] [PubMed] [Google Scholar]
- Chen L, Yang XL. Hyperpolarization-activated cation current is involved in modulation of the excitability of rat retinal ganglion cells by dopamine. Neuroscience. 2007;150:299–308. doi: 10.1016/j.neuroscience.2007.09.015. [DOI] [PubMed] [Google Scholar]
- Chen J, Wu M, Sezate SA, Matsumoto H, Ramsey M, McGinnis JF. Interaction of glyceraldehyde-3-phosphate dehydrogenase in the light-induced rod alpha-transducin translocation. J Neurochem. 2008;104:1280–1292. doi: 10.1111/j.1471-4159.2007.05081.x. [DOI] [PubMed] [Google Scholar]
- Cohen AI, Todd RD, Harmon S, O’Malley K. Photoreceptors of mouse retinas possess D4 receptors coupled to adenylate cyclase. Proc Natl Acad Sci U S A. 1992;89:12093–12097. doi: 10.1073/pnas.89.24.12093. [DOI] [PMC free article] [PubMed] [Google Scholar]
- Dearry A, Burnside B. Dopaminergic regulation of cone retinomotor movement in isolated teleost retinas: I. Induction of cone contraction is mediated by D2 receptors. J Neurochem. 1986;46:1006–1021. doi: 10.1111/j.1471-4159.1986.tb00612.x. [DOI] [PubMed] [Google Scholar]
- Dearry A, Edelman JL, Miller S, Burnside B. Dopamine induces light-adaptive retinomotor movements in bullfrog cones via D2 receptors and in retinal pigment epithelium via D1 receptors. J Neurochem. 1990;54:1367–1378. doi: 10.1111/j.1471-4159.1990.tb01971.x. [DOI] [PubMed] [Google Scholar]
- Deegan JF, 2nd, Jacobs GH. On the identity of the cone types of the rat retina. Exp Eye Res. 1993;56:375–377. doi: 10.1006/exer.1993.1049. [DOI] [PubMed] [Google Scholar]
- Dunn TA, Wang CT, Colicos MA, Zaccolo M, DiPilato LM, Zhang J, Tsien RY, Feller MB. Imaging of cAMP levels and protein kinase A activity reveals that retinal waves drive oscillations in second-messenger cascades. J Neurosci. 2006;26:12807–12815. doi: 10.1523/JNEUROSCI.3238-06.2006. [DOI] [PMC free article] [PubMed] [Google Scholar]
- Dunn TA, Storm DR, Feller MB. Calcium-dependent increases in protein kinase-A activity in mouse retinal ganglion cells are mediated by multiple adenylate cyclases. PLoS One. 2009;4:e7877. doi: 10.1371/journal.pone.0007877. [DOI] [PMC free article] [PubMed] [Google Scholar]
- Euler T, Hausselt SE, Margolis DJ, Breuninger T, Castell X, Detwiler PB, Denk W. Eyecup scope- optical recordings of light stimulus-evoked fluorescence signals in the retina. Pflügers Arch. 2009;457:1393–1414. doi: 10.1007/s00424-008-0603-5. [DOI] [PMC free article] [PubMed] [Google Scholar]
- Farber DB, Souza DW, Chase DG, Lolley RN. Cyclic nucleotides of cone-dominant retinas. Reduction of cyclic AMP levels by light and by cone degeneration. Invest Ophthalmol Vis Sci. 1981;20:24–31. [PubMed] [Google Scholar]
- Feigenspan A, Bormann J. Facilitation of GABAergic signaling in the retina by receptors stimulating adenylate cyclase. Proc Natl Acad Sci U S A. 1994;91:10893–10897. doi: 10.1073/pnas.91.23.10893. [DOI] [PMC free article] [PubMed] [Google Scholar]
- Fujieda H, Scher J, Lukita-Atmadja W, Brown GM. Gene regulation of melatonin and dopamine receptors during eye development. Neuroscience. 2003;120:301–307. doi: 10.1016/s0306-4522(03)00298-7. [DOI] [PubMed] [Google Scholar]
- Fyk-Kolodziej B, Pourcho RG. Differential distribution of hyperpolarization-activated and cyclic nucleotide-gated channels in cone bipolar cells of the rat retina. J Comp Neurol. 2007;501:891–903. doi: 10.1002/cne.21287. [DOI] [PubMed] [Google Scholar]
- Gnegy ME, Muirhead N, Roberts-Lewis J, Treisman G. Calmodulin stimulates adenylate cyclase activity and increases dopamine activation in bovine retina. J Neurosci. 1984;4:2712–2717. doi: 10.1523/JNEUROSCI.04-11-02712.1984. [DOI] [PMC free article] [PubMed] [Google Scholar]
- Hasbi A, O’Dowd BF, George SR. Heteromerization of dopamine D2 receptors with dopamine D1 or D5 receptors generates intracellular calcium signaling by different mechanisms. Curr Opin Pharmacol. 2010;10:93–99. doi: 10.1016/j.coph.2009.09.011. [DOI] [PMC free article] [PubMed] [Google Scholar]
- Hauck SM, Ekstrom PA, Ahuja-Jensen P, Suppmann S, Paquet-Durand F, van Veen T, Ueffing M. Differential modification of phosducin protein in degenerating rd1 retina is associated with constitutively active Ca2+/calmodulin kinase II in rod outer segments. Mol Cell Proteomics. 2006;5:324–336. doi: 10.1074/mcp.M500217-MCP200. [DOI] [PubMed] [Google Scholar]
- Hayashida Y, Ishida AT. Dopamine receptor activation can reduce voltage-gated Na+ current by modulating both entry into and recovery from inactivation. J Neurophysiol. 2004;92:3134–3141. doi: 10.1152/jn.00526.2004. [DOI] [PMC free article] [PubMed] [Google Scholar]
- Hayashida Y, Varela Rodríguez C, Ogata G, Partida GJ, Oi H, Stradleigh TW, Lee SC, Colado AF, Ishida AT. Inhibition of adult rat retinal ganglion cells by D1-type dopamine receptor activation. J Neurosci. 2009;29:15001–15016. doi: 10.1523/JNEUROSCI.3827-09.2009. [DOI] [PMC free article] [PubMed] [Google Scholar]
- Hensler JG, Dubocovich ML. Dl-dopamine receptor activation mediates 3H-acetylcholine release from rabbit retina. Brain Res. 1986;398:407–412. doi: 10.1016/0006-8993(86)91506-4. [DOI] [PubMed] [Google Scholar]
- Hersch SM, Ciliax BJ, Gutekunst CA, Rees HD, Heilman CJ, Yung KK, Bolam JP, Ince E, Yi H, Levey AI. Electron microscopic analysis of D1 and D2 dopamine receptor proteins in the dorsal striatum and their synaptic relationships with motor corticostriatal afferents. J Neurosci. 1995;15:5222–5237. doi: 10.1523/JNEUROSCI.15-07-05222.1995. [DOI] [PMC free article] [PubMed] [Google Scholar]
- Horowitz LF, Hirdes W, Suh BC, Hilgemann DW, Mackie K, Hille B. Phospholipase C in living cells: activation, inhibition, Ca2+ requirement, and regulation of M current. J Gen Physiol. 2005;126:243–262. doi: 10.1085/jgp.200509309. [DOI] [PMC free article] [PubMed] [Google Scholar]
- Hoshi H, Mills SL. Components and properties of the G3 ganglion cell circuit in the rabbit retina. J Comp Neurol. 2009;513:69–82. doi: 10.1002/cne.21941. [DOI] [PMC free article] [PubMed] [Google Scholar]
- Hu EH, Pan F, Volgyi B, Bloomfield SA. Light increases the gap junctional coupling of retinal ganglion cells. J Physiol. 2010;588:4145–4163. doi: 10.1113/jphysiol.2010.193268. [DOI] [PMC free article] [PubMed] [Google Scholar]
- Huberman AD, Wei W, Elstrott J, Stafford BK, Feller MB, Barres BA. Genetic identification of an On-Off direction-selective retinal ganglion cell subtype reveals a layer-specific subcortical map of posterior motion. Neuron. 2009;62:327–334. doi: 10.1016/j.neuron.2009.04.014. [DOI] [PMC free article] [PubMed] [Google Scholar]
- Iuvone PM, Boatright JH, Bloom MM. Dopamine mediates the light-evoked suppression of serotonin N-acetyl-transferase activity in retina. Brain Res. 1987;418:314–324. doi: 10.1016/0006-8993(87)90098-9. [DOI] [PubMed] [Google Scholar]
- Jensen RJ, Daw NW. Effects of dopamine and its agonists and antagonists on the receptive field properties of ganglion cells in the rabbit retina. Neuroscience. 1986;17:837–855. doi: 10.1016/0306-4522(86)90049-7. [DOI] [PubMed] [Google Scholar]
- Jin LQ, Goswami S, Cai G, Zhen X, Friedman E. SKF83959 selectively regulates phosphatidylinositol-linked D1 dopamine receptors in rat brain. J Neurochem. 2003;85:378–386. doi: 10.1046/j.1471-4159.2003.01698.x. [DOI] [PubMed] [Google Scholar]
- Kim KJ, Rieke F. Slow Na+ inactivation and variance adaptation in salamander retinal ganglion cells. J Neurosci. 2003;23:1506–1516. doi: 10.1523/JNEUROSCI.23-04-01506.2003. [DOI] [PMC free article] [PubMed] [Google Scholar]
- Kim YH, Kim YS, Noh HS, Kang SS, Cheon EW, Park SK, Lee BJ, Choi WS, Cho GJ. Changes in rhodopsin kinase and transducin in the rat retina in early-stage diabetes. Exp Eye Res. 2005;80:753–760. doi: 10.1016/j.exer.2004.09.003. [DOI] [PubMed] [Google Scholar]
- Koizumi A, Zeck G, Ben Y, Masland RH, Jakobs TC. Organotypic culture of physiologically functional adult mammalian retinas. PLoS One. 2007;2:e221. doi: 10.1371/journal.pone.0000221. [DOI] [PMC free article] [PubMed] [Google Scholar]
- Kramer SG. Dopamine: a retinal neurotransmitter. I. Retinal uptake, storage, and light-stimulated release of H3-dopamine in vivo. Invest Ophthalmol. 1971;10:438–452. [PubMed] [Google Scholar]
- Lee SP, So CH, Rashid AJ, Varghese G, Cheng R, Lança AJ, O’Dowd BF, George SR. Dopamine D1 and D2 receptor co-activation generates a novel phospholipase C-mediated calcium signal. J Biol Chem. 2004;279:35671–35678. doi: 10.1074/jbc.M401923200. [DOI] [PubMed] [Google Scholar]
- Lisman J, Yasuda R, Raghavachari S. Mechanisms of CaMKII action in long-term potentiation. Nat Rev Neurosci. 2012;13:169–182. doi: 10.1038/nrn3192. [DOI] [PMC free article] [PubMed] [Google Scholar]
- Liu Y, Lasater EM. Calcium currents in turtle retinal ganglion cells. II. Dopamine modulation via a cyclic AMP-dependent mechanism. J Neurophysiol. 1994;71:743–752. doi: 10.1152/jn.1994.71.2.743. [DOI] [PubMed] [Google Scholar]
- Makman MH, Dvorkin B. Binding sites for [3H]SCH 23390 in retina: properties and possible relationship to dopamine D1-receptors mediating stimulation of adenylate cyclase. Mol Brain Res. 1986;1:261–270. doi: 10.1016/0169-328x(86)90032-x. [DOI] [PubMed] [Google Scholar]
- Manglapus MK, Iuvone PM, Underwood H, Pierce ME, Barlow RB. Dopamine mediates circadian rhythms of rod-cone dominance in the Japanese quail retina. J Neurosci. 1999;19:4132–4141. doi: 10.1523/JNEUROSCI.19-10-04132.1999. [DOI] [PMC free article] [PubMed] [Google Scholar]
- Masuzawa M, Nakao S, Miyamoto E, Yamada M, Murao K, Nishi K, Shingu K. Pentobarbital inhibits ketamine-induced dopamine release in the rat nucleus accumbens: a microdialysis study. Anesth Analg. 2003;96:148–152. doi: 10.1097/00000539-200301000-00030. [DOI] [PubMed] [Google Scholar]
- McCall MJ, Robinson SR, Dreher B. Differential retinal growth appears to be the primary factor producing the ganglion cell density gradient in the rat. Neurosci Lett. 1987;79:78–84. doi: 10.1016/0304-3940(87)90675-6. [DOI] [PubMed] [Google Scholar]
- Mills SL, Xia XB, Hoshi H, Firth SI, Rice ME, Frishman LJ, Marshak DW. Dopaminergic modulation of tracer coupling in a ganglion-amacrine cell network. Vis Neurosci. 2007;24:593–608. doi: 10.1017/S0952523807070575. [DOI] [PMC free article] [PubMed] [Google Scholar]
- Nadal-Nicolás FM, Jiménez-López M, Sobrado-Calvo P, Nieto-López L, Cánovas-Martínez I, Salinas-Navarro M, Vidal-Sanz M, Agudo M. Brn3a as a marker of retinal ganglion cells: qualitative and quantitative time course studies in naive and optic nerve-injured retinas. Invest Ophthalmol Vis Sci. 2009;50:3860–3868. doi: 10.1167/iovs.08-3267. [DOI] [PubMed] [Google Scholar]
- Neve KA, Seamans JK, Trantham-Davidson H. Dopamine receptor signaling. J Recept Signal Transduct Res. 2004;24:165–205. doi: 10.1081/rrs-200029981. [DOI] [PubMed] [Google Scholar]
- Ng J, Rashid AJ, So CH, O’Dowd BF, George SR. Activation of calcium/calmodulin-dependent protein kinase IIa in the striatum by the heteromeric D1–D2 dopamine receptor complex. Neuroscience. 2010;165:535–541. doi: 10.1016/j.neuroscience.2009.10.017. [DOI] [PMC free article] [PubMed] [Google Scholar]
- Panchalingam S, Undie AS. SKF83959 exhibits biochemical agonism by stimulating [35S]GTPγS binding and phosphoinositide hydrolysis in rat and monkey brain. Neuropharmacology. 2001;40:826–837. doi: 10.1016/s0028-3908(01)00011-9. [DOI] [PubMed] [Google Scholar]
- Patel JC, Witkovsky P, Avshalumov MV, Rice ME. Mobilization of calcium from intracellular stores facilitates somatodendritic dopamine release. J Neurosci. 2009;29:6568–6579. doi: 10.1523/JNEUROSCI.0181-09.2009. [DOI] [PMC free article] [PubMed] [Google Scholar]
- Perez MF, White FJ, Hu XT. Dopamine D2 receptor modulation of K+ channel activity regulates excitability of nucleus accumbens neurons at different membrane potentials. J Neurophysiol. 2006;96:2217–2228. doi: 10.1152/jn.00254.2006. [DOI] [PubMed] [Google Scholar]
- Perry VH. Evidence for an amacrine cell system in the ganglion cell layer of the rat retina. Neuroscience. 1981;6:931–44. doi: 10.1016/0306-4522(81)90174-3. [DOI] [PubMed] [Google Scholar]
- Philp NJ, Chang W, Long K. Light-stimulated protein movement in rod photoreceptor cells of the rat retina. FEBS Lett. 1987;225:127–32. doi: 10.1016/0014-5793(87)81144-4. [DOI] [PubMed] [Google Scholar]
- Pierce ME, Besharse JC. Circadian regulation of retino-motor movements. Interaction of melatonin and dopamine in the control of cone length. J Gen Physiol. 1985;86:671–689. doi: 10.1085/jgp.86.5.671. [DOI] [PMC free article] [PubMed] [Google Scholar]
- Pochet R, Pasteels B, Seto-Ohshima A, Bastianelli E, Kitajima S, Van Eldik LJ. Calmodulin and calbindin localization in retina from six vertebrate species. J Comp Neurol. 1991;314:750–762. doi: 10.1002/cne.903140408. [DOI] [PubMed] [Google Scholar]
- Pourcho RG. Dopaminergic amacrine cells in the cat retina. Brain Res. 1982;252:101–109. doi: 10.1016/0006-8993(82)90982-9. [DOI] [PubMed] [Google Scholar]
- Rashid AJ, So CH, Kong MM, Furtak T, El-Ghundi M, Cheng R, O’Dowd BF, George SR. D1–D2 dopamine receptor heterooligomers with unique pharmacology are coupled to rapid activation of Gq/11 in the striatum. Proc Natl Acad Sci U S A. 2007;104:654–659. doi: 10.1073/pnas.0604049104. [DOI] [PMC free article] [PubMed] [Google Scholar]
- Reese BE, Cowey A. Large retinal ganglion cells in the rat: their distribution and laterality of projection. Exp Brain Res. 1986;61:375–385. doi: 10.1007/BF00239526. [DOI] [PubMed] [Google Scholar]
- Ribelayga C, Wang Y, Mangel SC. Dopamine mediates circadian clock regulation of rod and cone input to fish retinal horizontal cells. J Physiol. 2002;544:801–816. doi: 10.1113/jphysiol.2002.023671. [DOI] [PMC free article] [PubMed] [Google Scholar]
- Rosenkranz JA, Johnston D. State-dependent modulation of amygdala inputs by dopamine-induced enhancement of sodium currents in layer V entorhinal cortex. J Neurosci. 2007;27:7054–7069. doi: 10.1523/JNEUROSCI.1744-07.2007. [DOI] [PMC free article] [PubMed] [Google Scholar]
- Sakamoto K, Liu C, Kasamatsu M, Pozdeyev NV, Iuvone PM, Tosini G. Dopamine regulates melanopsin mRNA expression in intrinsically photosensitive retinal ganglion cells. Eur J Neurosci. 2005;22:3129–3136. doi: 10.1111/j.1460-9568.2005.04512.x. [DOI] [PubMed] [Google Scholar]
- Sano M. Calmodulin-dependent adenylate cyclase in rat retina and the response to dopamine. Brain Res. 1985;345:337–340. doi: 10.1016/0006-8993(85)91012-1. [DOI] [PubMed] [Google Scholar]
- Schmidt R, Creutzfeldt OD. Changes of spontaneous and evoked activity of single neurons of the retina and lateral geniculate body of the cat induced by fractionated injection of pentobarbital-Na (Nembutal) Pflügers Arch. 1968;300:129–147. [PubMed] [Google Scholar]
- Schorderet M, Nowak JZ. Retinal dopamine D1 and D2 receptors: characterization by binding or pharmacological studies and physiological functions. Cell Mol Neurobiol. 1990;10:303–325. doi: 10.1007/BF00711177. [DOI] [PMC free article] [PubMed] [Google Scholar]
- Seeman P, Kapur S. Anesthetics inhibit high-affinity states of dopamine D2 and other G-linked receptors. Synapse. 2003;50:35–40. doi: 10.1002/syn.10221. [DOI] [PubMed] [Google Scholar]
- Shahlaie K, Lyeth BG, Gurkoff GG, Muizelaar JP, Berman RF. Neuroprotective effects of selective N-type VGCC blockade on stretch-injury-induced calcium dynamics in cortical neurons. J Neurotrauma. 2010;27:175–187. doi: 10.1089/neu.2009.1003. [DOI] [PMC free article] [PubMed] [Google Scholar]
- So CH, Verma V, Alijaniaram M, Cheng R, Rashid AJ, O’Dowd BF, George SR. Calcium signaling by dopamine D5 receptor and D5-D2 receptor hetero-oligomers occurs by a mechanism distinct from that for dopamine D1–D2 receptor hetero-oligomers. Mol Pharmacol. 2009;75:843–854. doi: 10.1124/mol.108.051805. [DOI] [PMC free article] [PubMed] [Google Scholar]
- Song H, Belcastro M, Young EJ, Sokolov M. Compartment-specific phosphorylation of phosducin in rods underlies adaptation to various levels of illumination. J Biol Chem. 2007;282:23613–23621. doi: 10.1074/jbc.M701974200. [DOI] [PubMed] [Google Scholar]
- Stellwagen D, Shatz CJ, Feller MB. Dynamics of retinal waves are controlled by cyclic AMP. Neuron. 1999;24:673–685. doi: 10.1016/s0896-6273(00)81121-6. [DOI] [PubMed] [Google Scholar]
- Stradleigh TW, Ogata G, Partida GJ, Oi H, Greenberg KP, Krempely KS, Ishida AT. Colocalization of hyperpolarization-activated and cyclic nucleotide-gated channel subunits in rat retinal ganglion cells. J Comp Neurol. 2011;519:2546–2573. doi: 10.1002/cne.22638. [DOI] [PMC free article] [PubMed] [Google Scholar]
- Straschill M, Perwein J. The inhibition of retinal ganglion cells by catecholamines and γ-aminobutyric acid. Pflügers Arch. 1969;312:45–54. doi: 10.1007/BF00588530. [DOI] [PubMed] [Google Scholar]
- Surmeier DJ, Bargas J, Hemmings HC, Jr, Nairn AC, Greengard P. Modulation of calcium currents by a D1 dopaminergic protein kinase/phosphatase cascade in rat neostriatal neurons. Neuron. 1995;14:385–397. doi: 10.1016/0896-6273(95)90294-5. [DOI] [PubMed] [Google Scholar]
- Takeda H, Kitaoka Y, Hayashi Y, Kumai T, Munemasa Y, Fujino H, Kobayashi S, Ueno S. Calcium/calmodulin-dependent protein kinase II regulates the phosphorylation of CREB in NMDA-induced retinal neurotoxicity. Brain Res. 2007;1184:306–315. doi: 10.1016/j.brainres.2007.09.055. [DOI] [PubMed] [Google Scholar]
- Terashima T, Ochiishi T, Yamauchi T. Immunocytochemical localization of calcium/ calmodulin-dependent protein kinase II isoforms in the ganglion cells of the rat retina: immunofluorescence histochemistry combined with a fluorescent retrograde tracer. Brain Res. 1994;650:133–139. doi: 10.1016/0006-8993(94)90215-1. [DOI] [PubMed] [Google Scholar]
- Terry P, Katz JL. A comparison of the effects of the D1 receptor antagonists SCH 23390 and SCH 39166 on suppression of feeding behavior by the D1 agonist SKF 38393. Psychopharmacology. 1994;113:328–333. doi: 10.1007/BF02245205. [DOI] [PubMed] [Google Scholar]
- Thier P, Alder V. Action of iontophoretically applied dopamine on cat retinal ganglion cells. Brain Res. 1984;292:109–121. doi: 10.1016/0006-8993(84)90895-3. [DOI] [PubMed] [Google Scholar]
- Trantham-Davidson H, Neely LC, Lavin A, Seamans JK. Mechanisms underlying differential D1 versus D2 dopamine receptor regulation of inhibition in prefrontal cortex. J Neurosci. 2004;24:10652–10659. doi: 10.1523/JNEUROSCI.3179-04.2004. [DOI] [PMC free article] [PubMed] [Google Scholar]
- Traverso V, Bush RA, Sieving PA, Deretic D. Retinal cAMP levels during the progression of retinal degeneration in rhodopsin P23H and S334ter transgenic rats. Invest Ophthalmol Vis Sci. 2002;43:1655–1661. [PubMed] [Google Scholar]
- Van Hook MJ, Wong KY, Berson DM. Dopaminergic modulation of ganglion-cell photoreceptors in rat. Eur J Neurosci. 2012;35:507–18. doi: 10.1111/j.1460-9568.2011.07975.x. [DOI] [PMC free article] [PubMed] [Google Scholar]
- Vaquero CF, Pignatelli A, Partida GJ, Ishida AT. A dopamine- and protein kinase A-dependent mechanism for network adaptation in retinal ganglion cells. J Neurosci. 2001;21:8624–8635. doi: 10.1523/JNEUROSCI.21-21-08624.2001. [DOI] [PMC free article] [PubMed] [Google Scholar]
- Veruki ML, Wassle H. Immunohistochemical localization of dopamine D1 receptors in rat retina. Eur J Neurosci. 1996;8:2286–2297. doi: 10.1111/j.1460-9568.1996.tb01192.x. [DOI] [PubMed] [Google Scholar]
- Voigt T. Cholinergic amacrine cells in the rat retina. J Comp Neurol. 1986;248:19–35. doi: 10.1002/cne.902480103. [DOI] [PubMed] [Google Scholar]
- Wagner HJ, Luo BG, Ariano MA, Sibley DR, Stell WK. Localization of D2 dopamine receptors in vertebrate retinae with anti-peptide antibodies. J Comp Neurol. 1993;331:469–481. doi: 10.1002/cne.903310404. [DOI] [PubMed] [Google Scholar]
- Wang L, Li C, Guo H, Kern TS, Huang K, Zheng L. Curcumin inhibits neuronal and vascular degeneration in retina after ischemia and reperfusion injury. PLoS One. 2011;6:e23194. doi: 10.1371/journal.pone.0023194. [DOI] [PMC free article] [PubMed] [Google Scholar]
- Wayman GA, Tokumitsu H, Davare MA, Soderling TR. Analysis of CaM-kinase signaling in cells. Cell Calcium. 2011;50:1–8. doi: 10.1016/j.ceca.2011.02.007. [DOI] [PMC free article] [PubMed] [Google Scholar]
- Witkovsky P. Dopamine and retinal function. Doc Ophthalmol. 2004;108:17–40. doi: 10.1023/b:doop.0000019487.88486.0a. [DOI] [PubMed] [Google Scholar]
- Witkovsky P, Nicholson C, Rice ME, Bohmaker K, Meller E. Extracellular dopamine concentration in the retina of the clawed frog, Xenopus laevis. Proc Natl Acad Sci U S A. 1993;90:5667–5671. doi: 10.1073/pnas.90.12.5667. [DOI] [PMC free article] [PubMed] [Google Scholar]
- Won YJ, Puhl HL, III, Ikeda SR. Molecular reconstruction of mGluR5a-mediated endocannabinoid signaling cascade in single rat sympathetic neurons. J Neurosci. 2009;29:13603–13612. doi: 10.1523/JNEUROSCI.2244-09.2009. [DOI] [PMC free article] [PubMed] [Google Scholar]
- Wood JG, Wallace RW, Whitaker JN, Cheung WY. Immunocytochemical localization of calmodulin in regions of rodent brain. Ann N Y Acad Sci. 1980;356:75–82. doi: 10.1111/j.1749-6632.1980.tb29601.x. [DOI] [PubMed] [Google Scholar]
- Yoshida K, Imaki J, Matsuda H, Hagiwara M. Light-induced CREB phosphorylation and gene expression in rat retinal cells. J Neurochem. 1995;65:1499–1504. doi: 10.1046/j.1471-4159.1995.65041499.x. [DOI] [PubMed] [Google Scholar]
- Yoshida K, Imaki J, Fujisawa H, Harada T, Ohki K, Matsuda H, Hagiwara M. Differential distribution of CaM kinases and induction of c-fos expression by flashing and sustained light in rat retinal cells. Invest Ophthalmol Vis Sci. 1996;37:174–179. [PubMed] [Google Scholar]
Associated Data
This section collects any data citations, data availability statements, or supplementary materials included in this article.