

Abstract
There is considerable interest in the use of adeno-associated virus serotype 9 (AAV9) for neurological gene therapy partly because of its ability to cross the blood–brain barrier to transduce astrocytes and neurons. This raises the possibility that AAV9 might also transduce antigen-presenting cells (APC) in the brain and provoke an adaptive immune response. We tested this hypothesis by infusing AAV9 vectors encoding foreign antigens, namely human aromatic L-amino acid decarboxylase (hAADC) and green fluorescent protein (GFP), into rat brain parenchyma. Over ensuing weeks, both vectors elicited a prominent inflammation in transduced brain regions associated with upregulation of MHC II in glia and associated lymphocytic infiltration. Transduction of either thalamus or striatum with AAV9-hAADC evinced a significant loss of neurons and induction of anti-hAADC antibodies. We conclude that AAV9 transduces APC in the brain and, depending on the immunogenicity of the transgene, can provoke a full immune response that mediates significant brain pathology. We emphasize, however, that these observations do not preclude the use of AAV serotypes that can transduce APC. However, it does potentially complicate preclinical toxicology studies in which non-self proteins are expressed at a level sufficient to trigger cell-mediated and humoral immune responses.
Introduction
Translation into the clinic of neurological gene therapies with vectors based on adeno-associated virus (AAV) has been relatively unaffected by immune issues.1 That appears to be due primarily to the use of AAV2, a neuron-specific serotype. However, AAV2 itself has a number of limitations, such as relatively modest transduction efficiency and lack of non-neuronal transduction in the brain that might be desirable in some cases. In exploring the use of other AAV serotypes, we and others have encountered issues that complicate clinical application. For example, delivery of AAV serotype 9 (AAV9) by vascular routes, although convenient,2,3,4 is sensitive to quite modest titers of circulating anti-AAV antibodies, a problem that makes treatment of most adults by this route problematic.5 In addition, our previous experience with AAV1 encodes a humanized Renilla green fluorescent protein (GFP), in nonhuman primate brain revealed a disturbing ability of this serotype to transduce antigen-presenting cells (APCs) and trigger a strong cell-mediated immune response against brain cells expressing humanized Renilla GFP,6 as evidenced by induction of circulating anti-humanized Renilla GFP antibodies, as well as infiltration of CD4+ lymphocytes and upregulation of MHC II in regions infused with vector. One criticism of this approach arose from our choice of transgene. Renilla GFP is after all foreign to mammalian tissues and appears to be strongly immunogenic in contrast perhaps to other GFP variants more commonly used. Since AAV9 also transduces non-neuronal cells, we wanted to determine whether, like AAV1, cell-mediated immunity presents another challenge to preclinical development. In order to investigate this in a more relevant way, we constructed an AAV9 that encodes human aromatic L-amino acid decarboxylase (hAADC) used for many years by our group in an AAV2 vector that is now in clinical study.7,8 AAV2-hAADC has never provoked any safety concerns in animal or human studies. However, it is possible that expression of a human cytoplasmic protein in APCs by switching to an AAV with broader tropism might trigger problems not seen when expression was limited to neurons by AAV2-mediated transduction.
The present study shows that AAV9-hAADC, when injected into rat brain parenchyma, triggers a massive immune response that involves antigen presentation by glial cells, lymphocytic infiltration of transduced brain regions, and generation of humoral anti-AADC antibodies. This immune response resulted in a dramatic elimination of neurons in transduced brain regions. This strikingly aggressive immune response prompted us to revisit AAV9-GFP transduction in rat brain and, as with AAV9-hAADC, we observed upregulation of MHC II in glial, CD8+ lymphocytic infiltration and modest neuronal loss. We conclude that AAV9 transduces APCs in the brain and this has clear implications for studies in which non-self peptide sequences form part of the transgene sequence. Caution must be exercised when using AAV9 encoding non-self proteins for gene therapy in the brain.
Results
Relative transduction efficiency of AAV9-hAADC compared to AAV2-hAADC
AAV9-hAADC and AAV2-hAADC were genetically identical9 and differed only in capsid protein. To determine whether these vectors differed in transduction efficiency, we infused similar doses of each vector [7 × 10¹⁰ vector genomes (vg)] unilaterally into rat striatum and then analyzed tissues by immunohistochemistry 1, 3, 5, and 8 weeks after surgery. After 1 week, AAV9-hAADC produced a much more intense and widespread hAADC expression in the striatum than AAV2-hAADC (Figure 1a, i). Quantitation of this difference volumetrically (from +1.2 mm to –0.4 mm A/P from Bregma) revealed that the initial volume of expression (Ve) of hAADC obtained in striatum from AAV9 was sevenfold larger than that obtained with AAV2-hAADC (mean mm3 ± SD, AAV9 33.14 ± 2.5; AAV2 4.57 ± 2.01, P = 0.045). The Ve of AAV9-hAADC remained stable over time (33.4 ± 2.02 mm3 at 3 weeks versus 33.52 ± 6.12 mm3 at 8 weeks). However, the intensity of AADC staining gradually decreased at later time points in AAV9-transduced, but not in AAV2-transduced, tissues (Figure 1c–g, j, k).
Figure 1.

AAV9-hAADC transfer into striatum. AAV9-hAADC directed robust transduction of rat striatum followed by progressive loss of transduced neurons. Shown is anti-AADC staining of striatal sections (a) 1-, (c) 3-, (e) 5-, and (g) 8 weeks after AAV9-hAADC injection [7 × 10¹⁰ vector genomes (vg)], indicating the progressive decrease in aromatic L-amino acid decarboxylase (AADC) immunostaining in the injected hemisphere. The central panel shows individual hAADC+ cells magnified from panels a, c, e, and g with neuronal (short arrow) and glial (long arrow) morphology. The progressive loss of human AADC (hAADC)-expressing cells was associated with a dramatic diminution in the number of NeuN+ cells in the transduced striatum. The right-hand panels show NeuN+ cells in the area surrounding the injection site (b) 1-, (d) 3-, (f) 5-, and (h) 8 weeks after AAV9-hAADC. This neuronal loss was not observed after injection of an equal dose of AAV2-hAADC (i, j, k). The inserts show a higher magnification of the transduced area in the striatum 1 week, 3 weeks, and 5 weeks after AAV2-hAADC transduction. Short arrows indicate individual hAADC+ cells with a neuronal morphology. Bar = 1 mm for a, c, e, g, i, j, k; 100 µm for b, d, e, h and 50 µm for the images in the central panel and inserts i, j, k. AAV9, adeno-associated virus serotype 9.
Double immunofluorescence staining (hAADC+/NeuN+) indicated that the majority of cells transduced by AAV9-hAADC in the striatum were neurons (Figure 2a). However, ~44% of hAADC+ striatal cells colocalized with the astroglial marker, glial fibrillary acidic protein (GFAP) (Figure 2b), but only a few transduced microglia in the vicinity of the needle track were detected (data not shown). In contrast, AAV2-hAADC directed expression of hAADC in an entirely neuron-specific manner. No AADC/GFAP costaining was observed with AAV2-hAADC in line with previous observations9 (data not shown).
Figure 2.

Cellular tropism of AAV9-hAADC vector in striatum. Representative images show expression of human aromatic L-amino acid decarboxylase (hAADC) in (a) NeuN+ cells and in (b) GFAP+ cells 1 week after striatal AAV9-hAADC [7 × 10¹⁰ vector genomes (vg)] injection. Bar = 100 µm. AAV9, adeno-associated virus serotype 9; GFAP, glial fibrillary acidic protein.
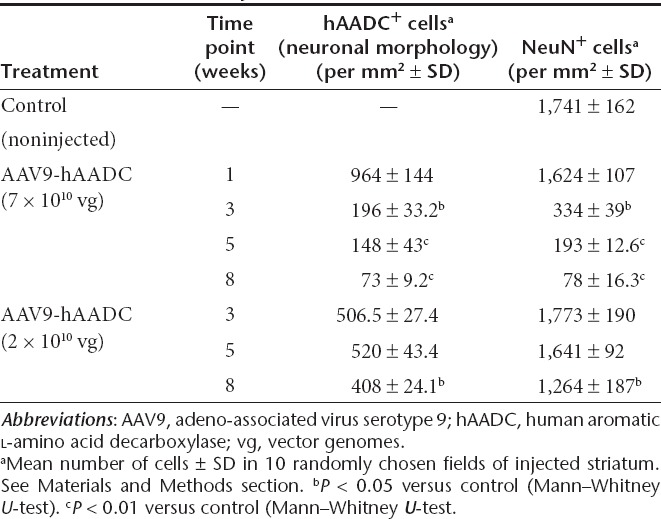
Although the Ve of AADC staining derived from AAV9 vector did not change between 3 and 8 weeks, transduction led to a progressive loss of transduced cells, primarily neurons (Figure 1 and Table 1). This loss appeared to be due, not to loss of AADC expression, but to frank elimination of neurons. A significant reduction in the number of NeuN+, cresyl violet-positive cells was detected as early as 3 weeks after transduction in the ipsilateral striatum, and became even more evident between 5 and 8 weeks (Figure 1b, d, f, h). Eight weeks after AAV9-hAADC transduction, the number of NeuN+ cells was ~20-fold less compared to the contralateral, noninjected striatum (Table 1). A possible explanation for the neurotoxicity of AAV9-hAADC was that overexpression of AADC itself is neurotoxic. Accordingly, we tested a lower dose of AAV9-hAADC vector –2 × 10¹⁰ vg. The Ve of hAADC derived from AAV9 did not change between 3 and 8 weeks (30.8 ± 6.0 mm3 at 3 weeks versus 29.6 ± 2.9 mm3 at 8 weeks (Supplementary Figure S1). Like the higher dose of AAV9-hAADC, injection with AAV9-hAADC at the lower dose resulted in both neuronal and astroglial transduction (data not shown). Up to 5 weeks after transduction, we did not detect any reduction in the number of NeuN+ cells in the injected striatum (Supplementary Figure S1 and Table 1). However, 8 weeks after transduction, NeuN+ cells declined by ~25% in the ipsilateral striatum relative to the control noninjected site (Table 1). We further confirmed the apparent AAV9-induced neurotoxic effect by Fluoro-Jade (F-J B), DAPI and Nissl staining (see Supplementary Figures S1–S4 and Supplementary Materials and Methods). F-J B detects the neurons that undergo degeneration as well as the highly activated glial cell.10,11,12 The F-J B staining drastically increased between 3 and 8 weeks after AAV9 transduction. Moreover, many cells stained by F-J B displayed a glial morphology, most evident at 8 weeks (Supplementary Figure S2a–e and Supplementary Materials and Methods). DAPI staining of striatal sections revealed cytoplasmic and nuclear shrinkage, as well as chromatin condensation or fragmentation, between 3 and 8 weeks after AAV9-hAADC transduction (Supplementary Figure S2g and Supplementary Materials and Methods). Similarly, Nissl staining of ipsilateral striatal sections showed a dramatic increase in smaller, dark cells, probably glia, residual atrophic neurons and infiltrating mononuclear cells, particularly around blood vessels between 3 and 8 weeks after AAV9-hAADC transduction (Supplementary Figure S2i). In contrast, AAV2-hAADC transduction of striatum resulted in a plateau of neuronal expression after 5 weeks that remained stable over time. No loss of NeuN staining was observed (data not shown). On this basis, we concluded that mere overexpression of AADC enzymatic activity was unlikely to be responsible for neuron loss.
Table 1. Quantitative analysis of AAV9-hAADC transduction.
Neurotoxicity of AAV9-hAADC is not limited to the nigrostriatal pathway
Because the biological activity of AADC is closely related to the function of the nigrostriatal pathway, we wanted to know whether or not this neurotoxic effect of AAV9-hAADC was dependent in some way on nigrostriatal function. HPLC analysis revealed that the robust transgene expression after AAV9 injection was associated with significantly higher AADC activity in the transduced striatum compared to that obtained with AAV2-hAADC (Supplementary Figure S3 and Supplementary Materials and Methods). Accordingly, we injected 7 × 10¹⁰ vg AAV9-hAADC unilaterally into thalamus, a non-dopaminergic tissue. Immunohistochemical analysis indicated that thalamic infusion of AAV9-hAADC drastically reduced the number of NeuN+ cells in the transduced area to 18% of control, noninjected thalamus (1,128.8 ± 101 NeuN+ cells in control versus 204.8 ± 15 NeuN+ cells in transduced site, mean number per mm 2, P < 0.01, Mann–Whitney U-test) (Figure 3a, b). As in striatum, AAV9 transduced both neurons and astrocytes (data not shown). These results indicate that this detrimental effect of AAV9-hAADC transduction is not dependent on toxic modification of dopaminergic pathways but is intrinsic to AAV9-hAADC transduction.
Figure 3.

Neurotoxicity of AAV9-hAADC after injection into thalamus. AADC staining 5 weeks after injection of AAV9-hAADC [7 × 10¹⁰ vector genomes (vg)] into thalamus shows a weakly stained area at the injection site almost completely devoid of (a) AADC immunoreactivity. Higher magnification (central image) reveals only a few hAADC+ cells with glial morphology (arrow). (b) NeuN+ cells in the transduced area in the thalamus. Striatal injection of AAV9-GFP (7 × 10¹⁰ vg) resulted in widespread expression of (c) green fluorescent protein (GFP) and modest loss of (d) NeuN+ cells in the ipsilateral striatum 3 weeks after transduction. The central panel shows individual GFP+ cells from panel c at high magnification with neuronal (short arrow) and glial (long arrow) morphology. The table shows the quantification of striatal NeuN+ and the cellular tropism of AAV9-GFP 3 weeks after striatal infusion (e). Data are represented as mean number of cells ± SD. aP < 0.01 or bP < 0.05 compared with noninjected control, Mann–Whitney U-test. Bar = 1 mm for a, c; 100 µm for b, d and 50 µm for central images. AAV9, adeno-associated virus serotype 9; hAADC, human aromatic L-amino acid decarboxylase.
Neurotoxicity is also observed after striatal injection of AAV9-GFP
Since the site-specific effect study revealed that the detrimental effect of AAV9-hAADC transduction is not attributable to hAADC toxicity in the nigrostriatal system, we asked whether some other transgene-specific effect was responsible. Therefore, we decided to compare equal striatal doses (7 × 10¹⁰ vg in 10 µl) of AAV9-hAADC and AAV9-GFP. As with AAV9-hAADC, immunohistochemical analysis indicated that the striatal infusion of AAV9-GFP led to neuronal and astroglial (Figure 3e), as well as sporadic microglial transduction (data not shown), that was also associated with a significant reduction in NeuN+ cells in the transduced striatum 3 weeks after transduction (Figure 3c–e). However, the loss of NeuN+ cells after AAV9-GFP transduction was not as great as that observed after AAV9-hAADC (48% after AAV9-GFP versus 80% after AAV9-hAADC).
AAV9-mediated effects on inflammation
Comparison of striatal infusion of equal doses of AAV9-hAADC and AAV2-hAADC with respect to the presence of inflammatory markers revealed a striking difference. AAV2-hAADC, as previously described,13 exhibited only transient elevations in Iba1 and GFAP, markers of microglial and astrocytic activation, respectively (Figure 4a, b, g, h). In contrast, 1 week after AAV9 transduction, the optical density (OD) of Iba1 staining was slightly reduced compared to contralateral striatum (Figure 4c, m). Microscopic inspection of these sections revealed that microglial cells in the ipsilateral striatum were almost completely transformed into small, shrunken cells with primitive processes or to an amoeboid morphology mostly in the needle track (Supplementary Figure S4a) and little astrocytic activation could be observed, suggesting that AAV9-hAADC toxicity is not acute. However, at 3 weeks, a time when elimination of neurons was well under way, there was a strong upregulation of both Iba1 and GFAP markers, with dense labeling throughout the whole ipsilateral striatum (Figure 4d, j, m). This massive glial activation persisted over time throughout all transduced brain areas (Supplementary Figure S4b). Morphologically, the majority of Iba1– as well as GFAP+ cells in the transduced areas displayed hypertrophic activation with a tendency to form clusters; some of the Iba1+ cells had an amoeboid morphology (Supplementary Figure S4a3,a4). Similarly, after injection of a lower dose of AAV9-hAADC vector (2 × 10¹⁰ vg), we noticed a gradual increase in activation of glial cells between 3 and 8 weeks after vector injection (Figure 4f, l, m). Three weeks after AAV9-GFP, we also observed significant astroglial and microglial activation throughout the whole ipsilateral striatum (Figure 4e, k, m).
Figure 4.

Time-dependent glia reaction to striatal injection of AAV9-hAADC, AAV2-hAADC, and AAV9-GFP. Micrographs (a–e) are representative of 1- and 3-week survival for equal doses of AAV2-hAADC, AAV9-hAADC, and AAV9-GFP, and of an 8-week survival for a lower dose of AAV9-hAADC (f). Glial activation in transduced striatum is indicated by Iba1 (a–f) and glial fibrillary acidic protein (GFAP) staining (g–l). Immunostaining for Iba1 and GFAP shows a modest reaction of glial cells to AAV2-hAADC injection (a,b,g,h). In contrast, a massive glial activation to AAV9-hAADC (higher dose) was observed between 3 and 8 weeks after transduction (c,d,i,j,m). Injection of a lower dose of AAV9-hAADC also induced prominent but delayed glial activation 8 weeks after transduction (f,l,m). Significant microglial and astroglial cell was also detected 3 weeks after AAV9-GFP injection into striatum (e,k,m). Data are represented as the mean percentage of Iba1 or GFAP optical density (OD) in the striatal region of the contralateral side ± SD. The values obtained from the contralateral striatum are scaled to 100%. Statistical intervals are indicated by P values as follows: aP < 0.01 or bP < 0.05 compared with noninjected control, Mann–Whitney U-test. Bar = 1 mm. AAV9, adeno-associated virus serotype 9; GFP, green fluorescent protein; hAADC, human aromatic L-amino acid decarboxylase.
Activated glial cells express MHC II in striatum after AAV9 transduction
Because the reaction of brain tissues to AAV9-hAADC was associated with frank elimination of neurons and strong persistent inflammation, we suspected a cell-mediated immune response. Such a response should be evident in upregulation of MHC II after AAV9-hAADC transduction. With AAV2-hAADC, by comparison, we observed only a few scattered MHC II+ cells in the vicinity of the injection site between 1 and 3 weeks that was practically undetectable at later time points (data not shown). In contrast, AAV9-hAADC transduction induced a rapid upregulation of MHC II in the injected striatum (Figure 5). By double immunofluorescence staining, we found that many of the MHC II+ cells also expressed Iba1, a microglial marker. The MHC 2/Iba1+ cells mainly displayed amoeboid or round morphologies and some of these cells were associated with blood vessels (Figure 5a–c). At 1 week, there was no evidence of MHC II colocalization with GFAP (Figure 5j). A peak in the number of MHC II+ cells in the transduced striatum was observed 3 weeks after AAV9-hAADC (Figure 5j). However, in contrast to the primarily microglial staining at 1 week, 3 weeks after AAV9-hAADC transduction we also observed numerous MHC II/GFAP+ astrocytes (Figure 5d–f, j). Increased MHC II expression in activated microglia cells was also observed 3 weeks after AAV9-GFP transduction (Figure 5g–j), as well as 8 weeks after AAV9-hAADC transduction (2 × 10¹⁰ vg) (Figure 5j).
Figure 5.

Glial cells adopt an antigen-presenting phenotype after adeno-associated virus serotype 9 (AAV9) injection. (a–c) Representative images depict Iba1+ microglia (a) that are MHC II+ (b). Iba1 and MHC II colocalize (c) and are mainly associated with blood vessels 7 days after AAV9-hAADC transduction (7 × 10¹⁰ vg). (d–f) Representative images show (d) GFAP+ astrocytes, immunopositive for (e) MHC II. (f) GFAP and MHC II colocalize and were detected in the transduced striatum 3 weeks after AAV9-hAADC vector injection. Representative images show amoeboid microglia that are MHC II+ (g–i) 3 weeks after AAV9-GFP transduction. The table shows the percentage of MHC II/Iba1 and MHC II+/GFAP+ cells in the striatum 1, 3, 5, and 8 weeks after AAV9-hAADC injection and 3 weeks after AAV9-GFP injection ± SD (j). aP < 0.05 compared with noninjected control, Mann–Whitney U-test. Bar = 50 µm. GFP, green fluorescent protein; GFAP, glial fibrillary acidic protein; hAADC, human aromatic L-amino acid decarboxylase.
Adaptive immune response after AAV9 transduction
Strong glial upregulation of MHC II suggested that glial expression of AAV9-derived transgenes had provoked an adaptive immune response. We looked for lymphocytic infiltration into AAV9-hAADC and AAV9-GFP-transduced striatum. Hematoxylin–eosin staining revealed massive lymphocytic or plasma cell infiltration between 3 and 8 weeks after AAV9-hAADC injection (Figure 6e). Numerous perivascular inflammatory foci (PIF) with dense accumulation of leukocytes around blood vessels, as well as a massive parenchymal infiltration, were observed throughout the entire area of transduced striatum and other parts of the basal ganglia (Figure 6c). Similar to AAV9-hAADC transduction, AAV9-GFP also provoked the robust infiltration of peripheral immune cells into transduced striatum after 3 weeks after transduction (Figure 6e). These lymphocytes were strongly CD8+ (Figure 6d, e) but this infiltration had almost disappeared at later time points (Figure 6e). In contrast, 8 weeks after injection of the lower dose of AAV9-hAADC, numerous perivascular foci as well as significant CD8+ cell infiltration into striatum were observed (Figure 6e). AAV2-hAADC injection resulted in very few CD8+ T cells that were localized solely to the needle track (data not shown).
Figure 6.

Striatal influx of armed T-cells after AAV9-hAADC and AAV9-GFP transduction. (a) Hematoxylin–eosin (H&E) staining of brain 3 weeks after AAV9-hAADC [7 × 10¹⁰ vector genomes (vg)] shows a multiple scattered perivascular inflammatory foci (arrows) localized in the transduced striatum. (b) H&E staining of contralateral (noninjected) striatum shows the vessel lumen without any pathology. The higher magnification of the inset from a (a1). (c) Inflammatory foci after AAV9-hAADC infusion were also detected in other transduced areas, e.g., ipsilateral entopeduncular nucleus and thalamus. (d) Numerous CD8+ T cells in parenchyma were found in close contact with blood vessels. Quantification of the density of inflammatory foci and infiltrated CD8+ T cells into transduced striatum at various time points after AAV9-hAADC (low- and high-dose) and 3 weeks after AAV9-GFP injection (e). Data are the mean number of foci per section and mean number of CD8+ T cells per mm2 ± SD Statistical significance is indicated as follows: aP < 0.01 or bP < 0.05 compared with noninjected control, Mann–Whitney U-test. Bar = 500 µm for a, c; 100 µm for a1, b, and 50 µm for d. AAV9, adeno-associated virus serotype 9; GFP, green fluorescent protein; hAADC, human aromatic L-amino acid decarboxylase.
Detection of circulating anti-AADC antibodies
Finally we asked whether transduction of rat striatum with AAV9-hAADC triggered humoral immunity in addition to cell-mediated responses. Sera of rats injected 8 weeks earlier with AAV9-hAADC or AAV2-hAADC were tested in a dot–blot assay to detect antibodies against hAADC. No reaction was observed with sera from naive rats (Figure 7b). AAV2 vector induced only very low antibody titers; a signal was detected only at lower dilutions, e.g., 1:100, 1:500 (Figure 7e, f). However, AAV9-hAADC transduction of striatum triggered a very strong humoral response with a visible signal even at a 1:4,000 dilution of rat serum (Figure 7c, d).
Figure 7.

Dot–blot assay for circulating anti-hAADC antibodies. (a) Positive control (dilutions of monoclonal antibodies against hAADC; www.millipore.com; Cat. AB136). (b) Negative control serum from naive rat. Sera samples obtained from rats 8 weeks after (c,d) AAV9-hAADC transduction revealed a much higher titer of anti-hAADC antibodies (two representative rats) than in rats that received AAV2-hAADC [two representative rats (e,f)]. AAV9, adeno-associated virus serotype 9; hAADC, human aromatic L-amino acid decarboxylase.
Discussion
This study describes a surprising finding. Our experience with AAV2-hAADC has shown that it is safe and free from signs of cell-mediated immunity.13,14 The clinical development of this vector for the treatment of L-dopa-resistance in Parkinson's disease through a phase 1 safety study was not associated with any vector-dependent serious adverse events.8 We have attributed this remarkable safety record to the fact that AAV2 in the brain is strongly neuron-specific and the transgene, AADC, is a human protein. In another study, AAV1-mediated expression of a foreign protein (GFP from Renilla reniformis) in nonhuman primate brain was associated with cell-mediated and humoral immune responses against the transgene.6 Moreover, cerebral injection of AAV5 encoding human α-L-iduronidase in a canine model of Hurler's syndrome triggered the production of antitransgene antibodies.15 Since AAV9 is, like AAV1 and AAV5, not exclusively neuron-specific,2,3,16,17 we asked whether expression of a human AADC, known to be benign when expressed in rat brain neurons,13,18 could engender immune toxicity when expressed in APCs in the brain. We found that this was indeed the case. AAV9-hAADC directed robust expression of AADC when injected into the rat striatum or thalamus, much more so than AAV2-hAADC in fact. Over several weeks, however, we observed a loss of neurons in the transduced region of the brain that was associated with a strong increase in microglial and astrocytic inflammatory markers. Moreover, infiltration by CD8+ lymphocytes into parenchyma suggested that expression of AADC in non-neuronal APC had triggered an immune response to hAADC, and we confirmed this by detecting much higher high titers of anti-hAADC antibodies in the blood of AAV9-hAADC-treated than in AAV2-hAADC-treated, rats. We were concerned initially that this effect was related to disturbances in basal ganglia function by overexpression of an enzyme critical to dopamine synthesis. However, injection of AAV9-hAADC into rat thalamus induced a robust loss of neurons similar to what was observed in striatum. The time-course of the immune response is instructive. Only 7 days after injection of AAV9-hAADC a morphological transition in microglia to an amoeboid shape was observed and these cells became MHC II+ indicating active antigen presentation by 3 weeks. This was followed by the appearance of MHC II in GFAP+ astrocytes and the appearance of circulating anti-AADC antibodies. Together, these data describe a classic cell-mediated immune response against a foreign antigen.
These data suggest that the use of AAV serotypes capable of transducing APC in the brain must be approached with some caution. We have found that expression of AADC in medium spiny neurons in rat and monkey striatum, directed by AAV2-hAADC, produces restricted, transient inflammation and very little humoral immunity against AADC. However, AAV9-hAADC, because it transduces APC in the brain regardless of anatomical location, can elicit a classic immune response against AADC. We suspect that the use of rat AADC rather than human would have not elicited such a response. Human and rat AADC share 89% identity (BlastP) with significant sequence divergence in a number of domains. On this basis, human AADC expressed in rat brain can be expected to be recognized as a foreign protein that elicits a full immune response with associated neuronal damage. We emphasize, however, that these observations do not preclude the use of AAV serotypes that can transduce APC. However, it does potentially complicate preclinical toxicology studies in which non-self proteins are being expressed at a level sufficient to trigger T-cell priming. Thus, in FDA-mandated rat GLP toxicology studies, an AAV9 vector directing expression of a human protein could generate spurious neurotoxicity that would strongly compromise toxicological data and mislead investigators. Similarly, use of transgenes that are foreign to mammals, such as tetracycline transactivator, could be entirely unacceptable for both preclinical and clinical development. We emphasize again, however, that this issue needs to be addressed for each vector construct under study. Finally, it is relevant to ask whether similar immunological issues may also arise with other serotypes as we found with AAV1 some years ago.6
Materials and Methods
Animals: Male Sprague–Dawley rats (350–400 g) were purchased from Charles River Laboratory (www.criver.com/). All animals were caged in groups of three in a room with 12:12 hours light/dark cycle. Temperature and humidity of the animal room were maintained at 19–21 °C and 50–60%, respectively. All animals had free access to food and water. All surgical procedures were conducted in accord with regulations of the Institutional Animal Care and Use Committee of the University of California San Francisco.
Vector infusion. AAV2 and AAV9 harboring hAADC or GFP cDNA under the control of the cytomegalovirus promoter were generated by a triple-transfection technique as previously described.19,20 The vectors were produced by Center for Cellular and Molecular Therapy, The Children's Hospital of Philadelphia Research Vector Core (Philadelphia, PA). Both AAV2 and AAV9 were highly purified, single-stranded vectors, essentially free of empty capsid with only three capsid proteins: VP1, VP2, and VP3 visible by silver staining. Viral titers for each AAV subtype were matched by dilution in phosphate-buffered saline (PBS, pH 7.4) containing 0.001% vol/vol Pluronic F-68. The dose of each AAV used in this study was either 2 × 10¹⁰ or 7 × 10¹⁰ vg per injection site.
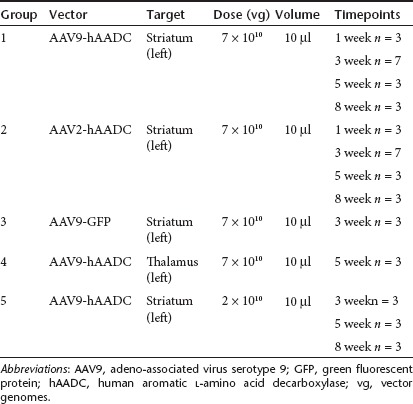
All animals were anesthetized with peritoneal injections of ketamine (5 mg/kg), and then maintained under 2% vol/vol isoflurane for the duration of the surgery in a small-animal stereotactic frame (www.kopfinstruments.com/). The skull was exposed and a burr-hole was created to permit insertion of a cannula for cerebral vector injection. Animals were subdivided into five groups based on the vector subtype, titer or target used (Table 2). All animals received a stereotactic injection of 10 µl of vector in the left hemisphere, infused at a rate of 0.5 µl/minute for 20 minutes. Animals from groups 1, 2, 3, and 5 were infused into the striatum at the following coordinates: antero-posterior (AP) 0.5 mm, mediolateral (ML) 3.0 mm relative to bregma, and ventro-dorsal (VD) -5.0 mm below the dura; and animals from group 4 were infused into thalamus: AP –3.0 mm, ML 2.5 mm, VD –5.5 mm. A customized, stepped silica cannula was used for the infusion as previously described.21 To avoid reflux of vector, the cannula was left in place for 2 minutes after infusion. The skin incision was closed and subcutaneous buprenorphine (Buprenex; 0.01 g/kg) was administered postoperatively as an analgesic. Animals were allowed to recover before returning them to the housing facility.
Table 2. Summary of AAV9-hAADC, AAV2-hAADC, and AAV9-GFP infusions.
Immunohistochemistry. Within each group, animals were killed under deep general anesthesia (sodium pentobarbital, 90 mg/kg intraperitoneal) at 1-, 3-, 5-, and 8-weeks after vector infusion. Anesthetized animals received cardiac perfusion/fixation with 60 ml of ice-cold PBS followed by 60 ml of 4% wt/vol paraformaldehyde in 0.1 mol/l sodium phosphate, pH 7.4. The brains were removed, postfixed for 24 hours in 4% paraformaldehyde and then transferred to 30% wt/vol sucrose in 0.1 mol/l sodium phosphate, pH 7.4, at 4 °C for cryoprotection. The fixed brains were cut into serial 40-µm coronal sections with a freezing microtome (www.thermoscientific.com). Sections were collected in sequence (20 sets of sections), stored in 24-well plates in cryoprotectant solution (0.5 mol/l sodium phosphate buffer, pH 7.4, 30% glycerol, and 30% ethylene glycol) at 4 °C until further processing. Immunohistochemistry was performed on free-floating sections. Briefly, washes with PBS for the horseradish peroxidase (HRP)—based procedure, or in PBS with 0.1% Tween 20 (PBST) for fluorescence staining, were performed between each immunohistochemical step. Endogenous peroxidase activity (for peroxidase-based procedures) was quenched for 30 minutes in 1% vol/vol hydrogen peroxide in PBS. The blocking of unspecific binding was achieved with Background Sniper (www.biocare.net/) for 30 minutes at room temperature. Blocking for NeuN staining used 20% normal horse serum in PBS for 60 minutes at room temperature. Thereafter, sections were incubated overnight with specific primary antibodies. The characteristics of primary antibodies used in the immunohistochemical procedures is as follows: polyclonal rabbit anti-Iba1, PAb, 1:500 (www.biocare.net/); monoclonal mouse and anti GFAP, 1:10,000 (www.millipore.com); polyclonal rabbit and anti GFAP (for fluorescence), 1:500 (www.dako.com, Cat. Z033429-2); monoclonal mouse anti MHC II, 1:80 (www.lsbio.com/); monoclonal mouse anti CD8α, 1:100 (www.abdserotec.com/); monoclonal mouse anti-NeuN, 1:5,000 (www.millipore.com); polyclonal rabbit antihuman AADC, 1:5,000 (www.millipore.com); monoclonal rabbit anti-GFP, 1:500 (www.millipore.com). All antibodies were dissolved in DaVinci diluent (www.biocare.net/);). After three rinses in PBS for 5 minutes each at room temperature, sections for HRP-based staining were incubated with either Mach 2 anti-mouse HRP polymer (www.biocare.net/) or Mach 2 anti-rabbit HRP polymer (www.biocare.net/) for 1 hour at room temperature. The activity of HRP was visualized with commercially available kit with 3,3′-diaminobenzidine peroxide substrate (www.vectorlabs.com/). NeuN-stained sections were counterstained with Nissl stain. Finally, immunostained sections were mounted on gelatinized slides, dehydrated in alcohol and xylene and cover-slipped with Cytoseal (www.fishersci.com/).
For dual fluorescent immunostaining of different antigens (AADC/GFAP and AADC/NeuN; GFP/GFAP and GFP/NeuN; MHC II/GFAP and MHC II/Iba1), a combination of primary antibodies was applied to sections as a cocktail of primary antibodies by overnight incubation at 4 °C. All primary antibodies were dissolved in DaVinci diluent (www.biocare.net/). After three washes in PBST, monoclonal primary antibodies were visualized by incubation in the dark for 1 hour with appropriate secondary fluorochrome-conjugated antibodies: goat anti-mouse DyLight 549 (red), goat anti-rabbit DyLight 549, goat anti-mouse DyLight 488 (green) (www.biocare.net/). All secondary antibodies were dissolved at 1:1,000 dilution in Fluorescence Antibody Diluent (www.biocare.net/). Sections were cover-slipped with Vectashield Hard Set, Mounting Medium for Fluorescence (www.vectorlabs.com/). For staining with MHC II antibody, a thermal antigen retrieval step was included (80 °C for 20 minutes in Diva solution; Biocare Medical; www.biocare.net, Cat. DV2004). Control sections were processed without primary antibodies, and no significant immunostaining was observed under these conditions.
Analysis of brain sections. All processed sections were examined and digitally photographed on a Zeiss Axioskop microscope (www.zeiss.com/) equipped with CCD color video camera and image analysis system (Axiovision Software; www.zeiss.com/). For each rat, the number of hAADC-, GFP-, and NeuN+ cells was determined in both the ipsilateral (transduced) and contralateral (nontransduced) hemisphere from coronal sections through striatum (+1.25 to –0.40 from Bregma) and thalamus (–2.20 to –3.60 from Bregma), yielding ~35-serial sections per structure. Every fourth section, stained for NeuN and every fifth section stained for AADC or GFP, was used for counting. NeuN-, GFP-, or hAADC+ cells were counted at 400-fold magnification from 10 squares (350 × 350 µm) per section. For hAADC- and GFP+ cells, the squares were placed only in the transduced area. The numbers of cells in all fields for each animal were summed, and the cell density per square millimeter was calculated. These analyses permitted quantitative comparisons of the vectors, although they do not reflect the total number of transduced cells in vivo.
CD8+ cells in the ipsilateral and contralateral striatum were counted at 200-fold magnification from three sections selected from three different levels (+1.20, +0.50, and –0.30 from Bregma). CD8+ cell counts in each sampled region (included whole striatum contour) were averaged across sections for each animal and the final data are presented as the mean number of CD8+ cells per section.
Fluorescence microscopy (www.zeiss.com/) was used to determine the number of double-labeled cells in sections. Photomicrographs for double-labeled sections were obtained by merging images from two separate channels (red-rhodamine and green-fluorescein isothiocyanate; colocalization appears yellow) without altering the position of the sections or focus (objective × 40, Carl Zeiss microscope with ApoTome mode). For each double-staining, three sections at ~250-µm intervals were selected from the site of injection. Eight random images were taken from each third section for each evaluated marker. To identify the proportion of each phenotype-specific marker-positive cells expressing: AADC/NeuN and AADC/GFAP; GFP/GFAP and GFP/NeuN; MHC II/GFAP and MHC II/Iba1 each section was counted twice, first using one channel for the number of phenotype-specific cells (GFAP, Iba1, or NeuN) and second a combined channel for the number of costained cells. Finally, the percentage of MHC II/GFAP or MHC II/Iba1 relative to the total GFAP or Iba1; and AADC/NeuN, AADC/GFAP, GFP/GFAP and GFP/NeuN relative to total NeuN or GFAP was determined.
Additionally, in order to identify the histopathological characteristics associated with perivascular cuffing, three adjacent coronal sections (at the rostro-caudal levels of striatum) per animal were stained with hematoxylin–eosin as described previously.6 Each hematoxylin–eosin section was evaluated under a 10x objective. The mean number of the PIF was counted in 10 randomly selected low-power fields in each section (in both ipsilateral and contralateral striatum). More than 10 lymphocytes were required to be in the lumen of blood vessels structures to indicate PIF. Finally the number of PIF was expressed as the mean number of PIF per section.
Quantitation of staining by OD measurement. Both Iba1– and GFAP+ cells were often present in a dense, nearly confluent pattern after AAV9 transduction, making the delineation of individual cells impossible. Therefore, to quantify the extent of activation of Iba1– and GFAP+ cells, we determined the area occupied by Iba1+ cells, by analysis of bright-field OD of the Iba1+ staining in the striatum and SN. The OD value was determined bilaterally at three levels of the striatum per staining (about AP + 1.0, + 0.2, –0.40) and substantia nigra (AP = –4.80, –5.30, –5.80) from each rat. Images of these coronal sections were captured on a high-resolution digital scanner (www.epson.com). In the first step, the images of striatum or SN (converted to the gray-scale) were outlined on the computer screen and then the OD was measured over the defined cross-sectional areas via Image J software (v1.40; rsb.info.nih.gov/ij). For nonspecific background correction, the regional OD value was normalized by subtracting the OD obtained from the unaffected contralateral site (cortex). The mean density in each area was calculated from three adjacent brain sections from the same rat. Finally, the OD of Iba1– or GFAP-stained areas (ST or SN) in the ipsilateral, injected striatum was expressed as a percentage of the density of Iba1 or GFAP in the same areas in the contralateral, noninjected striatum.
Volume of expression. The Ve of hAADC expression derived from AAV2 and AAV9 vectors and Ve of GFP derived from AAV9 vector was measured in brain sections. Every fourth section from +1.25 mm to 0.4 mm from Bregma, with a total of eight sections for each animal, was included in this procedure. Images of the selected sections were captured on a high-resolution digital scanner and were analyzed via Image J software. The contours around the outer margins of the AADC- or GFP- expressing cells on each coronal section were manually defined. Transduced cells outside the striatum were excluded from these contours to ensure that only the striatal Ve of transduced cells was calculated. Ve was then calculated as area defined multiplied by slice thickness. The boundaries of each distribution were defined in the same manner in a series of brain sections.
Dot-blot analysis. Antibodies directed against hAADC were detected by an immunodot blot method described previously.6 Three microliters (60 ng) of a solution of recombinant human AADC protein (hrAADC; www.abcam.com/) was applied as a dot to wet polyvinylidene difluoride membrane (www.bio-rad.com/) cut into 10-mm squares, and allowed to dry. Subsequent immunoblotting was based on the instruction manual for the Opti-4CN substrate kit (www.bio-rad.com/). Rat sera, collected at time of death (8-week time point), were diluted as follows: 1:100, 1:500, 1:1,000, 1:2,000, 1:4,000, and 1:8,000 and incubated with hrAADC dots. HRP-conjugated goat anti-rat immunoglobulin G was used as a secondary antibody at 1:3,000 dilution. After colorimetric development, dot–blots were photographed and the intensities of the signals correlated to serum titer. Sera from three naive rats were used as negative controls. The anti-AADC titer in each case was defined as the dilution at which no measurable signal above negative control could be detected. A mouse monoclonal antibody against hAADC (www.millipore.com) was used as a positive control and in that case HRP-conjugated goat anti-mouse immunoglobulin G was used as the secondary antibody.
Statistical analysis. Analyses are expressed as group mean ± SD The data were evaluated by the Mann–Whitney U-test for nonparametric samples (Statistica 6.0 software). Confidence intervals are quoted as P values in the text.
SUPPLEMENTARY MATERIAL Figure S1. Striatal injection of a lower dose of AAV9-hAADC (2 × 10¹⁰ vg) results in widespread expression of hAADC between 3 and 8 weeks after injection (a, c, e). Figure S2. Fluoro-Jade B (F-J B), DAPI and Nissl staining. Figure S3. The influence of AAV serotype on the level of AADC activity in tissue extracts. Figure S4. Photomicrographs are examples of the morphology of activated microglia (Iba1 staining) found in transduced areas after AAV9-hAADC injection, and are classified into 4 phenotypes: intermediate (a1), small, shrunken cells (a2), amoeboid microglia (a3), and clusters of hyperactive microglia (a4). Materials and Methods.
Acknowledgments
This work is supported by NIH grant R01NS073940 to K.S.B. We also thank Dr Salegio for help with microglial staining.
Supplementary Material
Striatal injection of a lower dose of AAV9-hAADC (2 × 10¹⁰ vg) results in widespread expression of hAADC between 3 and 8 weeks after injection (a, c, e).
Fluoro-Jade B (F-J B), DAPI and Nissl staining.
The influence of AAV serotype on the level of AADC activity in tissue extracts.
Photomicrographs are examples of the morphology of activated microglia (Iba1 staining) found in transduced areas after AAV9-hAADC injection, and are classified into 4 phenotypes: intermediate (a1), small, shrunken cells (a2), amoeboid microglia (a3), and clusters of hyperactive microglia (a4).
REFERENCES
- Forsayeth JR, Eberling JL, Sanftner LM, Zhen Z, Pivirotto P, Bringas J.et al. (2006A dose-ranging study of AAV-hAADC therapy in Parkinsonian monkeys Mol Ther 14571–577. [DOI] [PMC free article] [PubMed] [Google Scholar]
- Foust KD, Nurre E, Montgomery CL, Hernandez A, Chan CM., and, Kaspar BK. Intravascular AAV9 preferentially targets neonatal neurons and adult astrocytes. Nat Biotechnol. 2009;27:59–65. doi: 10.1038/nbt.1515. [DOI] [PMC free article] [PubMed] [Google Scholar]
- Gray SJ, Matagne V, Bachaboina L, Yadav S, Ojeda SR., and, Samulski RJ. Preclinical differences of intravascular AAV9 delivery to neurons and glia: a comparative study of adult mice and nonhuman primates. Mol Ther. 2011;19:1058–1069. doi: 10.1038/mt.2011.72. [DOI] [PMC free article] [PubMed] [Google Scholar]
- Samaranch L, Salegio EA, San Sebastian W, Kells AP, Foust KD, Bringas JR.et al. (2012Adeno-associated virus serotype 9 transduction in the central nervous system of nonhuman primates Hum Gene Ther 23382–389. [DOI] [PMC free article] [PubMed] [Google Scholar]
- Forsayeth JR., and, Bankiewicz KS. AAV9: over the fence and into the woods. Mol Ther. 2011;19:1006–1007. doi: 10.1038/mt.2011.95. [DOI] [PMC free article] [PubMed] [Google Scholar]
- Hadaczek P, Forsayeth J, Mirek H, Munson K, Bringas J, Pivirotto P.et al. (2009Transduction of nonhuman primate brain with adeno-associated virus serotype 1: vector trafficking and immune response Hum Gene Ther 20225–237. [DOI] [PMC free article] [PubMed] [Google Scholar]
- Eberling JL, Jagust WJ, Christine CW, Starr P, Larson P, Bankiewicz KS.et al. (2008Results from a phase I safety trial of hAADC gene therapy for Parkinson disease Neurology 701980–1983. [DOI] [PubMed] [Google Scholar]
- Christine CW, Starr PA, Larson PS, Eberling JL, Jagust WJ, Hawkins RA.et al. (2009Safety and tolerability of putaminal AADC gene therapy for Parkinson disease Neurology 731662–1669. [DOI] [PMC free article] [PubMed] [Google Scholar]
- Bankiewicz KS, Eberling JL, Kohutnicka M, Jagust W, Pivirotto P, Bringas J.et al. (2000Convection-enhanced delivery of AAV vector in parkinsonian monkeys; in vivo detection of gene expression and restoration of dopaminergic function using pro-drug approach Exp Neurol 1642–14. [DOI] [PubMed] [Google Scholar]
- Anderson KJ, Fugaccia I., and, Scheff SW. Fluoro-jade B stains quiescent and reactive astrocytes in the rodent spinal cord. J Neurotrauma. 2003;20:1223–1231. doi: 10.1089/089771503770802899. [DOI] [PubMed] [Google Scholar]
- Colombo JA., and, Puissant VI. Fluoro Jade stains early and reactive astroglia in the primate cerebral cortex. J Histochem Cytochem. 2002;50:1135–1137. doi: 10.1177/002215540205000815. [DOI] [PubMed] [Google Scholar]
- Damjanac M, Rioux Bilan A, Barrier L, Pontcharraud R, Anne C, Hugon J.et al. (2007Fluoro-Jade B staining as useful tool to identify activated microglia and astrocytes in a mouse transgenic model of Alzheimer's disease Brain Res 112840–49. [DOI] [PubMed] [Google Scholar]
- Sanftner LM, Suzuki BM, Doroudchi MM, Feng L, McClelland A, Forsayeth JR.et al. (2004Striatal delivery of rAAV-hAADC to rats with preexisting immunity to AAV Mol Ther 9403–409. [DOI] [PubMed] [Google Scholar]
- Hadaczek P, Eberling JL, Pivirotto P, Bringas J, Forsayeth J., and, Bankiewicz KS. Eight years of clinical improvement in MPTP-lesioned primates after gene therapy with AAV2-hAADC. Mol Ther. 2010;18:1458–1461. doi: 10.1038/mt.2010.106. [DOI] [PMC free article] [PubMed] [Google Scholar]
- Ciron C, Desmaris N, Colle MA, Raoul S, Joussemet B, Vérot L.et al. (2006Gene therapy of the brain in the dog model of Hurler's syndrome Ann Neurol 60204–213. [DOI] [PubMed] [Google Scholar]
- Howard DB, Powers K, Wang Y., and, Harvey BK. Tropism and toxicity of adeno-associated viral vector serotypes 1, 2, 5, 6, 7, 8, and 9 in rat neurons and glia in vitro. Virology. 2008;372:24–34. doi: 10.1016/j.virol.2007.10.007. [DOI] [PMC free article] [PubMed] [Google Scholar]
- Tenenbaum L, Chtarto A, Lehtonen E, Velu T, Brotchi J., and, Levivier M. Recombinant AAV-mediated gene delivery to the central nervous system. J Gene Med. 2004;6 Suppl 1:S212–S222. doi: 10.1002/jgm.506. [DOI] [PubMed] [Google Scholar]
- Sánchez-Pernaute R, Harvey-White J, Cunningham J., and, Bankiewicz KS. Functional effect of adeno-associated virus mediated gene transfer of aromatic L-amino acid decarboxylase into the striatum of 6-OHDA-lesioned rats. Mol Ther. 2001;4:324–330. doi: 10.1006/mthe.2001.0466. [DOI] [PubMed] [Google Scholar]
- Matsushita T, Elliger S, Elliger C, Podsakoff G, Villarreal L, Kurtzman GJ.et al. (1998Adeno-associated virus vectors can be efficiently produced without helper virus Gene Ther 5938–945. [DOI] [PubMed] [Google Scholar]
- Wright JF, Qu G, Tang C., and, Sommer JM. Recombinant adeno-associated virus: formulation challenges and strategies for a gene therapy vector. Curr Opin Drug Discov Devel. 2003;6:174–178. [PubMed] [Google Scholar]
- Yin D, Forsayeth J., and, Bankiewicz KS. Optimized cannula design and placement for convection-enhanced delivery in rat striatum. J Neurosci Methods. 2010;187:46–51. doi: 10.1016/j.jneumeth.2009.12.008. [DOI] [PMC free article] [PubMed] [Google Scholar]
Associated Data
This section collects any data citations, data availability statements, or supplementary materials included in this article.
Supplementary Materials
Striatal injection of a lower dose of AAV9-hAADC (2 × 10¹⁰ vg) results in widespread expression of hAADC between 3 and 8 weeks after injection (a, c, e).
Fluoro-Jade B (F-J B), DAPI and Nissl staining.
The influence of AAV serotype on the level of AADC activity in tissue extracts.
Photomicrographs are examples of the morphology of activated microglia (Iba1 staining) found in transduced areas after AAV9-hAADC injection, and are classified into 4 phenotypes: intermediate (a1), small, shrunken cells (a2), amoeboid microglia (a3), and clusters of hyperactive microglia (a4).