

Abstract
Protocatechuic acid (PCA), a major microbial-mediated metabolite of anthocyanins, has significant anti-oxidative and anti-carcinogenic activities in vitro and in vivo; however, its pharmacokinetics remains largely unknown. In this report, a sensitive and rapid LC-MS/MS method was developed and validated for the measurement of PCA concentrations in both mouse and human plasma. This method showed a linearity of 1-1000 ng/mL in both mouse and human plasma with a lower limit of quantification of 1 ng/mL. The within-day and between-day coefficient of variation ranged from 1.18 to 11.8% and accuracy from 92 to 110%. The method was applied to characterize the pharmacokinetics of PCA in mice after oral administration of 50 mg/kg PCA. PCA was absorbed rapidly with a half-life of 2.9 min, reached a peak plasma level (Cmax) of 73.6 μM at 5 min, and remained detectable up to 8 h with the initial elimination half-life of about 3 min and a terminal half-life of 16 min. The area under the plasma concentration-time curve (AUC0→8h) of PCA was 1456 μM.min. The method was capable of detecting low ng/mL quantities of PCA in the plasma of patients with prostate cancer after an oral ingestion of 60 g of black raspberry (BRB) powder. Because PCA is derived from the anthocyanins in BRB, our method provides a useful analytical tool to further investigate the metabolism of anthocyanins, and the pharmacology of PCA in future preclinical and clinical studies.
Keywords: Protocatechuic acid, LC-MS/MS, pharmacokinetics, plasma
1. Introduction
Protocatechuic acid (PCA; 3,4-dihydroxybenzoic acid) is a phenolic compound ubiquitously present in many fruits, nuts, vegetables, grains, plant-derived beverages, white grape wine, and various medicinal plants including the Chinese herbal medicines: Salvia miltiorrhiza (Danshen) and Hibiscus sabdariffa L. [1-7]. Recently, PCA was found to be the major stable metabolite of anthocyanins found abundantly in vegetables and fruits [8, 9].
Investigations of the functions of PCA have focused primarily on its anti-oxidant activities or the suppression of tumor cell proliferation [10]. PCA elicits anti-proliferative and pro-apoptotic effects in cancer cells [3, 11], and retards the invasive and metastatic capacity of tumor cells in a mouse model [10]. PCA inhibits chemically-induced carcinogenesis in the liver, colon, oral cavity, glandular stomach, urinary bladder, pancreas, and skin of rodents due, in part, to its ability to scavenge free radicals [4, 12, 13]. For example, PCA (1000 ppm) fortified diets elicit potent chemo-preventive effects on colon and oral carcinogenesis in rats [14]. PCA is also a potent anti-diabetic and anti-glycation agent via its ability to lower plasma glucose and increase plasma insulin levels [5].
The pharmacokinetics (PK) of PCA has not been well characterized. The major analytical methods developed to investigate the plasma PK of PCA include LC-CE, LC-UV, GC-MS and LC-MS [1, 15-19]. Recently, LC-MS/MS methods have been used for PCA analysis in black raspberries and some biological matrices including rat plasma and GI tract contents [20]. These methods, however, have not been strictly validated. We, therefore, developed and validated a simple and rapid LC-MS/MS method for the quantification of PCA in human and mouse plasma. In the present report, we describe the use of this method to study the pharmacokinetics of PCA in the mouse and to detect PCA in the plasma of prostate cancer patients following oral ingestion of Black Raspberry (BRB) and their component-anthocyanins.
2. Materials and Methods
2.1 Reagents and chemicals
Protocatechuic acid (PCA, ≥ 97%) and 3-nitro-4-hydroxybenzoic acid (NHBC, 98%) were purchased from Sigma-Aldrich Chemical Co. (Milwaukee, WI) and used without further purification. Analytical HPLC grade acetonitrile (ACN), ethyl acetate and formic acid (FA) were obtained from Fisher Scientific (Waltham, MA). Heparin-treated human plasma was obtained from the Red Cross (Columbus, OH). Heparin-treated mouse plasma was purchased from LAMPIRE Biological Laboratories, Inc. (Pipersville, PA). A Barnstead E-pure water purification system (Dubuque, IA) was used to obtain HPLC grade water (> 18 mΩ).
2.2 Preparation of calibration standards and quality controls for LC-MS/MS analysis
NHBC, a phenolic acid with a similar structure to PCA, was selected as the internal standard (IS.). Stock solutions (1 mg/mL) of PCA and the IS. were prepared in ACN and stored in a -80°C freezer. Ten standard working solutions with concentrations ranging from 10 to 10,000 ng/mL were prepared by dilution with 50% ACN water solution (v:v) containing 0.2% FA (v:v). For construction of the calibration curve, 10 μL of appropriately diluted standard working solutions and 10 μL IS. (10 μg/mL, final concentration of 1000 ng/mL in the reconstitution sample) were spiked into 100 μL human or mouse plasma, and the mixture was acidified by adding 2 μL FA. Quality controls (QCs) were prepared using 1, 5, 50 and 500 ng/mL concentrations. After acidification, the samples were extracted with 1.0 mL ethyl acetate on a mechanical shaker for 15 min, and then centrifuged at 12,000 rpm for 1 min, and the ethyl acetate layer collected and evaporated to dryness under a stream of nitrogen. The residue was reconstituted in 100 μL of 50% ACN water solution (v:v) containing 0.2% FA (v:v). The reconstituted solution was centrifuged at 12,000 rpm for 2 min, and a 25 μL aliquot of the supernatant was analyzed using LC-MS/MS.
2.3 Determination of PCA in human and mouse plasma by LC-MS/MS
A 100 μL aliquot of human or mouse plasma was mixed with 10 μL IS. and the mixture was acidified and extracted according to the protocol described in Section 2.2. Finally, an aliquot of 25 μL reconstituted solutions was injected for LC-MS/MS analysis under the condition described in Section 2.7.
2.4 Stability of PCA in various matrices
2.4.1 Stability of PCA in human and mouse plasma
PCA (0.5 and 5.0 μg/mL) was incubated in human or mouse plasma in a 37°C water bath. At designated time points, 100 μL plasma samples were drawn and stored at -80°C. PCA concentrations were determined by the LC-MS/MS method as in Section 2.3.
2.4.2 Stability of PCA in storage solution
The freshly prepared PCA stock solution (1mg/mL) and the stored PCA solution (1mg/mL) were diluted to 500 ng/mL with 1000 ng/mL I.S.. The PCA content in these two sets of samples (in six replicates) was compared by the LC-MS/MS method as in Section 2.3.
2.4.3 Freeze-thaw stability of PCA in human and mouse plasma
PCA solution was spiked into human or mouse plasma to make 5, 50 and 500 ng/mL concentration in triplicates and then stored in a -80°C freezer. These samples were exposed to three sequential freeze-thaw cycles prior to sample analysis. During each cycle, the samples were thawed at 4°C for approximately 60 min and were restored at -80°C for the next freezing cycle at 6 h intervals. The PCA concentrations in plasma were determined by the LC-MS/MS method as described in Section 2.3.
2.4.4 Short-term storage stability of PCA in mouse plasma
2-week stability of PCA in mouse plasma stored at -80°C was tested. PCA solution was spiked into mouse plasma to make 50, 500 and 5000 ng/mL concentrations in triplicates and then stored in a −80°C freezer. On day 15, the PCA concentrations in these mouse plasma samples were determined by the LC-MS/MS method as described in Section 2.3.
2.5 Recovery and matrix effects
A post-extraction spike experiment was performed to evaluate the recovery and matrix effects of the I.S. and PCA in human and mouse plasma following extraction with ethyl acetate. Three separate groups of PCA samples at concentrations of 5, 50 and 500 ng/mL and I.S. at 1000 ng/mL were prepared as follows: Group A, I.S. and PCA were prepared directly in 50% ACN water solution (v:v) containing 0.2% FA (v:v); Group B, I.S. and PCA were spiked into reconstituted extract of blank human or mouse plasma; and Group C, PCA was spiked into mouse or human plasma followed by acidification, extraction and reconstitution according to the protocol described in Section 2.2. The recovery of PCA was calculated by the ratio of peak areas of PCA in Group C samples to the corresponding Group B samples. Matrix effects of PCA were evaluated by the ratio of peak areas of Group B samples to that of Group A samples.
2.6 LC-MS/MS assay validation
The intra-day validation for both human and mouse plasma samples was determined in six replicates at concentrations of 1, 5, 50 and 500 ng/mL, and the inter-day validation was determined across these concentrations in triplicates in three different days. Calibration curves were fitted by a linear regression without a weighting factor. The mean concentrations and the coefficients of variation (CVs) were calculated as the relative standard deviation from the replicates. The accuracy of the assay was determined by comparing the calculated mean concentrations with the corresponding nominal concentrations. The lower limit of quantification (LLOQ) was defined as the lowest concentration in the calibration curve that back-calculates with good accuracy (80%-120%) and precision (CV≤20), and the signal/noise ratio of the analyte peak was greater than 10.
2.7 HPLC chromatographic and mass spectrometric conditions
Liquid chromatography was performed using a Shimadzu HPLC system (Shimadzu, Columbia, MD) consisting of a SCL-10Avp system controller, two LC-10ADvp pumps, a SIL-10ADvp auto-sampler, and a degasser. PCA and the IS. were separated on an Aquasil C18 column (2.1mm×250mm, 5μm particle size, Thermo Hypersil-Keystone, Bellefonte, PA) coupled with a Beta C18 guard column (2.1mm×10mm, 2 μm, Thermo Hypersil-Keystone, Bellefonte, PA) under isocratic elution at a flow rate of 0.2 mL/min. The mobile phase consisted of 35% ACN in deionized water (v:v) containing 0.2% FA (v:v).
PCA and the IS. were monitored using a Sciex API3000 triple quadrupole mass spectrometer (Applied Biosystems/MDS Sciex, Foster City, CA) equipped with an electro-spray ionization (ESI) source. The mass spectrometer was operated in negative ESI mode, at an electro-spray needle voltage of 3800 V, a nebulizer gas flow of 15, a curtain gas flow of 8 and a heated capillary temperature of 450°C. PCA and the IS. were analyzed by multiple reaction monitor (MRM) mode using ion transitions at proper collision energy (CE) as follows: PCA m/z 153 > m/z 109 (E = 22%) and IS. m/z 182 > m/z 138 (E = 17%). The mass spectrometer was tuned to its optimal sensitivity by direct infusion of PCA. The data acquisition and peak integration were performed using Analyst software (1.4).
2.8 Pharmacokinetics of PCA in mice
4-6 week-old CF-1 female mice (∼25 g) were obtained from Charles River Laboratories, Wilmington, MA. All the mice were housed in The Ohio State University Animal Research Facility under climate-controlled environment with a 12 h light/dark cycle. Mice were allowed free access to food pellets and water. Procedures for handling the mice were in compliance with policies of The Ohio State University Laboratory Animal Resources (ULAR) which adhere to the guidelines described in “Principles of Laboratory Animal Care” by National Institutes of Health. The mice were randomly divided into ten groups with six mice in each group. They were fasted overnight for 12 h before experiment with free access to water.
Approximately 250 μL (adjusted by body weight) of water solution of PCA (5 mg/mL) was administered to each mouse by oral gavage resulting in a dose of 50 mg/kg PCA. Blood was collected by cardiac puncture under CO2 anesthesia at 2, 5, 10, 20, 30 and 45 min and at 1, 2, 4 and 8 h after dosing. Blood samples in heparinized vials were centrifuged at 1000 × g for 3 min in a 4°C micro-centrifuge and the supernatant were collected and immediately frozen on dry-ice. And then the samples were stored at −80°C until analysis. PCA levels in mouse plasma were measured using the aforementioned LC-MS/MS assay. Plasma concentration-time data were analyzed using WinNonlin computer software (Pharsight 5.0, Mountain View, CA).
2.9 Quantification of PCA in plasma samples collected from patients with prostate cancer after an oral ingestion of BRB powder
Patients with a histologically confirmed diagnosis of prostate adenocarcinoma each received freeze-dried BRB, 20 grams orally in 100 mL water, three times per day (total = 60g/day) for a period of 21 days. The BRB were consumed at least one half hour after meals. Ten-mL blood samples were collected prior to the initiation of BRB treatment and within 6-12 h after the three-week course of BRB treatment, and prior to prostatectomy. Blood was collected in K2 EDTA tubes, placed on ice, and then centrifuged at 1875 × g for 10 min at 4°C. Plasma was separated and maintained on ice, protected from light, and stored at −80°C until assayed for PCA analysis according to the extraction and LC-MS/MS protocol detailed in Sections 2.2 and 2.3.
3. Results and Discussion
3.1 LC-MS/MS analysis of PCA and I.S
To acquire mass spectra, PCA or the I.S. stock solutions were added to 50% ACN water solution (v:v) plus 0.2% FA (v:v), each at a concentration of 10 μg/mL, and sample was infused with an LC flow of 0.2 mL/min into the mass spectrometer. Due to poor ionization of PCA in positive mode, the mass spectrum scan was set under negative ESI mode. The full scan mass spectrum (Fig. 1A) of PCA showed an ion of m/z 153, corresponding to its deprotonated molecular ion [M-H]−. The [M-H]− ion of PCA was subjected to collision induced dissociation (CID) and a fragment ion at m/z 109, 44 Dalton less than its parent ion, was observed (Fig. 1B). This ion is probably formed from the loss of a CO2 from the carboxylic acid (Fig. 1A inset). Collision energies were optimized for PCA to obtain the most intense fragment ion of m/z 109. The following MRM transition channel: m/z 153→109 was selected to monitor PCA according to its mass and CID spectra. Similarly, the full scan mass spectrum (Fig. 1C) of the I.S. showed an ion of m/z 182, corresponding to its deprotonated molecular ion [M-H]−, and the CID spectrum of the [M-H]− ion yielded a fragment ion at m/z 138, 44 Dalton less than its parent ion, as shown in Fig. 1D. The MRM transition channel of m/z 182→138 was therefore selected to monitor the IS.
Figure 1. Mass spectra of protocatechuic acid (PCA) and 3-nitro-4-hydroxybenzoic acid (NHBC).


the average 1-min full mass spectra of 10 μg/mL PCA (A) and 10 μg/mL NHBC (C) in 50% ACN/0.2% FA (v:v) showed base ions at m/z 152.9 and 181.9, respectively, corresponding to their deprotonated molecular ions [M-H]−; the average 1-min product ion spectra of ions of m/z 152.9 and 181.9 showed base ions at m/z 108.9 (B) and 137.9 (D), respectively, which may be generated by a neutral loss of a CO2 from PCA or NHBC, respectively. Insets: structures of PCA (A), NHBC (C), and their putative fragments.
3.2 Extraction, matrix effect, recovery yield and HPLC conditions for the separation of PCA from the I.S. and endogenous interferences in mouse and human plasma
In our earlier studies, PCA was extracted from biological matrices either by protein precipitation or liquid-liquid extraction using ethyl acetate. Normally, liquid-liquid extraction provides cleaner matrices for LC-MS/MS analysis. However, our initial analysis showed that liquid-liquid extraction of plasma samples at neutral pH yielded low recovery for both PCA and the IS., which may have been due to their existence as a salt. We expected therefore that acidification of the mouse and human plasma may improve the recovery rate of both PCA and the IS. To ensure compatible conditions for LC-MS/MS analysis, and to avoid potential chloride interference, FA was used to acidify the samples to pH 2. At pH 2 most of the PCA and the IS. should exist in non-ionic form in plasma and be more readily extractable to organic phases. Using these conditions, matrix effects and extraction recoveries for PCA at concentrations of 5, 50 and 500 ng/mL in mouse and human plasma were evaluated. Matrix effects and recovery of PCA in mouse plasma were 100-111% and 76-82%, respectively (Table 2). Similar values for matrix effects and recovery were obtained for PCA in human plasma samples (Table 2).
Table 2.
Matrix and recovery effects of PCA and the IS. in mouse or human plasma.
| Mouse plasma (n=3) | Human plasma (n=3) | ||||
|---|---|---|---|---|---|
| Matrix effect (Mean±SD) | Recovery (Mean±SD) | Matrix effect (Mean±SD) | Recovery (Mean±SD) | ||
| PCA | 5 | 99.7±4.0 | 76.3±14.1 | 69.9±1.1 | 82.2±2.7 |
| (ng/mL) | 50 | 111.4±6.6 | 82.4±1.1 | 72.4±1.0 | 75.8±12.1 |
| 500 | 93.8±2.8 | 77.6±14.8 | 86.7±2.4 | 75.7±2.6 | |
| I.S. | 5 | 97.4±4.5 | 95.6±5.7 | 107.5±3.9 | 93.1±5.4 |
| (ng/mL) | 50 | 114.4±1.9 | 90.6±2.5 | 100.6±2.2 | 94.5±1.4 |
| 500 | 125.4±3.6 | 90.3±2.3 | 96.2±0.4 | 95.3±1.2 | |
An Aquasil C18 column (2.1 mm×250 mm with 5 μm particle size) was selected to separate PCA from the IS. and the endogenous interferences (mainly isobars of PCA) in mouse and human plasma under the LC conditions as described in Experiment Section 2.7. As shown in Fig. 2, there was a single peak at about 7.0 min in the extracted ion chromatogram (XIC) in blank human plasma (Fig. 2A1) and in blank mouse plasma (Fig. 2C1) via channel of m/z 153→109 (PCA), but no peak observed in the XICs of either mouse or human plasma via channel of m/z 182→138 (IS.) (Fig. 2B1 and Fig. 2D1). The XIC of human plasma spiked with 1 ng/mL PCA (Fig. A2) showed one small peak with a retention time of 4.2 min, fortunately, which is baseline separated from the interference peak at 7.0 min, with a shoulder peak at approx. 5.5 min adjacent to the 7.0-min peak. There is a single peak at 8.9 min in the XIC of the IS. (1000 ng/mL) in both human and mouse plasma. These results indicate that this LC method is capable of separating PCA from the IS. and the endogenous interferences from mouse and human plasma with a retention time of 4.2 min (Fig. 2B2 and Fig. 2D2). The retention times of PCA and the IS. are consistent with their hydrophobicity. There was no significant carry over observed in the concentrations of calibration standards in both human and mouse plasma.
Figure 2. The extracted ion chromatograms (XIC) of PCA and the internal standard(I.S.).

the XICs of PCA (A-1) and the IS. (B-1) of the extraction residue from blank human plasma and human plasma spiked with 1 ng/mL PCA (A-2), 1000 ng/mL IS. (B-2) and the XICs of PCA (A-3) from a human plasma sample collected from a patient with prostate cancer with oral ingestion of BRB; the extracted ionic chromatograms of PCA (C-1), and the IS. (D-1) of the extraction residue from blank mouse plasma and mouse plasma spiked with 1 ng/mL PCA (C-2), 1000 ng/mL IS. (D-2) and the XICs of PCA (C-3) from a mouse plasma sample collected from a mouse after an oral administration of 50 mg/kg PCA aqueous solution.
3.3 Method validation
Using the above-described LC-MS/MS conditions, the linearity of the method was evaluated at 1, 2, 5, 10, 20, 50, 100, 200, 500 and 1000 ng/mL PCA with the linear coefficient of determination >0.999 in both human and mouse plasma. The method was then validated for intra-day (six replicates) and inter-day (three replicates) variations using PCA at plasma concentrations of 1, 5, 50 and 500 ng/mL. The validation parameters-accuracies and coefficients of variation in both human and mouse plasma are listed in Table 1. As shown in Table 1, these within and between-day validation parameters meet the FDA criteria for accuracy and precision for a validated bioanalytical method. [21]
Table 1.
Intra- and inter-day validation parameters of PCA in human and mouse plasma.
| A. Human plasma | ||||||
|---|---|---|---|---|---|---|
|
| ||||||
| PCA (ng/mL) | Intra-day (n=6) | Inter-day (n=3) | ||||
| Mean | Accuracy (%) | C.V. (%) | Mean | Accuracy (%) | C.V. (%) | |
| 1 | 1.02 | 102.00 | 6.60 | 1.05 | 105.27 | 3.77 |
| 5 | 5.09 | 101.71 | 1.18 | 5.01 | 100.30 | 4.64 |
| 50 | 46.07 | 92.04 | 2.76 | 46.46 | 92.92 | 5.65 |
| 500 | 524.77 | 104.95 | 3.83 | 549.15 | 109.83 | 3.60 |
|
| ||||||
| B. Mouse plasma | ||||||
|
| ||||||
| PCA (ng/mL) | Intra-day (n=6) | Inter-day (n=3) | ||||
|
| ||||||
| Mean | Accuracy (%) | C.V. (%) | Mean | Accuracy (%) | C.V. (%) | |
|
| ||||||
| 1 | 0.98 | 97.85 | 4.13 | 0.97 | 96.77 | 6.40 |
| 5 | 5.23 | 104.54 | 5.10 | 5.09 | 101.71 | 2.39 |
| 50 | 53.65 | 107.30 | 7.77 | 49.95 | 99.91 | 11.80 |
| 500 | 537.33 | 107.47 | 6.21 | 521.51 | 104.30 | 5.65 |
3.4 Stability of PCA in various matrices
The stability of PCA in human and mouse plasma at concentrations of 0.5 and 5.0 μg/mL was investigated at 0, 30 mins and at 1, 2, 4, 8 and 24 h at 37°C. PCA was found to be stable in human plasma during 24-h incubation. In mouse plasma, however, PCA decomposed rapidly with a half-life of 90 min and 314 min at 0.5 and 5.0 μg/mL, respectively (Fig. 3). The stability of PCA was further investigated in human and mouse plasma during three freeze-thaw cycles. The results showed that PCA was stable in both human and mouse plasma samples going through three freeze-thaw cycles. The PCA degradation was less than 15% at concentrations of 5, 50 and 500 ng/mL. A short-term stability test of PCA in mouse plasma was also performed. After 14-day storage at -80°C, the PCA content in stored samples was determined to be from 93-109% compared to freshly prepared samples in concentration range of 50-5000 ng/mL. The results indicated that PCA was stable at −80°C for short-term storage. PCA was found very stable in stock solution, no degradation was observed in the PCA stock which has been stored for longer than six months at −80°C.
Figure 3. The stability of PCA in mouse plasma (A) and human plasma (B).
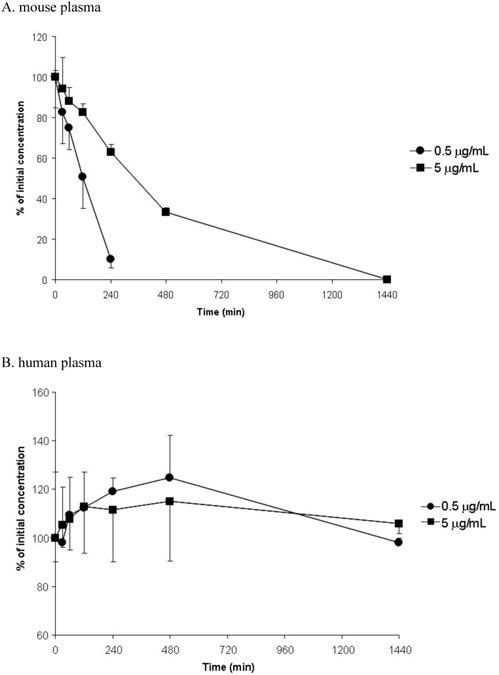
PCA(0.5 and 5 μg/mL) was incubated in mouse plasma or human plasma at 37 °C and PCA content was determined by the LC-MS/MS method.
3.5 Pharmacokinetic analysis of orally administered PCA solution
To determine the pharmacokinetics of PCA in mice, an aqueous solution (5 mg/mL in deionized water) was administrated to CF-1 mice at an oral dose of 50 mg/kg. This dose was evaluated because previous studies showed that 500 ppm and 1000 ppm PCA fortified diet can prevent colon tumor formation without adverse effects in AOM-treated rats in a dose dependent manner at the initiating stage. These doses correspond to 50 and 100 mg/kg daily PCA assuming that a 200 g rat can consume 20 g diet daily. As shown in Fig. 4, the profile of time and plasma concentration of PCA following oral administration (n=6 for each time point) indicates that PCA is absorbed rapidly with the mean time (Tmax=4.87 min) to reach the peak level (Cmax=73.6 μM) of PCA followed by a two-phase elimination. The pharmacokinetic parameters of PCA in mouse plasma were calculated using a two-compartmental mode in WinNonlin software and these parameters are listed in Table 3. The absorption half-life (K01-HL) of PCA is 2.9 min and the area under the curve (AUC0→8h) of PCA is 1456 μM.min. The distribution half-life (t1/2α) of PCA is 2.9 min and the terminal half-life (t1/2β) is 16.0 min. The volume distribution (V2-F) is about 32.6 mL and the clearance (CL-F) of PCA is about 4.46 mL/min. Notably, PCA can reach a Cmax of 73.6 μM, suggesting that a biologically effective plasma level of PCA can be reached in mice following oral administration [1, 10].
Figure 4. Plasma concentration-time profile of PCA in mice after an oral administration at a dose of 50 mg/kg PCA aqueous solution (n=6).

Table 3.
Pharmacokinetic parameters of PCA in mice (n=6) after oral administration of 50 mg/kg PCA.
| Parameters (Units) | |
|---|---|
| AUC (min*μM) | 1456 |
| K01_HL (min) | 2.8 |
| K10_HL (min) | 5.84 |
| α (1/min) | 0.24 |
| β (1/min) | 0.043 |
| t1/2α (min) | 2.93 |
| t1/2β (min) | 15.96 |
| A (μM) | 3011.8 |
| B (μM) | 46.8 |
| CL_F (mL/min) | 4.46 |
| V2_F (mL) | 32.4 |
| CLD2_F (mL/min) | 2.81 |
| Tmax (min) | 4.87 |
| Cmax (μM) | 73.6 |
3.6 Detection PCA in human plasma from patients with prostate cancer after an oral ingestion of 60 g of BRB powder
Recently, PCA has been found to be a major metabolite of the anthocyanins [22]. In addition, the PCA plasma level in healthy volunteers accounted for more than 30% of orally ingested anthocyanins from blood orange [8, 9]. However, there are no reports on the plasma level of PCA in humans after oral administration of BRB powder containing high concentrations of anthocyanins. Therefore, using the method described above, we measured PCA levels in plasma samples collected from patients with prostate cancer after continuous oral administration of 60 g BRB powder/day for 21 days. Plasma samples from five patients were obtained prior to and after ingestion of BRB. PCA with a mean concentration of 3.90 ng/mL was detected in plasma samples five out of five patients ingested with 60 g BRB. This result demonstrated that our method can detect relatively low concentration of PCA in human plasma samples. Therefore, this method will provide a useful analytical tool for further evaluation the in vivo conversion of BRB anthocyanins to PCA in preclinical and clinical studies.
4. Conclusion
A sensitive and rapid LC-tandem MS method for quantification of PCA with an LLOQ of 1.0 ng/mL was developed and fully validated in human and mouse plasma. The method has been successfully applied to evaluate the stability of PCA in mouse and human plasma, to study the pharmacokinetics of PCA in mouse, and to measure the plasma level of PCA in patients with prostate cancer after oral ingestion of 60 g BRB. PCA is stable in human plasma up to 24 h. In contrast, PCA decomposed rapidly in mouse plasma in a dose dependent manner. Oral ingestion of 50 mg/kg PCA aqueous solution can deliver in vivo pharmacological effective concentration of PCA at 5 min, possible through gastric absorption. Notably, low ng/mL of PCA was detected in human plasma from patients with prostate cancer after an oral ingestion BRB. Therefore, this method provides a useful analytical tool for future pre-clinical and clinical pharmacological studies of PCA or anthocyanin-derived PCA from BRB or other anthocyanin-containing products.
Highlights.
We developed and validated an LC-MS/MS method for the quantification of PCA in plasma
This method was used to characterize the pharmacokinetics of PCA in the mouse
This method detected PCA in the plasma of patients following oral ingestion of BRB
This method provides a translational tool for preclinical and clinical studies of PCA
Acknowledgments
This work was supported by National Institute of Health (NIH) grants [R21 CA132138, & RC2 CA148099] (SRM) and Biomedical Mass Spectrometric Laboratory (KKC and ZL) at The Ohio State University
Abbreviations
- PCA
protocatechuic acid
- NHBC
3-nitro-4-hydroxybenzoic acid
- BRB
black raspberry
- ACN
acetonitrile
- FA
Formic acid
- QC
quality control
- LLOQ
lower limit of quantification
- HPLC
high performance liquid chromatography
- LC-MS
liquid chromatography-mass spectrometry
- GC-MS
gas chromatography-mass spectrometry
- LC-CE
liquid chromatography-capillary electrophoresis
- LC-UV
liquid chromatography-ultraviolet
- MRM
multiple reaction monitor
- XIC
extracted ion chromatogram
- ESI
electro-spray ionization
- CID
collision induced dissociation
Footnotes
Publisher's Disclaimer: This is a PDF file of an unedited manuscript that has been accepted for publication. As a service to our customers we are providing this early version of the manuscript. The manuscript will undergo copyediting, typesetting, and review of the resulting proof before it is published in its final citable form. Please note that during the production process errors may be discovered which could affect the content, and all legal disclaimers that apply to the journal pertain.
References
- 1.Lin CY, Tsai SJ, Huang CS, Yin MC. J Agric Food Chem. 2011;59:5117–5124. doi: 10.1021/jf200103f. [DOI] [PubMed] [Google Scholar]
- 2.Anter J, Romero-Jimenez M, Fernandez-Bedmar Z, Villatoro-Pulido M, Analla M, Alonso-Moraga A, Munoz-Serrano A. J Med Food. 2011;14:276–283. doi: 10.1089/jmf.2010.0139. [DOI] [PubMed] [Google Scholar]
- 3.Yin MC, Lin CC, Wu HC, Tsao SM, Hsu CK. J Agric Food Chem. 2009;57:6468–6473. doi: 10.1021/jf9004466. [DOI] [PubMed] [Google Scholar]
- 4.Babich H, Sedletcaia A, Kenigsberg B. Pharmacol Toxicol. 2002;91:245–253. doi: 10.1034/j.1600-0773.2002.910505.x. [DOI] [PubMed] [Google Scholar]
- 5.Lin CY, Huang CS, Huang CY, Yin MC. J Agric Food Chem. 2009;57:6661–6667. doi: 10.1021/jf9015202. [DOI] [PubMed] [Google Scholar]
- 6.Krajka-Kuzniak V, Szaefer H, Baer-Dubowska W. Toxicology. 2005;216:24–31. doi: 10.1016/j.tox.2005.07.013. [DOI] [PubMed] [Google Scholar]
- 7.Guan S, Ge D, Liu TQ, Ma XH, Cui ZF. Toxicol In Vitro. 2009;23:201–208. doi: 10.1016/j.tiv.2008.11.008. [DOI] [PubMed] [Google Scholar]
- 8.Vari R, D'Archivio M, Filesi C, Carotenuto S, Scazzocchio B, Santangelo C, Giovannini C, Masella R. J Nutr Biochem. 2011;22:409–417. doi: 10.1016/j.jnutbio.2010.03.008. [DOI] [PubMed] [Google Scholar]
- 9.Vitaglione P, Donnarumma G, Napolitano A, Galvano F, Gallo A, Scalfi L, Fogliano V. J Nutr. 2007;137:2043–2048. doi: 10.1093/jn/137.9.2043. [DOI] [PubMed] [Google Scholar]
- 10.Lin HH, Chen JH, Chou FP, Wang CJ. Br J Pharmacol. 2011;162:237–254. doi: 10.1111/j.1476-5381.2010.01022.x. [DOI] [PMC free article] [PubMed] [Google Scholar]
- 11.Liu YM, Jiang B, Bao YM, An LJ. Toxicol In Vitro. 2008;22:430–437. doi: 10.1016/j.tiv.2007.10.012. [DOI] [PubMed] [Google Scholar]
- 12.Tseng TH, Kao TW, Chu CY, Chou FP, Lin WL, Wang CJ. Biochem Pharmacol. 2000;60:307–315. doi: 10.1016/s0006-2952(00)00322-1. [DOI] [PubMed] [Google Scholar]
- 13.Hatzipanayioti D, Petropouleas P. Spectrochim Acta A Mol Biomol Spectrosc. 2010;75:997–1007. doi: 10.1016/j.saa.2009.12.025. [DOI] [PubMed] [Google Scholar]
- 14.Nakamura Y, Torikai K, Ohigashi H. J Agric Food Chem. 2001;49:5674–5678. doi: 10.1021/jf0106594. [DOI] [PubMed] [Google Scholar]
- 15.Ma HL, Qin MJ, Qi LW, Wu G, Shu P. Biomed Chromatogr. 2007;21:931–939. doi: 10.1002/bmc.836. [DOI] [PubMed] [Google Scholar]
- 16.Cao YG, Zhang L, Ma C, Chang BB, Chen YC, Tang YQ, Liu XD, Liu XQ. Biochem Pharmacol. 2009;77:1096–1104. doi: 10.1016/j.bcp.2008.11.029. [DOI] [PubMed] [Google Scholar]
- 17.Li Q, Jia Y, Xu L, Wang X, Shen Z, Liu Y, Bi K. Biol Pharm Bull. 2006;29:532–534. doi: 10.1248/bpb.29.532. [DOI] [PubMed] [Google Scholar]
- 18.Bolarinwa A, Linseisen J. J Chromatogr B Analyt Technol Biomed Life Sci. 2005;823:143–151. doi: 10.1016/j.jchromb.2005.06.024. [DOI] [PubMed] [Google Scholar]
- 19.Guo X, Chen X, Li L, Shen Z, Wang X, Zheng P, Duan F, Ma Y, Bi K. J Chromatogr B Analyt Technol Biomed Life Sci. 2008;873:51–58. doi: 10.1016/j.jchromb.2008.07.039. [DOI] [PubMed] [Google Scholar]
- 20.Wu X, Pittman HE, III, Hager T, Hager A, Howard L, Prior RL. Mol Nutr Food Res. 2009;53(1):S76–84. doi: 10.1002/mnfr.200800231. [DOI] [PubMed] [Google Scholar]
- 21.http://www.fda.gov/downloads/Drugs/GuidanceComplianceRegulatoryInformation/Guidances/ucm070107.pdf(2012)
- 22.Wang D, Wei X, Yan X, Jin T, Ling W. J Agric Food Chem. 2010;58:12722–12728. doi: 10.1021/jf103427j. [DOI] [PubMed] [Google Scholar]