

Abstract
Profiling miRNA expression in cells that directly contribute to human disease pathogenesis is likely to aid the discovery of novel drug targets and biomarkers. However, tissue heterogeneity and the limited amount of human diseased tissue available for research purposes present fundamental difficulties that often constrain the scope and potential of such studies. We established a flow cytometry-based method for isolating pure populations of pathogenic T cells from bronchial biopsy samples of asthma patients, and optimized a high-throughput nano-scale qRT-PCR method capable of accurately measuring 96 miRNAs in as little as 100 cells. Comparison of circulating and airway T cells from healthy and asthmatic subjects revealed asthma-associated and tissue-specific miRNA expression patterns. These results establish the feasibility and utility of investigating miRNA expression in small populations of cells involved in asthma pathogenesis, and set a precedent for application of our nano-scale approach in other human diseases. The microarray data from this study (Figure 7) has been submitted to the NCBI Gene Expression Omnibus (GEO; http://ncbi.nlm.nih.gov/geo) under accession no. GSE31030.
Keywords: microRNA (miRNA), asthma, helper T cell, microfluidic, qPCR arrays
Introduction
MicroRNAs (miRNAs) have emerged as highly promising diagnostic and prognostic biomarkers of disease, and disease-associated miRNAs may also be attractive targets for therapy [1-5]. miRNA expression profiling in healthy and diseased tissue is an important first step for investigating the role of miRNAs in human diseases. However, these studies are often constrained by the limited quantity of tissue that can be obtained from diseased subjects for research purposes. In addition, the heterogeneous cellular composition of tissue samples can confound analyses by increasing the biological noise and masking subtle but biologically important changes in miRNA expression. In some studies, rare cell populations derived from human tissue samples have been expanded ex vivo to yield larger quantities of more homogenous cell populations [6,7]. However, the information derived from these cells may not reflect the disease-specific changes that occur in vivo because of changes in cell biology that likely occur during in vitro culture. The use of blood samples as surrogates for diseased tissue may have utility for diseases caused by immune cells that recirculate through the bloodstream, yet even in this case isolating particular cell subsets may be necessary, and this approach may still fail to capture disease-specific changes that occur only in affected tissues.
In this report, we present an integrated approach for miRNA expression profiling in clinical samples that overcomes the problems arising from tissue paucity and heterogeneity. We demonstrate the utility of this approach in an investigation of the role of miRNAs in human asthma, a common allergic airway disease that affects over 300 million people worldwide. miRNA expression profiling in pure populations of pathogenic T cells, isolated from well phenotyped patients with mild or moderately severe allergic asthma and healthy control volunteers, revealed miRNAs that were differentially expressed in T cells of asthma patients, including some miRNAs that exhibited airway tissue-specific changes in asthma. We further show that this technique has great potential for biomarker discovery by profiling miRNAs in biological fluids relevant to lung diseases, including sputum and bronchoalveolar lavage (BAL) supernatants. The nano-scale approach reported here will be useful to investigate the role of miRNAs in various other human diseases and in other experimental settings where it is desirable to profile expression in low abundance cell populations.
Materials and methods
Study subjects
The Ethics Committees of the Southampton University Hospitals Trust approved the study, and written informed consent was obtained from all subjects. Twelve subjects with asthma (6 with mild asthma never treated with corticosteroids and 6 subjects with moderate asthma treated with inhaled corticosteroids) [8], meeting established diagnostic criteria [9], and 10 healthy subjects were studied.
Sample acquisition, processing and cell sorting
Bronchial biopsy and BAL samples were acquired from 3 healthy and 12 asthmatic subjects (6 mild and 6 moderate) as described previously [10]. Biopsy samples were immediately dispersed by treating with collagenase I (Sigma, Poole, UK), reconstituted in RPMI 1640 at 1 mg per milliliter, for a 1-hour period at 37°C. Nonspecific binding of antibodies to Fc receptors was blocked by pre-treating cells with 2 mg per milliliter of polyclonal human IgG (Sigma). Cells were then stained with fluorescently conjugated antibodies (Lin1 cocktail (includes CD3, CD14, CD16, CD19, CD20, and CD56) FITC-conjugated, anti-EpCAM PerCP-Cy5.5-conjugated, anti-CD8 APC-conjugated, anti-CD3 PE-Cy7-conjugated, anti-HLA-DR APC-Cy7-conjugated, all from BD Biosciences, oxford, UK) and propidium iodide prior to analysis and sorting on the FACSAriaTM (BD Biosciences, oxford, UK). T cells were identified following a serial gating strategy as previously described by us [10]. BAL cells were separated from the fluid phase and cells sorted as described for the biopsy samples.
For isolating T cell subtypes from blood samples, PBMCs were first separated into a CD4+ memory cells fraction and non-CD4+ memory cell fraction by use of the memory CD4+ T cell isolation kit (Miltenyi Biotec, Surrey, UK). The CD4+ memory cells were then stained with fluorescently conjugated antibodies (anti-CD45RA FITC-conjugated, anti-CD4 APC-Cy7-conjugated, anti-CCR4 PE-conjugated, and anti-CD25 APC-conjugated) and sorted on the FACSAriaTM to obtain two cell populations: CD4+CD45RA- CCR4- and CD4+CD45RA-CCR4+CD25-. Naïve T cells were sorted from the non-CD4+memory cells following staining with anti-CD45RA FITC-conjugated, anti-CD4 PerCP-Cy5.5-conjugated, anti-CD62L APC-Cy7-conjugated antibodies and anti-CD45RO PE-conjugated.
Microarray
Fifty nanograms of total RNA was labeled and then hybridized onto custom-designed human miRNA arrays (Agilent, Palo Alto, US) following the manufacturer’s instructions.
Nano-scale PCR
FACS sorted cells were stored in Trizol LS (Invitrogen, Cambridge, UK). Total RNA was extracted using the miRNeasy kit (Qiagen, Valencia, US) as per the manufacturer’s instruction. The optional DNAse treatment was included in our procedure. The amount of RNA in each clinical sample was quantified by using a highly sensitive real-time PCR-based assay that is based on detecting mRNA levels of a housekeeping gene (beta-2-microglobulin (B2M): Fwd-5’-ctgccgtgtgaacca-tgtgacttt-3’; Rev-5’-tgcggcatcttcaaacctccatga-3’; Taqman probe-5’-/56-FAM/agtgggatcgaga-catgtaagcagca/-3IABLK_FQ/-3’). A standard curve, which was generated using serial dilutions of known quantities of RNA, showed that the assay could linearly detect RNA concentrations ranging from 5ng to 1pg.
We adapted a previously described multiplex qRT-PCR [11]. Revere transcription (RT) was performed in multiplex using 96 stem-loop primers at a final concentration of 1nM. Briefly, in a 4μl reaction volume, 1ng RNA was incubated with primers and RNAse inhibitor (0.325U/μl) (Applied Biosystems Inc (ABI), Carlsbad, US) for 5 minutes at 65°C and then cooled down in ice for at least 2 minutes before adding 3μl of freshly prepared RT mix [8.75mM dNTPs, 25U multiscribe RTase, RTase 10X buffer, 0.43U/μl RNAse inhibitor, all from ABI]. RT reaction was carried out in 7μl volume in the following sequence: 16°C for 30 minutes, 42°C for 30 minutes, 80°C for 5 minutes and, finally, 4°C prior to the next step. cDNA from the RT step was pre-amplified in a multiplex PCR reaction by adding 18μl of a pre-amp mix [96-plex forward primers 50nM, universal reverse primer 5mM, dNTPs 4mM, MgCl2 2mM, 2X Taqman Universal PCR master mix without AmpErase UNG, and 6.25U of AmpliTaq Gold DNA Polymerase II (ABI)]. The PCR pre-amplification reaction was carried out in a 25μl volume in the following sequence: 95°C for 10 minutes, 55°C for 1 minute, 12 to 24 cycles of (95°C for 1 second + 65°C for 1 minute) and, finally, 4°C prior to the next step. Excessive amounts of residual primers from the pre-amplification step were removed by treating the samples with 10ul of ExoSAP-ITTM (USB, Cleveland, US) for 15 minutes at 37°C, then at 85°C for a further 15 minutes and, finally, cool down to 4°C. Subsequently, the samples were run though a size-exclusion gel filtration column (Illustra Microspin G-50 column, GE Healthcare Biosciences, US). Two out of 40μl of cleaned-up pre-amplified samples was used for the nanoliter qPCR reactions performed on the Biomark high-throughput qPCR platform (Fluidigm, South San Francisco, USA). qPCR was carried out as per the manufacturer’s instruction except that the annealing temperature during the PCR reaction was set at 55°C instead of 65°C. The data was analyzed using Biomark system software that incorporates an automatic noiseband threshold setting for each qPCR assay, and qPCR curve quality scoring and flagging to eliminate false positive signals. We use no RNA and no RT samples to establish the background signal for each miRNA assay, and eliminate all higher Ct values by redefining them as background + 0.1. The list of miRNAs that can be detected by each 96-plex mix (1 to 4) are available online: ansel.ucsf.edu/AJCEI2012.
Size-fractionation of RNA for parallel profiling of miRNA and mR5NA
Cell lysate stored in Trizol was mixed with chloroform (1 in 6 dilution), centrifuged for 20 minutes at 8000g and the aqueous phase containing the RNA was collected. Using a low concentration of ethanol (35% v/v) the large RNAs (>150nt) were first precipitated and captured in a collection column (RNeasy, Qiagen), whereas the small RNAs (<150nt) fraction, which do not precipitate in the low ethanol concentrations, are effectively separated and present in the flow through. The small RNAs can then be precipitated from the flow-through using a higher concentration of ethanol (75% v/v) and collected on a fresh column (MinElute, Quiagen). Samples that were stored in chaotropic buffer (RLT) were run through a Qiashredder column (Qiagen) and the eluate collected before the differential ethanol precipitation steps. RNA fractions were treated with DNase as per manufacturer’s instructions (Qiagen).
Primer sequences
List of primers used for qPCR analysis: Eri-1 mRNA: Fwd-5’-cggctcagcagactcaaaca-3’; Rev-5’-ggccgtccatcataatccat-3’; Ctla-4 mRNA: Fwd-5’-actc-atgtacccaccgccata-3’; Rev-5’-ggg-catggttctggatcaat-3’; IL4 mRNA: Fwd-5’-agatcatcggcatt-tttgaacg-3’; Rev-5’-tttggcacatccatctccg-3’; 28S rRNA: Fwd-5’-ctcgtctgatctcggaagctaa-3’; Rev-5’-actgagggaatcctggttagtttct-3’, 5S rRNA: Fwd-5’-ctcgtctgatctcggaagctaa-3’; Rev-5’-gtctcccatc-caagtactaaccag-3’; 5.8S rRNA: Fwd-5’-atcgtaggcaccgctacgcctgtctg-3’; Sno202 RNA: Fwd-5’-cgtctactgacttgatgaaagtactt-3’; miRNA-146a: Fwd-5’-tgagaactgaattccatgggtt-3’; miRNA-15a: Fwd-5’-tagcagcacataatggtttgtg-3’; miRNA-21: Fwd-5’-tagcttatcagactgatgttg-3’; Rev-Universal primer (NCodeTM qRT-PCR Kit, Invitrogen).
Statistical analysis
qPCR data was normalized using the standard delta-Ct (ΔCt) method by calculating the difference between the Ct value of the miRNA and the mean Ct value of the housekeeping miRNAs, miR-103 and miR-191, in that sample. Quantile normalization and ΔCt methods yielded very similar results (data not shown). Housekeeping miRNAs were repeated in each separate 96-plex mix. A two-way ANOVA linear model was fit to the normalized ΔCt values for all miRNA to calculate t-statistic and the “nominal p-value” for each miRNA for the comparisons of interest. A 3x3 model using both disease group and sample source as factors was made using the airway T cell data, and a 3x3 model using disease group and cell type was made for the blood T cells. All procedures were carried out using functions in the R package limma in Bioconductor [12].
Results
Isolation of pure populations of T cells from small bronchial biopsy specimens
Allergic airway inflammation and airway hyperreactivity, the hallmarks of asthma, are orchestrated by Th2 cytokine-producing T cells (Th2 cells) that infiltrate the lung [13]. Based on the reasoning that the cells that drive asthma pathogenesis are most likely to bear functionally relevant disease-associated perturbations in miRNA expression, we analyzed ex vivo the T cells that infiltrate the diseased tissue, as well as circulating T cells capable of making Th2 cytokines.
To enable this analysis, we first established procedures to isolate pure populations of T cells from the airways and peripheral blood of patients with asthma. Using fiber-optic bronchoscopy, we obtained up to 8 small (2-3 mm) bronchial biopsies from patients with mild asthma (treated with bronchodilators alone, n=6), moderate asthma (treated with bronchodilators and inhaled corticosteroids, n=6), and healthy control subjects (n=3). The biopsy samples were enzymatically dispersed into single cell suspensions, labelled with fluorescently conjugated antibodies, and FACS sorted to obtain pure populations of T cells (Figure 1A) [14]. Using this approach, we isolated pure (>95%) populations of airway tissue-infiltrating T cells (mean±s.d.) (24200 ± 6300 cells) (Figure 1B). We also isolated airway-lumenal T cells from bronchoalveolar lavage (BAL) fluid (mean±s.d.) (85200 ± 35900 cells), recognizing the possibility of functional differences between these two lung compartments (Figure 1B).
Figure 1.
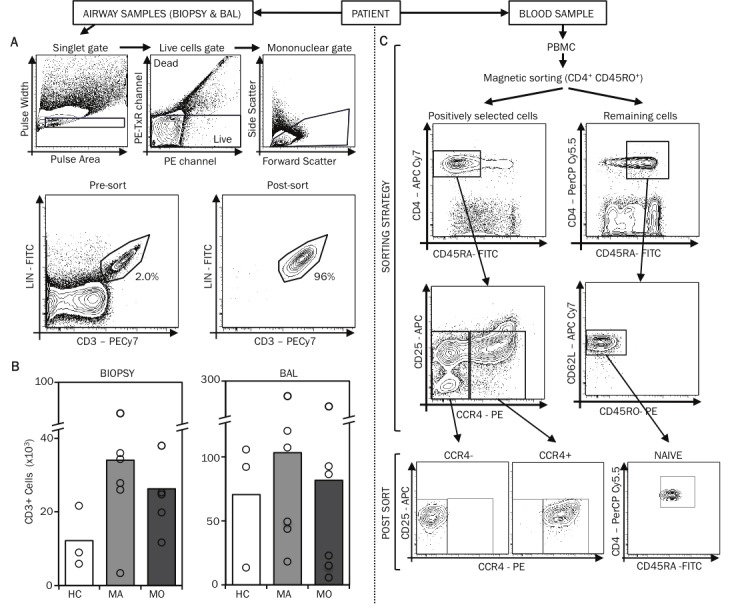
Isolation of T cells from bronchial biopsy specimens. A. Human bronchial biopsy specimens were enzymatically dispersed and cells stained with fluorescently conjugated antibodies (Lin1 cocktail (includes CD3, CD14, CD16, CD19, CD20, and CD56) FITC-conjugated, anti-EpCAM PerCP-Cy5.5-conjugated, anti-CD8 APC-conjugated, anti-CD3 PE-Cy7-conjugated, anti-HLA-DR APC-Cy7-conjugated) and propidium iodide for analysis on the FACSAriaTM. FACS plots illustrate the gating strategy used to identify T cells in these bronchial biopsy specimens. Utilizing this gating strategy, T cells populations were sorted by FACS. The FACS plots of the post-sort samples are also displayed. B. The mean and range of the numbers of T cells obtained from bronchial biopsy specimens and BAL of healthy controls (HC), mild (MA) and moderate (MO) asthmatic patients are displayed. C. From 100ml of blood, using the memory CD4+ T cell isolation kit, PBMC-CD4+ memory cell were first selected and were subsequently stained with fluorescently conjugated antibodies (anti-CD3 PE-Cy7-conjugated, anti-CD45RA FITC-conjugated, anti-CD4 APC-Cy7-conjugated, anti-CCR4 PE-conjugated, and anti-CD25 APC-conjugated) and sorted on the FACSAriaTM to obtain two cell populations: CD4+CD45RA-CCR4- and CD4+CD45RA-CCR4+CD25-. Naïve T cells were sorted from the non-CD4+ memory cells following staining with anti-CD3 PE-Cy7-conjugated, anti-CD45RA FITC-conjugated, anti-CD4 PerCP-Cy-5.5-conjugated, anti-CD62L APC-Cy7-conjugated and anti-CD45RO PE-conjugated antibodies. The FACS plots illustrating the gating strategy and the post-sort cell populations are displayed.
We recently showed that human Th2 cells reside in the CCR4+ memory CD4+ T cell fraction of blood T cells and that the proportion of CCR4+ cells in the blood increases with asthma severity [15]. To avoid mistaking differences in the relative abundance of Th2 cells for disease-specific changes in miRNA expression, and to capture changes that occur in a cell type-specific manner, we analyzed three purified populations of blood T cells (mean±s.d.): Th2-enriched CD4+CCR4+ memory T cells (3.7±0.5×10⁶); Th2-depleted CD4+CCR4- memory T cells (1.9±0.4×10⁶); and uncommitted naïve CD4+ T cells (1.5±0.3×10⁶) (Figure 1C). The entire procedure for isolating airway and circulating T cell subtypes from each study subject was completed in less than 6 hours.
Validation of a high-throughput quantitative PCR method for miRNA detection
The small numbers of T cells obtained from bronchial biopsies provided insufficient material for miRNA profiling with microarrays or deep sequencing. Therefore, we optimized and validated an economical high-throughput quantitative RT-PCR method to permit measurement of miRNA abundance in a large number of small quantity clinical samples on the Fluidigm Biomark platform. Biomark dynamic arrays employ integrated fluid circuits for automated mixing of 96 template samples with 96 qPCR assays in preformed 7 nanoliter reaction chambers [16]. This method provided a high degree of reproducibility in replicate measurements, significant sample and reagent sparing, and the ability to perform 9216 simultaneous miRNA measurements.
For assay design, we adopted the previously described and broadly applied method of miRNA-specific reverse transcription with stem-loop primers, followed by quantitative PCR (qPCR) with a universal reverse primer and miRNA-specific forward primers and dual-labeled probes [17]. The short length of miRNAs (~22 nt) restricts assay design, resulting in a broad range of probe melting temperatures (42-60 °C). Temperature gradient qPCR on a conventional real-time thermocycler showed that assays with the lowest probe melting temperatures performed poorly at higher annealing temperatures, but all assays yielded optimal signals at 55°C (Figure 2A). We observed a mean PCR efficiency of 101 ± 2% for a larger panel of custom assays on the Biomark platform, with linear performance across as much as a 32,000-fold range of starting RNA concentrations (Figure 2B; data not shown). Importantly, we did not observe a correlation between PCR efficiency and probe melting temperature (Figure 2C).
Figure 2.
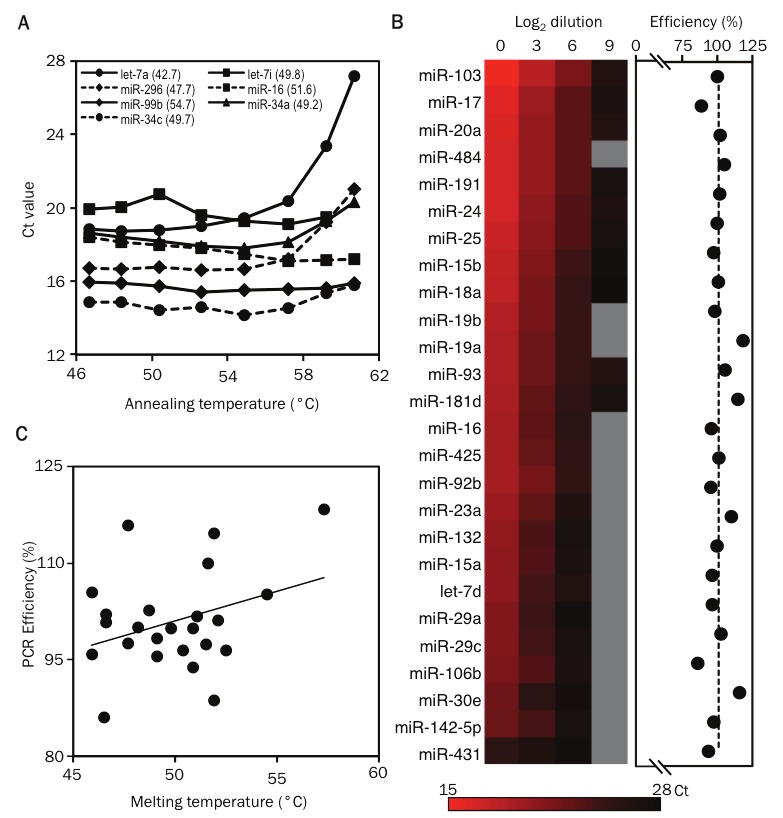
Validation of primer and probe sets for detecting human miRNAs. Validation of primer and probe sets for detecting human miRNAs. A. Gradient quantitative PCR showing the relationship between annealing temperature and threshold cycle of detection (Ct) for Let-7a, miR-292, miR-99b, miR-34c, Let-7i, miR-16 and miR-34. The melting temperatures of the Taqman probes used for detecting these miRNAs are shown in parenthesis. B. The heat map displays the Ct values for miRNAs measured in samples containing serial 8-fold dilutions of starting RNA material using the nanoscale PCR platform (mix 1). miRNAs that were not detected are shown in grey. The PCR efficiency for each miRNA is displayed as dots in the next graph. C. The graph displays the correlation between the PCR efficiency and the melting temperature of the Taqman probes used for detecting miRNAs.
Pre-amplification is an essential step for profiling miRNAs in limiting RNA samples
To minimize sample requirements, miRNAs in each sample were first reverse transcribed (RT) in multiplex using 96 miRNA-specific stem loop primers that correspond with the qPCR assays to be performed. PCR pre-amplification with corresponding forward primers is necessary to ensure adequate starting template concentration in nanoliter qPCR reactions, and this is especially true for limiting RNA samples [11]. Pre-amplification conditions and the number of amplification cycles must be optimized to obtain sufficient material for qPCR while avoiding PCR saturation or selective amplification of one or a few templates (“jackpotting”). To address these issues, we compared miRNA measurements for cDNA from 1 ng (~1000 cell equivalent) of RNA after 12, 14, 16, and 18 cycles of 96-plex pre-amplification. Linear pre-amplification was observed between 12 and 18 cycles at a PCR efficiency of 73 ± 2% for 37 miRNAs that yielded a product in at least three amplified samples (Figure 3A, 4). Measurements for amplified samples correlated closely with measurements for unamplified cDNA from 100 ng (~100,000 cell equivalent) of the same RNA, indicating uniform miRNA pre-amplification (Figure 3A). Six poorly amplified outliers in early analyses were mostly eliminated by separating miRNAs with close sequence homology into separate groups to avoid primer competition. The one remaining outlier (miR-16) was still detected in a highly linear manner across pre-amplified samples with starting RNA quantities ranging from 8 ng down to 2 pg (~2 cell equivalent; Figure 4B). Therefore, we expect quantitative comparisons of miRNA expression between study subjects and cell types to be robust for all miRNAs, though quantitative comparison with other miRNAs within a sample may be skewed for a few poorly pre-amplified miRNAs.
Figure 3.
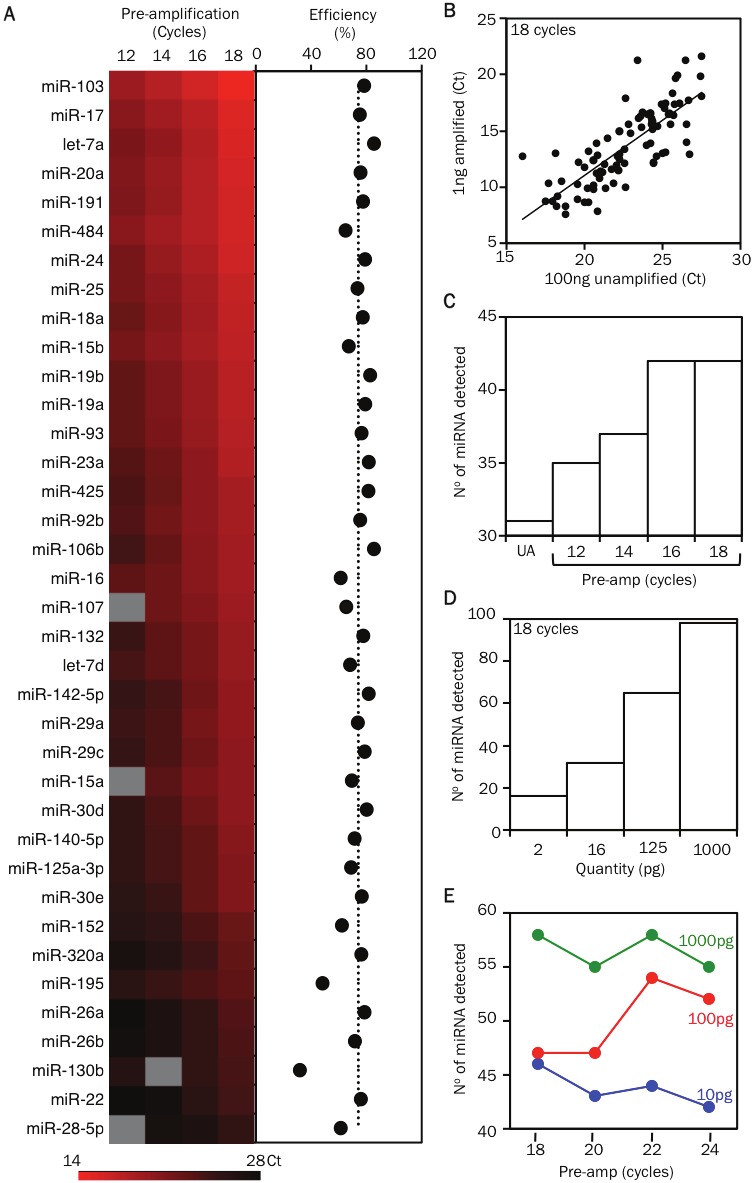
Optimizing the pre-amplification step for detecting miRNAs in samples with small cell numbers. A. Heat map displays the threshold cycle of detection (Ct) values of miRNAs detected in samples containing 1 ng of RNA that were pre-amplified by a 12, 14, 16 or 18 cycle 96-plex PCR reaction (mix 1). The PCR efficiency during the pre-amplification step for each miRNA is displayed as dots in the next graph. B. Comparison of the miRNA profile of unamplified cDNA (UA) from 100 ng (~100,000 cell equivalent) of RNA with cDNA from 1 ng (~1000 cell equivalent) of RNA after 18 cycles of 96-plex pre-amplification (mix 2-3). C. Bar graph displays the number of miRNAs detected in relation to the extent of pre-amplification (12, 14, 16 or 18 cycles) of cDNA from a 1 ng RNA sample (mix 1). D. Bar graph displays the number of miRNAs detected in relation to the starting amount of RNA (serial 8-fold dilutions of a 1 ng RNA sample) that was used for the 18 cycle pre-amplification step (mix 2-3). E. Displays the number of miRNAs detected in relation to the extent of pre-amplification (18, 20, 22 or 24 cycles) of cDNA from a 1 ng RNA sample (green line). Comparative data from 100 and 10 pg of starting RNA material are displayed in the red and blue lines, respectively (mix 4). The list of miRNAs that can be detected by each 96-plex mix (1 to 4) are available online: ansel.ucsf.edu/AJCEI2012.
Figure 4.
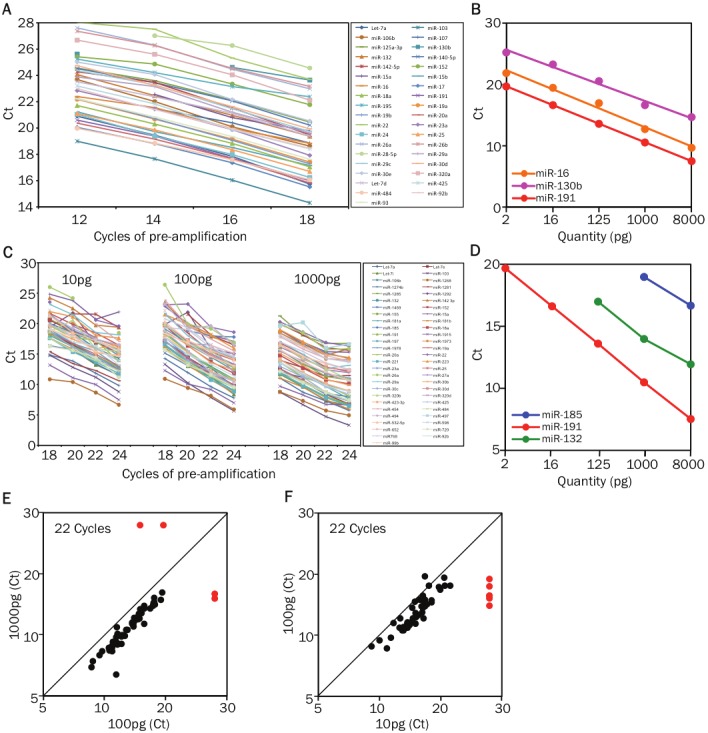
Optimizing the pre-amplification step for detecting miRNAs in samples with small cell numbers. A. Comparisonof Ct values of multiple miRNAs in cDNA samples from 1 ng RNA after 12, 14, 16, and 18 cycles of 96-plexPCR pre-amplification (mix 1). B. The graph displays the threshold cycle of detection (Ct) values for miR-16, miR-130b and miR-191 in samples with starting RNA quantities ranging from 8 nanograms down to 2 picograms (pg) (mix 2). RNA from all samples were first reverse transcribed (RT) in multiplex using 96 miRNA-specific stem loopprimers and the cDNA was pre-amplified by an 18 cycle 96-plex PCR reaction. C. Comparison of Ct values of multiplemiRNAs in cDNA samples from 10 pg, 100pg, and 1000pg of RNA after 18, 20, 22, and 24 cycles of 96-plex PCRpre-amplification (mix4). D. The graph displays the Ct values for miR-191 (highly expressed), miR-132 (medium expressionlevels) and miR-185 (low abundance) in samples with starting RNA quantities ranging from 8 nanogramsdown to 2 picograms (pg) (mix 3). E. Comparison of the miRNA profile of cDNA from 10 pg (~10 cell equivalent) and100 pg (~100 cell equivalent) of RNA after 22 cycles of 96-plex pre-amplification (mix 4). Threshold cycle of detection(Ct) values for miRNAs from the 10 pg and 100 pg samples are plotted on the x-axis and y-axis, respectively.The red dots indicate the miRNAs that were not detected in the 10 pg sample. F. Comparison of the miRNA profileof cDNA from 100 pg (~100 cell equivalent) and 1000 pg (~1000 cell equivalent) of RNA after 22 cycles of 96-plexpre-amplification (mix 4). Threshold cycle of detection (Ct) values for miRNAs from the 100 pg and 1000 pg samplesare plotted on the y-axis and x-axis, respectively. The red dots indicate the miRNAs that were not detected in one orthe other sample.
We next determined the extent of pre-amplification that was required to reliably detect miRNAs present in limiting RNA samples. Eighteen cycles of pre-amplification gave the maximum yield of detectable miRNAs in 1 ng RNA samples (Figure 3C), and pre-amplification remained unsaturated up to 22 cycles (Figure 4C). However, starting with smaller amounts of the same RNA progressively reduced the number of detectable miRNAs (Figure 3D, 4D). Increasing the extent of pre-amplification from 18 to 22 cycles for 100 pg RNA samples succeeded in recovering low abundance miRNAs without skewing the results (Figure 3E, 4E). miRNA measurements remained accurate even in 10 pg RNA samples (Figure 4F), though 24 cycles of pre-amplification were still insufficient to allow reliable detection of the least abundant miRNAs in these samples (Figure 3E).
To further maximize the amount of biological information that can be obtained from limited quantities of human samples, we used RNA isolation strategies that fractionate large (>150nt) and small (<150nt) RNA into separate pools for mRNA and miRNA profiling, respectively (Figure 5A, 5B). Clinical samples stored in either phenol-based (i.e. Trizol) or chaotropic (i.e. RLT, QIAGEN) lysis solutions are compatible with this strategy, and RNA fractionation did not skew or reduce the sensitivity of miRNA measurements (Figure 5C, 5D).
Figure 5.
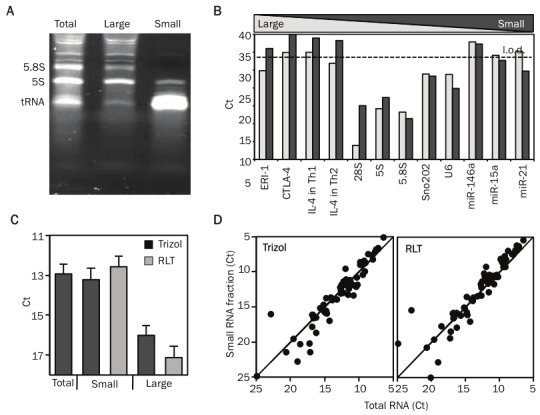
Size-fractionation of RNA enables parallel profiling of miRNA and mRNA. A. A 8% PAGE (polyacrylamide gel electrophoresis) gel illustrating the size profile of total RNA, large RNA fraction (Large) and small RNA fraction (Small). The major bands on the gel correspond to the 5.8S (158nt) and 5S (121nt) rRNA and to tRNAs. B. Bar graph illustrates the comparison of the different RNA populations present in large and small RNA fractions. It displays the threshold cycle of detection (Ct) values, for messenger RNAs (Eri-1, CTLA-4, IL-4), ribosomal RNAs (28S, 5.8S, 5S), small nuclear RNAs (Sno202, U6) and miRNAs (miR-146, miR-15b, miR-21) from large and small RNA fractions derived from mouse Th1 and Th2 cells. C. Displays the mean (+SEM) Ct values for all the miRNAs detected from total RNA, small RNA fraction prepared from samples stored in Trizol or RLT and large RNA fraction prepared from samples stored in Trizol or RLT. D. Comparison of the miRNA profile of a total RNA preparation with small RNA fraction prepared from cellular samples stored in RLT or Trizol. Threshold cycle of detection (Ct) values for miRNAs from the total RNA and small RNA fractionated samples are plotted on the x-axis and y-axis, respectively.
Optimized clean-up of pre-amplified templates improves qPCR sensitivity and specificity
For the higher PCR efficiency required for real-time detection in a Taqman assay, we and others [11] have observed the need to reduce the annealing temperature during the PCR reaction to 55 °C from the 65 °C used in the pre-amplification step. The lower annealing temperature can result in non-specific product formation, especially when using the pre-amplified samples that have >100 residual unused primers from the 96-plex PCR reaction. Non-specific product formation can reduce the sensitivity and specificity of the assay. To overcome this problem, removing primer and dNTP contaminants has recently been shown to improve the specificity of the assay [18]. To optimize yield and reproducibility while minimizing sample cross-contamination, we developed a high-throughput method for cleaning up pre-amplified samples. We used ExoSAPTM reagent that utilizes two hydrolytic enzymes, Exonuclease I and Shrimp Alkaline Phosphatase to remove unwanted dNTPs and primers from the pre-amplified PCR template (Figure 6A). Exonuclease I degrades excess single-stranded primers and any extraneous single-stranded DNA produced in the PCR reaction. Shrimp Alkaline Phosphatase dephosphorylates remaining dNTPs from the PCR mixture. Free nucleotide monophosphates that result from ExoSAP treatment were then removed with gel filtration spin columns (G50) in single or 96-well plate form.
Figure 6.
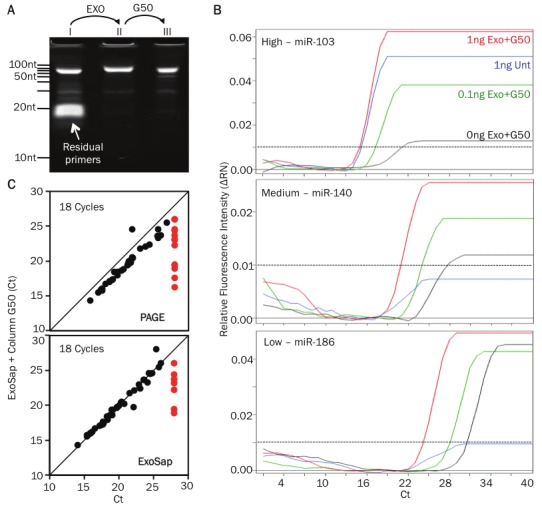
Clean-up of pre-amplified samples improves qPCR sensitivity. A. 11% PAGE (polyacrylamide gel electrophoresis) gel showing the PCR product (≈80bp) and residual primers in untreated sample (lane I) (≈20bp). Excess primers are eliminated following ExoSAP treatment (lane II) and gel filtration using G50 column (lane III). B. qPCR curves of 3 different miRNAs (miR103, -140, -186, which have high. medium and low expression levels in Th2 cells, respectively) before (blue line) and following purification with ExoSAP and G50 column (red line) of a 1ng pre-amplified RNA sample. Purified 0.1ng (green line) and 0ng (black line) RNA samples are shown (the black doted line indicate the threshold of detection). C. Comparison of the miRNA profile of the ExoSAP + G50 column purified sample versus PAGE (upper plot) or ExoSAP only purified sample. Threshold cycle of detection (Ct) values for miRNAs the different methods compared are plotted. The red open dots indicate the miRNAs that were not detected by PAGE or ExoSAP only methods.
To compare the effectiveness of the various clean up steps, we divided a single pre-amplified product into 4 parts and subjected each part to a specific clean-up method: polyacrylamide gel electrophoresis (PAGE) purification, ExoSAP treatment only, ExoSAP treatment followed by column purification, and no clean-up. We then used nano-scale qPCR to profile 94 miRNAs concurrently for all 4 samples. Clean-up by exonuclease treatment followed by column purification improved the signal (Ct values) of the miRNAs detected when compared to the no clean-up sample (Figure 6B). This clean-up procedure yielded results that are highly comparable with PAGE purification, a low throughput gold standard (Figure 6C, top panel). The addition of a column purification step had a modest but definite improvement in the sensitivity of the assay (Figure 6C, bottom panel). We conclude that cleaning-up pre-amplified samples critically improves the sensitivity and specificity of qPCR profiling. We routinely perform this optimized and efficient enzymatic and column purification method for all clinical samples.
Nano-scale qPCR is comparable to microarray-based profiling
We next analyzed the concordance in results obtained by nano-scale qPCR and miRNA microarrays. Fifty-one out of the 92 miRNAs assayed in 1 ng of RNA from in vitro derived human T helper type 2 (Th2) cells [19] were detected by nano-scale qPCR. Of these, 45 were detected by microarray analysis of 50 ng of the same RNA sample (Figure 7), including the 32 miRNAs with the strongest signal intensities on the nano-scale qPCR platform (Figure 7). As previously described, qPCR delivered globally higher signal intensities above background than microarrays, which suffer from considerable data compression as well as signal variability due to differences in hybridization to short miRNA probes [20]. The 6 miRNAs detected only by nano-scale qPCR had microarray signals very close to background (Figure 7). We confirmed a low level of expression in Th2 cells for four of these miRNAs by single-plex qRT-PCR on a conventional thermocycler, though miR-375 and miR-101a remained at or below the limit of detection (data not shown). We also found supporting evidence for the expression of all six of these miRNAs in published sequencing data for human T cells [21].
Figure 7.
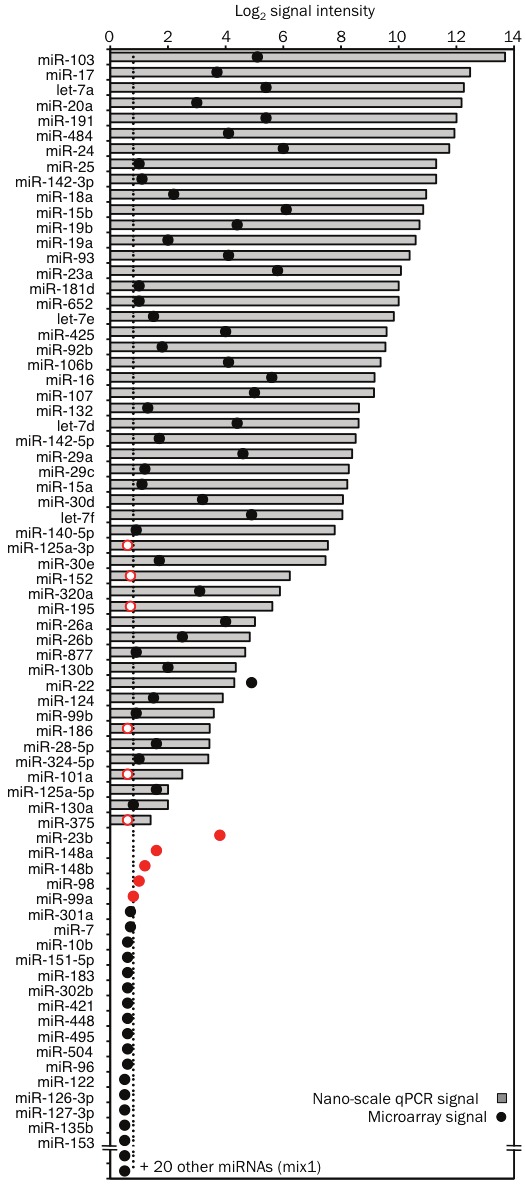
High concordance between nano-scale qPCR and microarray profiling data. RNA extracted from human Th2 cells was used for parallel profiling by both nano-scale PCR and microarray method. Fifty nanograms (ng) of RNA was used for the microarray method and cDNA from 1 ng (~1000 cell equivalent) of RNA, pre-amplified by 18 cycle PCR reaction, was used for miRNA detection by the nano-scale qPCR method (mix 1). The graph displays the intensity of the detection signals obtained by nano-scale qPCR and microarray method for 72 out of the 92 miRNAs that were assayed by qPCR. PCR signal intensity (grey bars) was calculated by subtracting the threshold cycle of detection (Ct) value for each miRNA from Ct of 28 (typical background signal on the Fluidigm Biomark). Array signal intensity (black dots) was calculated as the difference between the log2 intensity and the background signal measured for control probes. The miRNAs that were false positives in the microarray method are displayed as closed red dots. The miRNAs that were detected by nano-scale qPCR but not by microarray (false negatives) are displayed as open red dots.
Nano-scale qPCR failed to detect miR-23b, miR-148a, miR-148b, miR-99a and miR-98, even though these miRNAs gave weak positive signals on the microarray and in single-plex qPCR on a conventional thermocycler (Figure 7). Nano-scale qPCR detected high levels of miRNAs with close sequence homology (miR-23a, miR-152, miR-99b and let-7 family) in the same samples, suggesting inhibitory primer or template competition among closely related miRNA assays. It has been shown that stem-loop qPCR can distinguish closely related miRNAs [11]. These results strongly suggest the qPCR data were accurate, whereas false positives arose in microarray analyses due to cross-hybridization of related miRNAs.
miRNA profile of T lymphocyte subtypes in blood from asthma patients
To demonstrate the utility of our nano-scale approach in identifying disease-associated miRNA signatures, we first profiled miRNA expression in circulating CD4+ T cells subtypes from patients with mild or moderate asthma and healthy control subjects (overall strategy outlined in Figure 8). In view of their central role in asthma pathogenesis, we compared enriched Th2 cells (CCR4+) with the remaining non-Th2 cells (CCR4-) and circulating naïve helper T cells (CD45RA+). We restricted our qPCR assays to the 188 miRNAs detected in human CD4+ T cells based on published sequencing data and microarray profiling (data not shown) [21]. We separated primers for closely related miRNAs into two 96-plex pools for the multiplex RT and pre-amplification reactions (mix 2 and 3; data not shown). This approach allowed us to profile 190 miRNAs in each individual subject with just 2 nanograms (~2000 cell equivalent) of RNA. Since Ct values for miR-103 and miR-191 varied little among the many RNA samples, we expressed miRNA abundance as the difference (ΔCt) between the Ct value for each miRNA and the mean of the Ct values for these two housekeeping miRNAs in the same sample [22]. Quantile normalization and delta-Ct methods yielded very similar results (data not shown).
Figure 8.
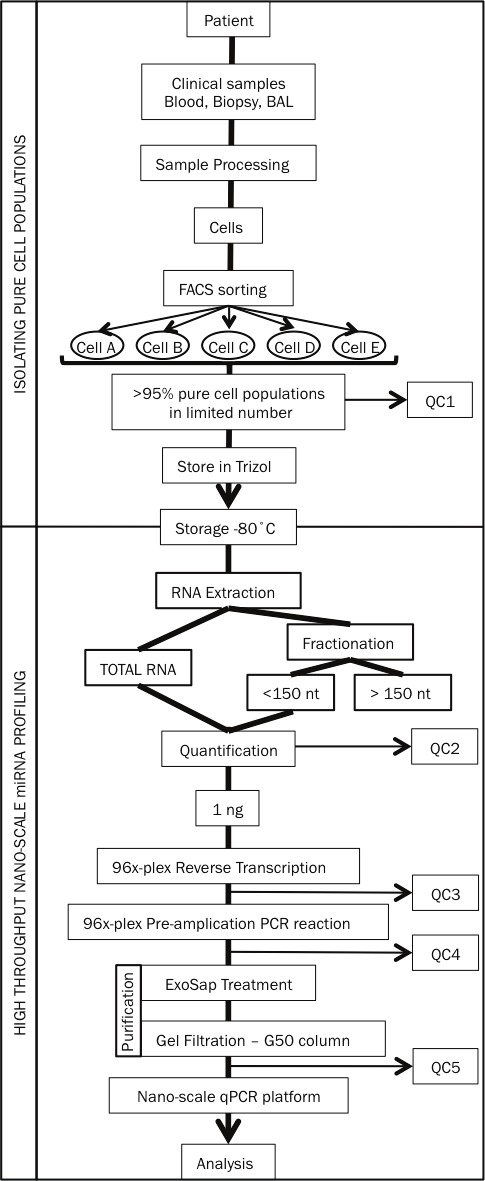
Experimental overview of our nano-scale approach to profiling miRNA in clinical samples from asthma patients. QC 1 to 5 are five mandatory quality control steps included in our approach.
Overall, miRNA expression patterns of circulating T cells were influenced more by T cell subtype than disease status (Figure 9A). In vivo differentiation of memory T cells was associated with major changes in miRNA expression in all subject groups. Among the many miRNAs that were significantly different, miR-125b, miR-263, miR-193b, miR-99a and miR-342-5p were down-regulated over 10-fold in both subsets of memory T cells compared with their shared naïve precursors, while miR-22, miR-21, miR-132, miR-23a and miR-146a were upregulated to a similar degree (Figure 9B, 10A and Table 1). Nine miRNAs (miR-181a, b, c, miR-222, miR-130b, miR-146a, miR-155, miR-221 and miR-193b) were differentially expressed in the Th2-enriched CCR4+ versus Th2-depleted CCR4- memory cell subsets (Figure 9B, 10B and Table 1). The full spectrum of miRNA expression changes seen in the freshly isolated T cells was not observed in in vitro-differentiated Th2 cells, supporting the rationale for studying in vivo, rather than in vitro differentiated cells (data not shown).
Figure 9.
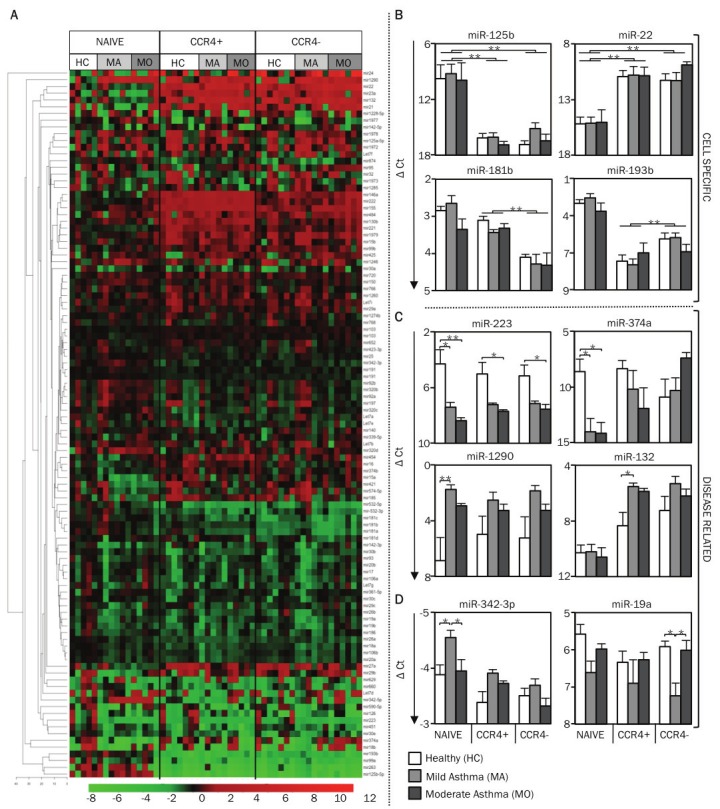
miRNA profile of circulating T cell subtypes in human asthma. A. Using nano-scale PCR, miRNA expression levels were measured in circulating CD4+ T cell subtypes (naïve, memory CCR4+, and memory CCR4-) from 7 healthy subjects (HC), 6 mild asthmatic (MA) and 6 moderate asthmatic (MO) subjects. The heat map displays the expression levels of miRNAs in each sample (all cell types from every study subject shown) relative to the expression levels seen in naïve T cells of healthy control subjects. Expression levels of miRNAs (ΔCt) in each sample was first calculated by subtracting the Ct value of the miRNA from the mean Ct value of the housekeeping miRNAs, miR-103 and miR-191, in that sample. The relative expression levels (ΔΔCt), displayed in the heat map, were calculated by subtracting the ΔCt values for each miRNA from the average ΔCt values of the same miRNA in naïve T cells of healthy control subjects. The miRNAs are hierarchically clustered using Euclidean distance with average linkage. The samples are in a fixed order, sorted by cell type, then disease group. B. The graph displays the mean (+SEM) expression levels of miR-125b, miR-22, miR-181b, and miR-193b to illustrate cell type-specific differences in miRNA expression levels. (C, D) The graph displays the mean (+SEM) expression levels of miR-223, miR-374a, miR-1290, miR-132, miR-342-3p and miR-19a to illustrate disease-related differences in miRNA expression levels. p-values were obtained by ANOVA, * p <0.01, ** p <0.001.
Figure 10.
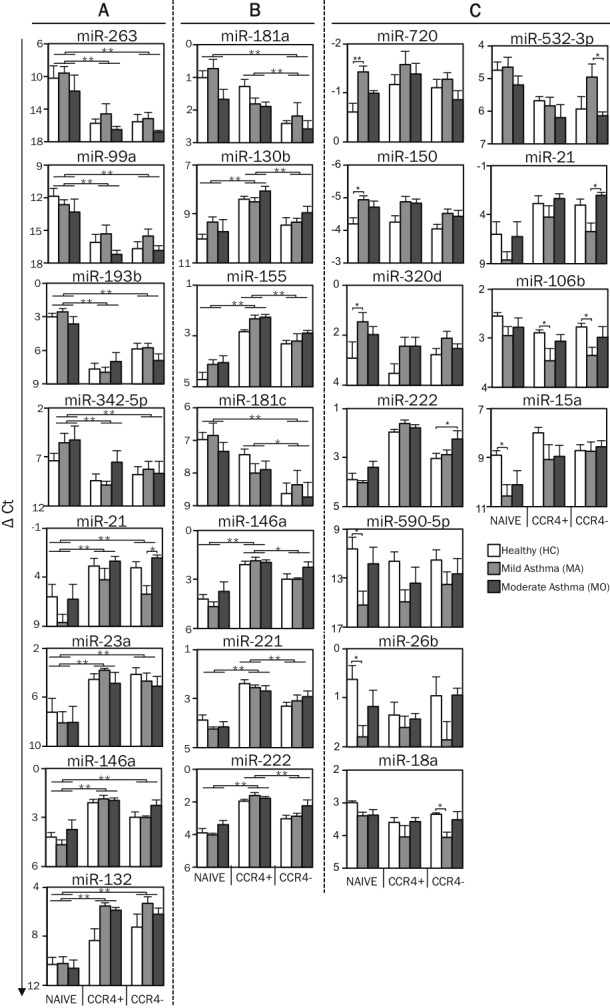
miRNA profileof circulating T cell subtypes in human asthma. A. Using nano-scale PCR, miRNA expression levels were measured in circulating CD4+ T cell subtypes (naïve, memory CCR4+, and memory CCR4-) from 7 healthy subjects (HC), 6 mild asthmatic (MA) and 6 moderate asthmatic (MO) subjects. Expression levels of miRNAs (ΔCt) in each sample was first calculated by subtracting the Ct value of the miRNA from the mean Ct value of the housekeeping miRNAs, miR-103 and miR-191, in that sample. The graph displays the mean (+SEM) expression levels of miR-263, miR-21, miR-99a, miR-23a, miR-193b, miR-146a, miR-342-5p and miR-132 to illustrate cell type-specific differences in miRNA expression levels between naïve and memory T cells. B. The graph displays the mean (+SEM) expression levels of mir-181a, miR-181c, miR-130b, miR-146a, miR-155, miR-221, and miR-222 to illustrate cell type-specific differences in miRNA expression levels between CCR4+ and CCR4- memory T cells. C. The graph displays the mean (+SEM) expression levels of miR-720, miR-590-5p, miR-150, miR-26b, miR-320d, miR-18a, miR-222, miR-15a, miR-532-3p, miR-21 and miR-106b to illustrate disease-related differences in miRNA expression levels. p-values were obtained by ANOVA, * p <0.01, ** p <0.001.
Table 1.
Statistical analysis of miRNA expression levels in cell types. Values listed in the columns under cell types are the difference (ΔCt) between the Ct value for each miRNA and the mean of Ct values for these two housekeeping miRNAs (miR-103, miR-191) in the same sample. miRNAs with a fold change >2 are shown. (FDR - False discovery rate)
| Healthy Controls | Mild Asthma | Moderate asthma | Statistics | ||||||
|---|---|---|---|---|---|---|---|---|---|
|
| |||||||||
| Naive vs CCR4- | Naïve | CCR4- | Naïve | CCR4- | Naïve | CCR4- | M (ΔΔCt) | Fold Change | FDR |
| mir24 | 13.80 | 9.69 | 13.78 | 9.78 | 10.39 | 5.34 | 4.39 | 20.9 | 0.030 |
| mir22 | 15.17 | 11.25 | 15.11 | 11.28 | 15.01 | 9.87 | 4.27 | 19.3 | 0.000 |
| mir132 | 10.29 | 7.24 | 10.21 | 5.32 | 10.57 | 6.20 | 4.04 | 16.5 | 0.000 |
| mir21 | 6.00 | 3.03 | 8.62 | 5.71 | 6.23 | 2.04 | 3.49 | 11.2 | 0.000 |
| mir23a | 7.23 | 4.11 | 8.08 | 4.67 | 8.05 | 5.08 | 3.21 | 9.3 | 0.000 |
| mir374a | 8.60 | 10.90 | 14.02 | 10.31 | 14.15 | 7.41 | 2.76 | 6.8 | 0.031 |
| mir29b | 5.22 | 3.64 | 7.93 | 5.23 | 5.43 | 3.79 | 2.11 | 4.3 | 0.004 |
| mir27a | 8.89 | 6.72 | 8.81 | 7.30 | 9.79 | 7.35 | 2.04 | 4.1 | 0.001 |
| mir146a | 4.22 | 2.97 | 4.67 | 2.98 | 3.75 | 2.26 | 1.49 | 2.8 | 0.000 |
| mir15a | 8.91 | 8.72 | 10.58 | 8.72 | 10.09 | 8.57 | 1.23 | 2.3 | 0.001 |
| mir421 | 8.61 | 7.99 | 8.91 | 7.27 | 10.09 | 8.62 | 1.22 | 2.3 | 0.011 |
| mir1979 | 1.82 | 0.63 | 1.53 | -0.01 | 1.17 | 0.44 | 1.14 | 2.2 | 0.000 |
| mir155 | 4.69 | 3.29 | 4.13 | 3.18 | 4.01 | 2.90 | 1.13 | 2.2 | 0.000 |
| mir222 | 3.90 | 3.04 | 4.03 | 2.88 | 3.39 | 2.26 | 1.05 | 2.1 | 0.000 |
| mir221 | 3.87 | 3.31 | 4.23 | 3.08 | 4.13 | 2.90 | 0.98 | 2.0 | 0.000 |
| mir532-5p | 5.63 | 7.35 | 5.81 | 6.43 | 6.71 | 7.80 | -1.17 | -2.2 | 0.002 |
| mir181b | 2.87 | 4.09 | 2.64 | 4.27 | 3.35 | 4.32 | -1.28 | -2.4 | 0.000 |
| mir181a | 1.99 | 3.41 | 1.73 | 3.17 | 2.65 | 3.58 | -1.29 | -2.4 | 0.000 |
| mir181c | 6.98 | 8.63 | 6.85 | 8.36 | 7.33 | 8.74 | -1.54 | -2.9 | 0.000 |
| mir874 | 4.00 | 5.49 | 3.88 | 6.54 | 3.61 | 4.64 | -1.72 | -3.3 | 0.001 |
| mir342-5p | 7.39 | 8.78 | 5.56 | 8.25 | 5.25 | 8.68 | -2.55 | -5.8 | 0.008 |
| mir193b | 3.00 | 5.89 | 2.55 | 5.78 | 3.63 | 6.91 | -3.15 | -8.8 | 0.000 |
| mir99a | 11.86 | 16.69 | 12.63 | 15.51 | 13.31 | 16.86 | -3.77 | -13.5 | 0.000 |
| mir263 | 10.22 | 15.56 | 9.58 | 15.16 | 11.79 | 16.81 | -5.35 | -41.7 | 0.000 |
| mir125b-5p | 9.78 | 16.87 | 9.25 | 15.14 | 9.93 | 16.48 | -6.57 | -90.9 | 0.000 |
|
| |||||||||
| Naïve vs CCR4+ | Naïve | CCR4+ | Naïve | CCR4+ | Naïve | CCR4+ | M (ΔΔCt) | Fold Change | FDR |
|
| |||||||||
| mir22 | 15.17 | 10.92 | 15.11 | 10.78 | 15.01 | 10.83 | 4.24 | 18.9 | 0.000 |
| mir21 | 6.00 | 2.87 | 8.62 | 4.23 | 6.23 | 2.35 | 3.94 | 15.3 | 0.000 |
| mir132 | 10.29 | 8.34 | 10.21 | 5.52 | 10.57 | 5.87 | 3.57 | 11.8 | 0.000 |
| mir23a | 7.23 | 4.55 | 8.08 | 3.78 | 8.05 | 4.85 | 3.39 | 10.5 | 0.000 |
| mir146a | 4.22 | 2.10 | 4.67 | 1.87 | 3.75 | 1.95 | 2.25 | 4.8 | 0.000 |
| mir222 | 3.90 | 1.96 | 4.03 | 1.61 | 3.39 | 1.77 | 1.99 | 4.0 | 0.000 |
| mir27a | 8.89 | 6.49 | 8.81 | 7.84 | 9.79 | 7.83 | 1.86 | 3.6 | 0.002 |
| mir29b | 5.22 | 4.17 | 7.93 | 5.09 | 5.43 | 4.39 | 1.80 | 3.5 | 0.019 |
| mir155 | 4.69 | 2.81 | 4.13 | 2.30 | 4.01 | 2.27 | 1.77 | 3.4 | 0.000 |
| mir221 | 3.87 | 2.38 | 4.23 | 2.56 | 4.13 | 2.69 | 1.56 | 3.0 | 0.000 |
| mir130b | 10.52 | 8.91 | 9.85 | 9.01 | 10.23 | 8.55 | 1.34 | 2.5 | 0.000 |
| mir15a | 8.91 | 7.98 | 10.58 | 9.08 | 10.09 | 8.95 | 1.32 | 2.5 | 0.001 |
| mir454 | 8.09 | 7.19 | 8.96 | 7.38 | 7.69 | 6.51 | 1.24 | 2.4 | 0.001 |
| mir1979 | 1.82 | 0.36 | 1.53 | 0.29 | 1.17 | 0.55 | 1.12 | 2.2 | 0.000 |
| mir185 | 9.47 | 8.06 | 9.53 | 9.34 | 9.83 | 8.37 | 1.07 | 2.1 | 0.032 |
| mir15b | 7.98 | 6.61 | 7.63 | 6.51 | 7.47 | 6.75 | 1.07 | 2.1 | 0.004 |
| mir421 | 8.61 | 7.48 | 8.91 | 8.30 | 10.09 | 8.91 | 1.04 | 2.1 | 0.032 |
| mir30b | 0.51 | 2.02 | 1.18 | 2.10 | 0.79 | 1.43 | -1.02 | -2.0 | 0.026 |
| mir-532-3p | 4.74 | 5.70 | 4.63 | 5.83 | 5.19 | 6.21 | -1.05 | -2.1 | 0.001 |
| mir532-5p | 5.63 | 7.04 | 5.81 | 7.68 | 6.71 | 7.55 | -1.34 | -2.5 | 0.001 |
| mir342-5p | 7.39 | 9.41 | 5.56 | 9.86 | 5.25 | 7.53 | -2.95 | -7.8 | 0.002 |
| mir99a | 11.86 | 16.11 | 12.63 | 15.35 | 13.31 | 17.21 | -3.61 | -12.2 | 0.000 |
| mir193b | 3.00 | 7.69 | 2.55 | 7.97 | 3.63 | 7.03 | -4.55 | -23.3 | 0.000 |
| mir263 | 10.22 | 15.76 | 9.58 | 14.59 | 11.79 | 16.51 | -5.16 | -35.7 | 0.000 |
| mir125b-5p | 9.78 | 16.16 | 9.25 | 16.07 | 9.93 | 16.89 | -6.72 | -111.1 | 0.000 |
|
| |||||||||
| CCR4- vs CCR4+ | CCR4- | CCR4+ | CCR4- | CCR4+ | CCR4- | CCR4+ | M (ΔΔCt) | Fold Change | FDR |
|
| |||||||||
| mir181b | 4.09 | 3.09 | 4.27 | 3.44 | 4.32 | 3.29 | 0.97 | 2.0 | 0.000 |
| mir193b | 5.89 | 7.69 | 5.78 | 7.97 | 6.91 | 7.03 | -1.40 | -2.6 | 0.027 |
Most importantly, isolating functionally relevant T cell subsets aided the identification of asthma-associated miRNA expression patterns (Figure 9C, 10C). miR-223 was significantly downregulated in subjects with mild or moderate asthma compared to healthy controls in all subsets, especially naïve T cells (Figure 9C). Like miR-223, miR-374a showed an asthma-associated reduction in naïve T cells, but the opposite pattern was observed in CCR4- memory T cells. miR-1290, a primate-specific miRNA, was the most significantly upregulated miRNA in subjects with mild asthma. This difference was significant only in naïve T cells, though a similar pattern was observed in both memory subsets (Figure 9C). Interestingly, asthma-associated changes in miR-132 expression were seen only in the Th2-enriched CCR4+ memory T cell population (Figure 9C). These examples illustrate how our approach enabled the identification of asthma-associated miRNAs while also revealing the cell types in which miRNA levels are perturbed in diseased states.
Four miRNAs (miR-342-3p, miR-19a, miR-21 and miR-532-3p) were differentially expressed between mild asthmatic subjects who had never received corticosteroid treatment and moderate asthmatic subjects whose symptoms were controlled with inhaled corticosteroids (Figure 9D, 10C). Intriguingly, these miRNAs displayed similar patterns in moderate asthmatic subjects and healthy controls, suggesting that their dysregulated expression in asthma, as revealed in mild corticosteroid-naïve asthmatic subjects, may be corrected by corticosteroid treatment.
miRNA profile of asthmatic airway T cells
To test whether tissue-specific programming events shape the miRNA profile of T cells in asthma, we compared the miRNA profile of T cells from bronchial tissue and blood. The expression of most miRNAs correlated closely in these two compartments for all subject groups (Figure 11A). However, a small group of miRNAs exhibited tissue-specific expression in one or more subject groups (Figure 11B). miR-125b and miR-451 were significantly increased in airway T cells in healthy subjects, while miR-1977, miR-423 and let-7a were decreased in the airway T cells of mild asthmatic subjects (Figure 11B). We next tested whether the effect of airway tissue residence on miRNA expression was significantly different between healthy and asthmatic subjects. Indeed, four miRNAs (miR-125b, miR-19a, miR-19b and miR-106b) exhibited decreased airway-specific expression in mild asthmatic subjects compared to healthy controls (Figure 11B). Intermediate levels of airway-specific expression were observed in moderate asthmatic subjects (Figure 11B). Differences in the expression of miRNAs in both blood and airway T cells contributed to asthma-associated changes.
Figure 11.
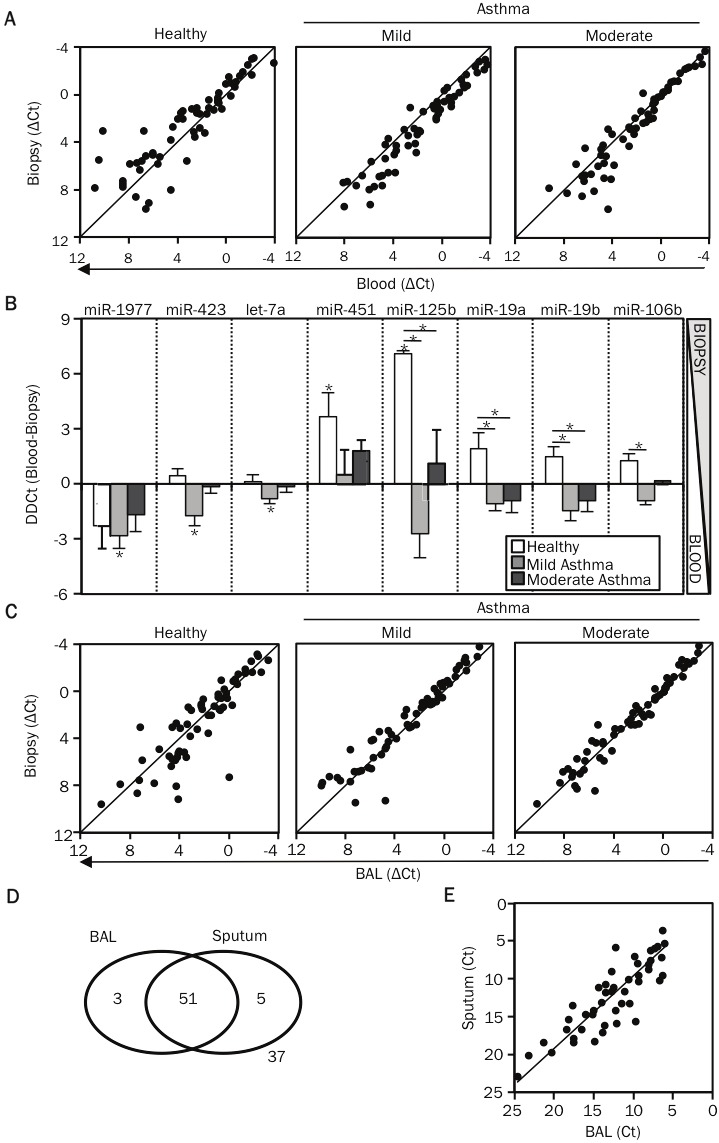
Airway T cells have a distinct miRNA signature compared to circulating T cells. A. Using nano-scale PCR, miRNA expression levels were measured in CD3+ T cells isolated from matched bronchial biopsy, BAL and blood specimens of 3 healthy controls, 6 mild and 6 moderate asthmatic patients. Expression levels of miRNAs (ΔCt) in each sample were first calculated by subtracting the Ct value of the miRNA from the mean Ct value of the housekeeping miRNAs, miR-103 and miR-191, in that sample. The dot-plot displays the correlation in miRNA expression levels (ΔCt) between T cells obtained from bronchial biopsy and blood specimens, across the study groups. B. The graph displays the difference in the expression levels (ΔΔCt) between blood and bronchial biopsy T cells (ΔΔCt= ΔCt blood - ΔCt bronchial biopsy). All miRNAs indicated on the figure were differentially expressed in airway T cells compared to blood T cells i.e. airway-specific are shown. miR-125b, miR-19a, miR-19b and miR-106b had expression values (ΔΔCt) significantly different between healthy subjects and asthmatic patients. p-values were obtained by ANOVA, * p <0.01. C. Dot-plots display the correlation in miRNA expression levels between T cells obtained from bronchial biopsy and BAL specimens, across the study groups. D. A panel of 96 miRNAs (mix 2) was measured in BAL and sputum supernatant samples by using the nano-scale PCR method. The venn diagram illustrates the overlap in the miRNAs detected in the two samples. E. The dot-plot displays the correlation in miRNA expression levels (Ct values) between BAL and sputum supernatant samples.
Finally, we compared airway lumenal T cells collected from BAL with airway tissue T cells sorted from bronchial biopsies. miRNA expression was highly correlated in T cells sorted from these distinct lung compartments, though a few miRNAs (miR-106b, miR-92b and miR-25) highly expressed in BAL T cells, were slightly but significantly less abundant in tissue-infiltrating T cells from biopsies (Figure 11C).
Airways lining fluids, sputum and BAL, have comparable miRNA profiles
Profiling miRNAs in serum has proven a useful and popular method for disease biomarker discovery [23]. We used nano-scale qPCR to measure 96 miRNAs in fluids lining diseased lung tissue, as these samples are more likely to provide disease-specific information than serum. BAL and induced sputum supernatants contained a diverse and abundant pool of miRNAs (Figure 11D and Table 2). Moreover, their miRNA profiles correlated closely, supporting the use of noninvasively obtained sputum supernatant as a surrogate for BAL, which requires bronchoscopy (Figure 11E). These data demonstrate that the fluid fractions of sputum and BAL samples are a rich source of miRNAs that can be profiled by nano-scale qPCR for biomarker discovery in various lung diseases, including asthma.
Table 2.
List of miRNA detected in Sputum and BAL supernatants
| Sputum and BAL (51) | BAL ONLY(3) | Sputum ONLY (5) |
|---|---|---|
| Let7b | mir100 | Let7f |
| Let7d | mir378 | mir122 |
| Let7g | mir663b | mir1977 |
| mir103 | mir263 | |
| mir106a | mir874 | |
| mir1228 5p | ||
| mir125 5p | ||
| mir1260 | ||
| mir130b | ||
| mir140 | ||
| mir142 5p | ||
| mir146a | ||
| mir150 | ||
| mir151 5p | ||
| mir15b | ||
| mir16 | ||
| mir17 | ||
| mir181c | ||
| mir181d | ||
| mir186 | ||
| mir18b | ||
| mir191 | ||
| mir193b | ||
| mir195 | ||
| mir1972 | ||
| mir1979 | ||
| mir199 5p | ||
| mir19b | ||
| mir20b | ||
| mir222 | ||
| mir26b | ||
| mir29b | ||
| mir29c | ||
| mir30a | ||
| mir30e | ||
| mir320c | ||
| mir339 5p | ||
| mir342 3p | ||
| mir345 | ||
| mir374a | ||
| mir451 | ||
| mir483 5p | ||
| mir532 3p | ||
| mir574 5p | ||
| mir590 3p | ||
| mir629 | ||
| mir660 | ||
| mir92a | ||
| mir93 | ||
| mir95 | ||
| mir99a |
Discussion
The nearly ubiquitous involvement of the miRNA pathway in mammalian development, tissue homeostasis, and pathology has spurred an enormous effort to catalogue and characterize miRNA expression and function in a large variety of experimental and clinical settings. Research into mechanisms and markers of human disease is frequently constrained by the limited amount of tissue available for research purposes. In addition, tissue heterogeneity may obscure disease-associated gene expression signals unless the effort is made to isolate and study individual cell types that are involved in disease pathogenesis. This process further limits the number of cells available for analysis, especially for diseases driven by relatively small populations of infiltrating inflammatory cells. Therefore, it is vitally important to develop techniques to study tissue responses and signatures of disease at a miniaturized scale. To meet this need, we developed a novel integrated approach for profiling miRNA expression in very small numbers of cells obtained from clinical specimens. Our approach couples cell sorting from dispersed tissues with a high fidelity and high throughput qRT-PCR method that delivers sensitive and quantitative miRNA detection in RNA samples from as little as 100 cells.
We applied our integrated approach to discover differentially expressed miRNAs in FACS sorted peripheral blood and airway-infiltrating T lymphocytes in a cross-sectional study of human asthma. A prior analysis of miRNA expression patterns in lung biopsy samples failed to identify asthma or corticosteroid treatment-associated miRNAs, possibly due to the heterogeneous cellular content of tissue biopsies [24]. Consistent with this possibility, analysis of airway brushings, which are highly enriched for epithelial cells, uncovered dramatically altered miRNA expression patterns in asthmatic subjects [25]. Employing cell sorting to isolate pathologically relevant inflammatory cells with nano-scaled assays for miRNA profiling in very small cell samples, we were able to identify several miRNAs associated with cell type, disease status, and tissue of origin. Major differences in miRNA expression were observed between isolated human naïve and memory T cell subtypes. These data extend previous observations, both in in vitro and mouse models, that memory T cell differentiation involves extensive miRNA repertoire reprogramming [21,26-29]. Since the relative frequency of T cell subtypes varies significantly among individuals, this dominant pattern of cell type-specific differences in miRNA expression could have confounded comparisons between healthy and asthmatic subjects. However, isolating homogenous cell populations prior to profiling, considerably reduced this source of variation and allowed us to identify miRNA expression patterns associated with asthma.
This report provides a generic experimental framework and tools to facilitate the discovery of miRNAs that are associated with human diseases. The miRNA signatures identified in this study may be extended and refined by further analysis of miRNA expression in relation to asthma susceptibility, severity, active Th2 inflammation, and response to therapy. By focusing on freshly isolated pathogenic T cells present in the blood and airways, we greatly increased the probability that the differentially expressed miRNAs discovered in our study regulate immune functions that contribute to asthma pathology. Regardless of whether the perturbations in miRNA expression are the cause or effect of disease, they represent attractive drug targets and/or biomarkers for asthma.
Acknowledgments
We thank the staff at the Wellcome Trust Clinical Research Facility (University of Southampton, UK) where samples were acquired from volunteers; Richard Jewel and Carolann McGuire for providing assistance in the flow cytometry facility; Andrea Barczak and Rebecca Barbeau at the SABRe Functional Genomics core facility; and Alain Mir at Fluidigm for helpful discussions and assistance with the Biomark instrument. This project was funded by the Dana Foundation (K.M.A), the UCSF Program for Breakthrough Biomedical Research (K.M.A. & D.J.E.), GSK National Clinician Scientist Fellowship Award and Peel Travel Fellowship Award (P.V.). L.J.S. is a National Science Foundation Graduate Research Fellow.
Author Contributions
G.S., P.V., K.M.A. conceived the work, designed, performed and analyzed experiments, and wrote the paper; G.S. and P.V. obtained clinical specimens and performed experiments; N.O., L.K., M.N., A.P.g. recruited patients, helped obtain clinical specimens and, as well as L.S., performed some experiments; P.G.W. and J.V.F. recruited patients, obtained, and prepared BAL and sputum supernatants; R.D. provided support and direction for obtaining and processing clinical specimens; R.B. and F.M. designed miRNA primers and shared multiplex qRT-PCR protocols prior to their publication; C.E. & D.E. performed statistical analysis.
References
- 1.O’connell RM, Rao DS, Chaudhuri AA, Baltimore D. Physiological and pathological roles for microRNAs in the immune system. Nat Rev Immunol. 2010;10:111–122. doi: 10.1038/nri2708. [DOI] [PubMed] [Google Scholar]
- 2.Lanford RE, Hildebrandt-Eriksen ES, Petri A, Persson R, Lindow M, Munk ME, Kauppinen S, Orum H. Therapeutic silencing of microRNA-122 in primates with chronic hepatitis C virus infection. Science. 2010;327:198–201. doi: 10.1126/science.1178178. [DOI] [PMC free article] [PubMed] [Google Scholar]
- 3.Lu J, Getz G, Miska EA, Alvarez-Saavedra E, Lamb J, Peck D, Sweet-Cordero A, Ebert BL, Mak RH, Ferrando AA, Downing JR, Jacks T, Horvitz HR, Golub TR. MicroRNA expression profiles classify human cancers. Nature. 2005;435:834–838. doi: 10.1038/nature03702. [DOI] [PubMed] [Google Scholar]
- 4.Chen X, Ba Y, Ma L, Cai X, Yin Y, Wang K, Guo J, Zhang Y, Chen J, Guo X, Li Q, Li X, Wang W, Wang J, Jiang X, Xiang Y, Xu C, Zheng P, Zhang J, Li R, Zhang H, Shang X, Gong T, Ning G, Zen K, Zhang CY. Characterization of microRNAs in serum: a novel class of biomarkers for diagnosis of cancer and other diseases. Cell Res. 2008;18:997–1006. doi: 10.1038/cr.2008.282. [DOI] [PubMed] [Google Scholar]
- 5.Castanotto D, Rossi JJ. The promises and pitfalls of RNA-interference-based therapeutics. Nature. 2009;457:426–433. doi: 10.1038/nature07758. [DOI] [PMC free article] [PubMed] [Google Scholar]
- 6.Wang Q, Wang Y, Minto AW, Wang J, Shi Q, Li X, Quigg RJ. MicroRNA-377 is up-regulated and can lead to increased fibronectin production in diabetic nephropathy. FASEB J. 2008;22:4126–4135. doi: 10.1096/fj.08-112326. [DOI] [PMC free article] [PubMed] [Google Scholar]
- 7.Li Z, Zhang S, Huang C, Zhang W, Hu Y, Wei B. MicroRNAome of splenic macrophages in hypersplenism due to portal hypertension in hepatitis B virus-related cirrhosis. Exp Biol Med (Maywood) 2008;233:1454–1461. doi: 10.3181/0711-RM-321. [DOI] [PubMed] [Google Scholar]
- 8.Vijayanand P, Durkin K, Hartmann G, Morjaria J, Seumois G, Staples KJ, Hall D, Bessant C, Bartholomew M, Howarth PH, Friedmann PS, Djukanovic R. Chemokine receptor 4 plays a key role in T cell recruitment into the airways of asthmatic patients. J Immunol. 2010;184:4568–4574. doi: 10.4049/jimmunol.0901342. [DOI] [PubMed] [Google Scholar]
- 9.Pauwels RA, Buist AS, Calverley PM, Jenkins CR, Hurd SS. Global strategy for the diagnosis, management, and prevention of chronic obstructive pulmonary disease. NHLBI/WHO Global Initiative for Chronic Obstructive Lung Disease (GOLD) Workshop summary. Am J Respir Crit Care Med. 2001;163:1256–1276. doi: 10.1164/ajrccm.163.5.2101039. [DOI] [PubMed] [Google Scholar]
- 10.Vijayanand P, Seumois G, Pickard C, Powell RM, Angco G, Sammut D, Gadola SD, Friedmann PS, Djukanovic R. Invariant natural killer T cells in asthma and chronic obstructive pulmonary disease. N Engl J Med. 2007;356:1410–1422. doi: 10.1056/NEJMoa064691. [DOI] [PubMed] [Google Scholar]
- 11.Tang F, Hajkova P, Barton SC, O’Carroll D, Lee C, Lao K, Surani MA. 220-plex microRNA expression profile of a single cell. Nat Protoc. 2006;1:1154–1159. doi: 10.1038/nprot.2006.161. [DOI] [PubMed] [Google Scholar]
- 12.Gentleman RC, Carey VJ, Bates DM, Bolstad B, Dettling M, Dudoit S, Ellis B, Gautier L, Ge Y, Gentry J, Hornik K, Hothorn T, Huber W, Iacus S, Irizarry R, Leisch F, Li C, Maechler M, Rossini AJ, Sawitzki G, Smith C, Smyth G, Tierney L, Yang JY, Zhang J. Bioconductor: open software development for computational biology and bioinformatics. Genome Biol. 2004;5:R80. doi: 10.1186/gb-2004-5-10-r80. [DOI] [PMC free article] [PubMed] [Google Scholar]
- 13.Robinson DS, Hamid Q, Ying S, Tsicopoulos A, Barkans J, Bentley AM, Corrigan C, Durham SR, Kay AB. Predominant Th2-Like Bronchoalveolar Lymphocyte-T Population in Atopic Asthma. N Engl J Med. 1992;326:298–304. doi: 10.1056/NEJM199201303260504. [DOI] [PubMed] [Google Scholar]
- 14.Vijayanand P, Seumois G, Pickard C, Powell RM, Angco G, Sammut D, Gadola SD, Friedmann PS, Djukanovic R. Invariant natural killer T cells in asthma and chronic obstructive pulmonary disease. N Engl J Med. 2007;356:1410–1422. doi: 10.1056/NEJMoa064691. [DOI] [PubMed] [Google Scholar]
- 15.Vijayanand P, Durkin K, Hartmann G, Morjaria J, Seumois G, Staples KJ, Hall D, Bessant C, Bartholomew M, Howarth PH, Friedmann PS, Djukanovic R. Chemokine receptor 4 plays a key role in T cell recruitment into the airways of asthmatic patients. J Immunol. 2010;184:4568–4574. doi: 10.4049/jimmunol.0901342. [DOI] [PubMed] [Google Scholar]
- 16.Spurgeon SL, Jones RC, Ramakrishnan R. High throughput gene expression measurement with real time PCR in a microfluidic dynamic array. PLoS One. 2008;3:e1662. doi: 10.1371/journal.pone.0001662. [DOI] [PMC free article] [PubMed] [Google Scholar]
- 17.Chen C, Ridzon DA, Broomer AJ, Zhou Z, Lee DH, Nguyen JT, Barbisin M, Xu NL, Mahuvakar VR, Andersen MR, Lao KQ, Livak KJ, Guegler KJ. Real-time quantification of microRNAs by stem-loop RT-PCR. Nucleic Acids Res. 2005;33:e179. doi: 10.1093/nar/gni178. [DOI] [PMC free article] [PubMed] [Google Scholar]
- 18.Moltzahn F, Olshen AB, Baehner L, Peek AS, Fong L, Stoppler HJ, Simko J, Hilton JF, Carroll PR, Blelloch R. Microfluidic based multiplex qRT-PCR identifies diagnostic and prognostic microRNA signatures in sera of prostate cancer patients. Cancer Res. 2010 doi: 10.1158/0008-5472.CAN-10-1229. [DOI] [PMC free article] [PubMed] [Google Scholar]
- 19.Sandig H, McDonald J, Gilmour J, Arno M, Lee TH, Cousins DJ. Human Th2 cells selectively express the orexigenic peptide, pro-melanin-concentrating hormone. Proc Natl Acad Sci U S A. 2007;104:12440–12444. doi: 10.1073/pnas.0705457104. [DOI] [PMC free article] [PubMed] [Google Scholar]
- 20.Git A, Dvinge H, Salmon-Divon M, Osborne M, Kutter C, Hadfield J, Bertone P, Caldas C. Systematic comparison of microarray profiling, real-time PCR, and next-generation sequencing technologies for measuring differential microRNA expression. RNA. 2010;16:991–1006. doi: 10.1261/rna.1947110. [DOI] [PMC free article] [PubMed] [Google Scholar]
- 21.Barski A, Jothi R, Cuddapah S, Cui K, Roh TY, Schones DE, Zhao K. Chromatin poises miRNA- and protein-coding genes for expression. Genome Res. 2009;19:1742–1751. doi: 10.1101/gr.090951.109. [DOI] [PMC free article] [PubMed] [Google Scholar]
- 22.Bargaje R, Hariharan M, Scaria V, Pillai B. Consensus miRNA expression profiles derived from interplatform normalization of microarray data. RNA. 2010;16:16–25. doi: 10.1261/rna.1688110. [DOI] [PMC free article] [PubMed] [Google Scholar]
- 23.Mitchell PS, Parkin RK, Kroh EM, Fritz BR, Wyman SK, Pogosova-Agadjanyan EL, Peterson A, Noteboom J, O’Briant KC, Allen A, Lin DW, Urban N, Drescher CW, Knudsen BS, Stirewalt DL, Gentleman R, Vessella RL, Nelson PS, Martin DB, Tewari M. Circulating microRNAs as stable blood-based markers for cancer detection. Proc Natl Acad Sci U S A. 2008;105:10513–10518. doi: 10.1073/pnas.0804549105. [DOI] [PMC free article] [PubMed] [Google Scholar]
- 24.Williams AE, Larner-Svensson H, Perry MM, Campbell GA, Herrick SE, Adcock IM, Erjefalt JS, Chung KF, Lindsay MA. MicroRNA expression profiling in mild asthmatic human airways and effect of corticosteroid therapy. PLoS One. 2009;4:e5889. doi: 10.1371/journal.pone.0005889. [DOI] [PMC free article] [PubMed] [Google Scholar]
- 25.Solberg OD, Ostrin EJ, Love MI, Peng JC, Bhakta NR, Hou L, Nguyen C, Solon M, Barczak AJ, Zlock LT, Blagev DP, Finkbeiner WE, Ansel KM, Arron JR, Erle DJ, Woodruff PG. Airway Epithelial miRNA Expression is Altered in Asthma. American journal of respiratory and critical care medicine. 2012 doi: 10.1164/rccm.201201-0027OC. [DOI] [PMC free article] [PubMed] [Google Scholar]
- 26.Monticelli S, Ansel KM, Xiao C, Socci ND, Krichevsky AM, Thai TH, Rajewsky N, Marks DS, Sander C, Rajewsky K, Rao A, Kosik KS. MicroRNA profiling of the murine hematopoietic system. Genome Biol. 2005;6:R71. doi: 10.1186/gb-2005-6-8-r71. [DOI] [PMC free article] [PubMed] [Google Scholar]
- 27.Merkerova M, Belickova M, Bruchova H. Differential expression of microRNAs in hematopoietic cell lineages. Eur J Haematol. 2008;81:304–310. doi: 10.1111/j.1600-0609.2008.01111.x. [DOI] [PubMed] [Google Scholar]
- 28.Kuchen S, Resch W, Yamane A, Kuo N, Li Z, Chakraborty T, Wei L, Laurence A, Yasuda T, Peng S, Hu-Li J, Lu K, Dubois W, Kitamura Y, Charles N, Sun HW, Muljo S, Schwartzberg PL, Paul WE, O’Shea J, Rajewsky K, Casellas R. Regulation of microRNA expression and abundance during lymphopoiesis. Immunity. 2010;32:828–839. doi: 10.1016/j.immuni.2010.05.009. [DOI] [PMC free article] [PubMed] [Google Scholar]
- 29.Wu H, Neilson JR, Kumar P, Manocha M, Shankar P, Sharp PA, Manjunath N. miRNA profiling of naive, effector and memory CD8 T cells. PLoS One. 2007;2:e1020. doi: 10.1371/journal.pone.0001020. [DOI] [PMC free article] [PubMed] [Google Scholar]