

Abstract
A major challenge in creating and optimizing therapeutics in the fight against cancer is visualizing and understanding the microscale spatiotemporal treatment response dynamics that occur in patients. This is especially true for photodynamic therapy (PDT), where therapeutic optimization relies on understanding the interplay between factors such as photosensitizer localization and uptake, in addition to light dose and delivery rate. In vitro 3D culture systems that recapitulate many of the biological features of human disease are powerful platforms for carrying out detailed studies on PDT response and resistance. Current techniques for visualizing these models, however, often lack accuracy due to the perturbative nature of the sample preparation, with light attenuation complicating the study of intact models. Optical coherence tomography (OCT) is an ideal method for the long-term, non-perturbative study of in vitro models and their response to PDT. Monitoring the response of 3D models to PDT by time-lapse OCT methods promises to provide new perspectives and open the way to cancer treatment methodologies that can be translated towards the clinic.
Keywords: antitumor agents, cancer, optical coherence tomography, photodynamic therapy, sensitizers
1. Introduction
1.1. Challenges in Therapeutic Monitoring of Cancer
Therapeutic monitoring is a critical aspect in understanding and optimizing the treatment of disease. Determining how and why therapeutics succeed or fail in the treatment of cancer presents major difficulties: while anticancer agents impart their effects on subcellular scales, evidence of treatment response can range from micrometer-scale cellular features to cancerous lesions tens of centimeters in size. Further complicating matters, tumors are often heterogeneous, containing a disordered mixture of cancer cells, various tumor-associated cells and stroma, and gradients in physiological factors such as pH, nutrients, waste products, and oxygen.[1,2] Visualizing treatment response and mapping the role of these complex factors on the microscale is a challenge that must be met to design better, more targeted, and even personalized therapies in the fight against cancer.
These considerations are especially important when treating cancer using photodynamic therapy (PDT).[3] PDT is a binary treatment modality that makes use of molecules known as photosensitizers (PSs) that are activated through illumination by select wavelengths of light. PDT is an FDA-approved approach for the treatment of numerous diseases, such as age-related macular degeneration and many forms of cancer.[4] It is particularly apt for cancer treatment as it imparts two degrees of selectivity: (i) PSs are typically accumulated in cancerous lesions,[3,5] and (ii) the phototherapy is limited to regions of tissue directly irradiated during treatment. PDT shows particular promise against treatment-resistant cancer, as it has been demonstrated to be highly effective against some tumors that have acquired drug resistance.[6–8] In PDT, absorption of photons causes PSs to generate reactive species such as singlet oxygen, hydroxyl radicals, and other short-lived reactive species that cause local damage.[9] Since the mechanisms of cellular damage in PDT are different from traditional chemotherapeutic and radiation therapy interventions,[9] PDT is a powerful alternative therapy for cancer treatment.
Many studies have investigated the mechanisms of action of anticancer regimens and PDT using large-volume, whole organ approaches such as computed tomography (CT), magnetic resonance imaging (MRI), and positron emission tomography (PET). While CT, MRI, and PET are indispensable tools in clinical practice and cancer research, their resolutions, even for advanced micro-MRI systems,[10] are not fully capable of visualizing crucial microscale cellular treatment response processes.
Microscale imaging provides detailed information about the mechanisms underlying therapeutic action. The “gold standard,” histological examination of tissue, has been and continues to be indispensable for the detailed study of therapeutic response in both humans and animal models of disease. The wide number of stains beyond the typical hematoxylin and eosin (H&E) enable clinicians and researchers to extract extensive information from tissue samples. Histological approaches, unfortunately, require the destruction of the living sample: preparing slides for staining requires extensive sample processing, including fixation and embedding steps that can fundamentally alter tissue samples, potentially introducing staining artifacts that require interpretation by highly trained specialists. Even techniques that involve minimal sample preparation, such as the creation of frozen tissue blocks, still kill the living tissue. These histological sample requirements thus limit the power of histological analysis of a given region of tissue to a single point in time.
In contrast, optical imaging technologies such as fluorescence, confocal fluorescence, multiphoton microscopy,[11] and coherent Raman scattering (CRS) microscopy[12,13] allow for non-destructive, repeated in situ visualization of tissues and therapeutic response on the subcellular scale. Fluorescence contrast can come from both intrinsic and extrinsic contrast agents, and numerous fluorophores can be utilized in a single experiment to allow multiplexed measurements.[14] The intrinsic contrast provided by autofluorescence has been used to visualize the details of tissues[15] and follow cellular redox potentials[16] and metabolic activity.[17] The introduction of endogenous fluorescent reporters such as the green fluorescent protein (GFP)[18,19] into cells, in vitro systems, and animal models of cancer has transformed cancer imaging, allowing for detailed, multiplex visualization of cancer biology, signaling, and treatment response.[20,21] Extrinsic contrast agents that selectively stain tissues or diseases of interest have been found useful in understanding cancer treatment response.[22] Advanced CRS imaging tools like coherent anti-Stokes Raman scattering (CARS)[12] and stimulated Raman scattering (SRS) microscopy[13,23] offer the ability to selectively visualize classes of chemicals with similar vibrational resonances, and are just starting to be applied in visualizing cancer.[24] These technologies are, however, largely restricted to episodic experiments, with dynamic information only collected during imaging sessions themselves; they are not designed to follow tissue regions for days or weeks.
1.2. In Vitro Models
In vitro cancer model systems provide a powerful alternative to human or animal experiments because they replicate features of the human disease crucial for understanding tumor growth,[25–28] signaling,[29–31] and treatment response.[32–37] In vitro three-dimensional culture systems provide cells with critical cell-cell and cell-matrix signaling cues, creating models that approximate the in vivo environment far more effectively than do traditional monolayer cultures. Extracellular matrices, both natural and synthetic, can provide signals that enable cells to naturally and spontaneously form in vitro models that replicate tissue features. For example, immortalized breast cells plated on a bed of reconstituted basement membrane known as Matrigel will self-assemble into small spheroids that resemble mammary gland terminal end buds.[38] Synthetic R-D-G repeat peptides provide signaling cues similar to collagen that encourage three-dimensional growth of tumor[39] and nontumor cell types. In vitro models are now a major focus of the National Institutes of Health, which seeks to spur the development of new tools capable of providing relevant information to either avoid animal studies or significantly reduce the number of animals needed. Spheroid models of cancer have existed for almost four decades, with early suspension in vitro cultures used to study the detailed effects of therapy.[25,32] Current in vitro culture systems offer far greater sophistication, with the ability to grow highly homogenous nodules,[26–28] spatially coculture different cell types,[40] and create simulated neovasculature.[41,42] Recently developed in vitro models of metastatic ovarian cancer have allowed for cellular-level studies of therapeutic response, permitting detailed experiments to investigate heterogeneous nodular response,[35] combination therapeutics,[43] chemotherapeutic failure,[34] hypoxia-targeting therapy,[37] and therapeutic optimization[44] (Figure 1). These models can be grown, maintained, and treated entirely on microscope culture environments,[37] in principle, enabling fully continuous, non-episodic monitoring.
Figure 1.
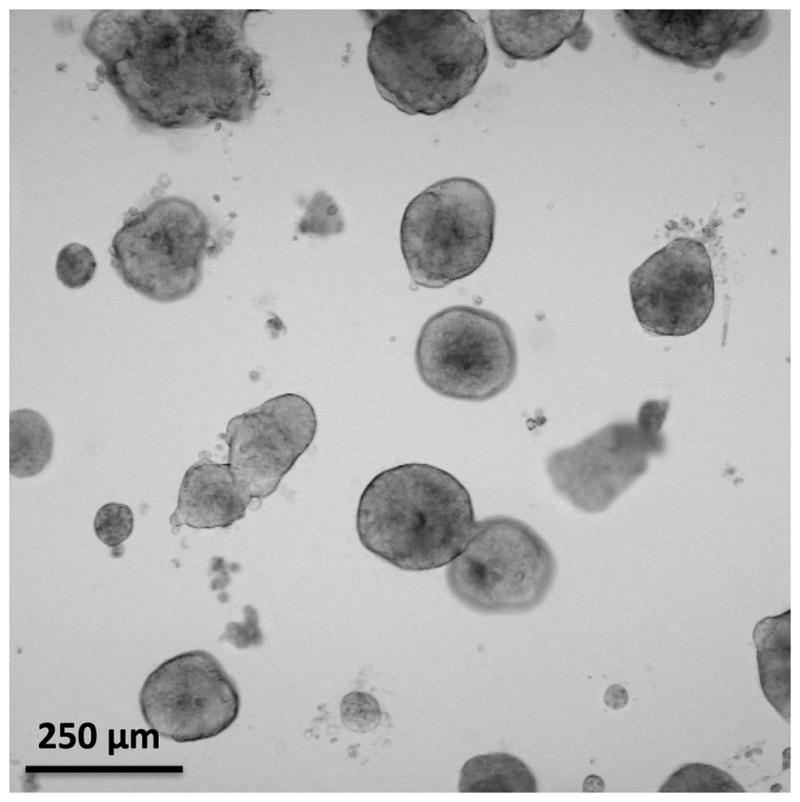
Transmission microscopy image of in vitro 3D metastatic ovarian cancer model nodules grown for 13 days. The degree of heterogeneity in the model nodule sizes is helpful in understanding the complex therapeutic response of metastatic ovarian cancer in vivo.
Problematically, many of the existing high-resolution imaging technologies are not capable of capturing the dynamic and ongoing response to treatment. In such cultures, technologies based on fluorescence emission suffer from photobleaching, a phenomenon in which the fluorophore is destroyed over time due to repeated molecular excitation. Fluorescent proteins can be re-expressed over time, but there is the potential for phototoxicity through repeated imaging sessions. Although coherent Raman microscopies do not suffer from photobleaching, the powers generally used for imaging are in the 1–10 mW range, and there is a risk of long-term heating of samples as well as nonlinear photodamage.[24,45]
High-resolution imaging techniques can also suffer from limited penetration depth, which restricts their utility in model systems. Confocal microscopies take advantage of a pinhole placed in the detection path to exclude light not emitted from the focal plane. In the turbid environments of many tumor model systems, much of this emission light is scattered outside the focal plane, leading to its rejection by the confocal pinhole. As the probability of an emitted photon being scattered increases with imaging depth, confocal microscopy is largely limited to a 100–200 μm imaging depth. Considerably deeper imaging depths can be reached using multiphoton-based microscopies, where fluorophores are excited via the simultaneous absorption of two or three, typically infrared, photons from an ultrafast source. Standard commercial multiphoton microscopes image at depths over 300 μm in some tissues and tumor models, with custom systems capable of exceeding 1 mm. However, the multiphoton excitation efficiency is largely related to the quality of the microscope focus, which can be significantly degraded by depth-dependent light scattering.
In addition, as microscopy techniques, these approaches are largely designed to collect single high-resolution lateral XY images. Volumetric data can be collected by scanning the axial focal position, but in most cases such an approach is time consuming. Moreover, as the axial and lateral resolutions are determined by the microscope objective lens, gathering high-resolution volumetric data often requires large-scale mosaic imaging. Despite the capabilities of high-resolution microscopy, these limitations can often prove difficult for long-term therapeutic response studies.
1.3. Optical Coherence Tomography for In Vitro Therapeutic Response Imaging
An ideal monitoring technology for in vitro studies of therapeutic response would allow for continuous visualization of treatment effect dynamics in a non-perturbative manner over millimeter-sized volumes with cellular or subcellular resolution. Optical coherence tomography (OCT), an interferometric imaging technology based on differential tissue scattering, offers these capabilities and is a natural partner for in vitro PDT studies. OCT, an optical ranging technology, is analogous to ultrasound, where depth information is retrieved by timing the arrival of waves reflecting off scattering structures. The axial resolution of OCT is dependent on the bandwidth of light used, allowing imaging with subcellular, micrometer resolution. OCT advantageously requires low powers of near-infrared light (ca. 10–100 μW) to rapidly collect images of tissue volumes millimeters deep, making it compatible with long-term, continuous, large-volume, perturbation-free imaging. Moreover, since the wavelengths of light used by OCT are beyond those used to excite PSs, OCT imaging is essentially orthogonal to PDT and can be used even during the PS illumination process. Importantly, OCT is a quantitative imaging tool, which is highly advantageous for evaluating key treatment response parameters such as tumor size and burden.
In this manuscript, we will review previous and new applications of OCT to visualize and understand the treatment response dynamics of PDT. After briefly reviewing PDT and its applications, the fundamentals and technology of OCT will be presented, followed by a review of OCT applications in vivo and in vitro. Finally, time-lapse OCT will be introduced along with an outlook for future PDT monitoring applications of OCT.
2. Photodynamic Therapy In Vitro
2.1. Fundamental Processes
Cytotoxicity in photodynamic therapy is mediated by reactive radical species created through the photoexcitation of PSs. The mechanism of phototoxicity is generally described in terms of two, non–mutually exclusive pathways, referred to as “type I” and “type II” photosensitization. In the type I mechanism, the excited PS generates radicals by directly interacting with surrounding molecules, creating lipid, protein, and oxygen radical species. The type II mechanism, on the other hand, involves the interaction of the excited PS with molecular oxygen.[46] Type II–capable PSs must undergo a process known as intersystem crossing where they transition to long-lived excited triplet states, which can interact by transferring excitation energy to molecular oxygen to form highly reactive singlet oxygen (1O2) species. In both mechanisms, the created radical species react with cellular components, triggering cell death. These processes are not mutually exclusive, with some PSs having the ability to impart cytotoxicity through both photochemical channels.[37] It should be noted that the generation of cytotoxic molecular species is one of several processes resulting from the relaxation of an electronically excited PS from either the singlet or (more frequently) the longer-lived triplet excited state to the ground state. This occurs parallel to, and in competition with, other processes such as fluorescence and phosphorescence (Figure 2).
Figure 2.
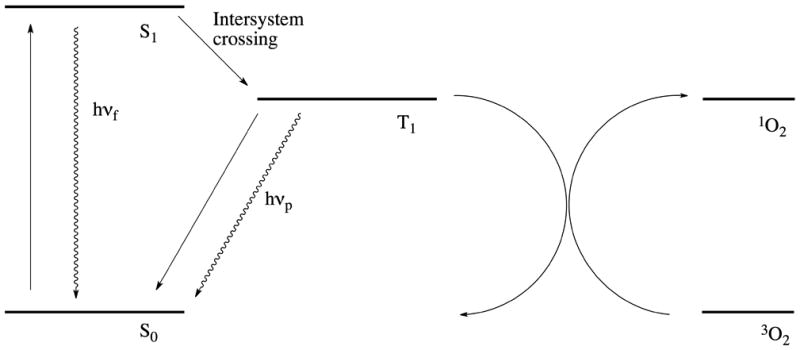
Simplified Jablonski diagram showing the photosensitized generation of singlet oxygen. Following excitation to the singlet state (S1) by absorption of a photon, the photosensitizer undergoes intersystem crossing, thus transitioning to its triplet state (T1). One of the non-radiative relaxation pathways involves transfer of the photosensitizer excitation energy to ground state oxygen (3O2), which results in the formation of singlet oxygen (1O2) and the relaxation of the photosensitizer back to its ground state (S0). Radiative relaxation pathways include the emission of fluorescent (hνf) or phosphorescent (hνp) photons.
The continuous, “catalyst-like” cycling of type II PSs is widely recognized as the dominant mechanism for many PDT agents and results in rapid oxygen consumption. This is typically followed by effective PS inactivation, as local oxygen is consumed during therapy, resulting in acute hypoxia or anoxia. Thus, for many type II PSs, tissue oxygen levels are a key limiting factor in dosimetry and therapeutic efficacy. Contrary to conventional wisdom, however, PDT does not always require molecular oxygen: a number of potent type I PSs exist, which can be superior in many applications due to their cytotoxicity in hypoxic and even anoxic environments.[37]
2.2. Cellular Mechanisms
One of the great advantages of PDT is that the mechanisms of therapeutic action are largely complementary to many traditional frontline therapies.[6–8,43] Both the type and extent of the cellular insult imparted by PDT ultimately determine the dominant mode of cellular death. The most desirable result is apoptosis, which results in the partitioning of fragmented DNA into membrane-bound particles. Necrotic cell death is another dominant cell death pathway that is associated with post-treatment inflammation due to the uncontrolled cytosolic spilling of immunogenic material from the dying cell.[3] Optimization of the intracellular PS concentration, fluence rate, and total light dose can selectively influence the desired effect.[4] Interestingly, the autophagic response has been implicated in the therapeutic response to PDT, acting as both a pro- and anti-apoptotic mechanism, depending on the cell type.[47,48]
The short half-life of most PDT-generated reactive radical species, particularly singlet oxygen,[49] largely restricts photodamage to the subcellular sites of PS localization prior to treatment. This strong dependence on subcellular localization consequently influences the pathways by which cellular death is mediated.[50] Mitochondrial-localizing PSs such as benzoporphyrin derivative mono acid A (BPD, verteporfin) and protoporphyrin IX have been shown to be especially potent[51–55] in triggering apoptosis through mitochondria membrane depolarization, cytochrome c release, and the destruction of the anti-apoptotic proteins BCL-2 and BCL-XL.[56] Lysosomal-localizing PSs, such as EtNBS,[44,57] can cause the rupture of these structures, leading to the release of enzymes that initiate apoptotic response.[58,59] PSs that localize to and destroy the endoplasmic reticulum[60] and Golgi apparatus[61,62] may also initiate cell-signaling cascades that result in cell death.[61] It should also be noted that cellular redistribution of PSs during therapy has been reported,[63,64] which would allow for the destruction of cellular organelles not originally involved in PS uptake.
2.3. Optimizing PDT
Over the past several decades, there have been many efforts to identify the characteristics that together would define an ideal PS, resulting in a wealth of PSs derived from several broad structural classes of compounds.[50] Site-activated PDT constructs have been used to increase treatment specificity, exploiting proteolytic activation by target-specific proteases in tumors.[65] Similarly, photoimmunotherapy (PIT) approaches[66,67] and other targeted delivery constructs[68] have successfully increased treatment specificity and reduction of toxicity.[69] Reports of synergistic enhancement of chemotherapeutic efficacy following PDT in 3D in vitro tumor models[43] have highlighted the potential for combinatorial treatment regimens employing PDT alongside frontline agents.
The mechanisms of therapeutic action, resistance and response of PDT are well-characterized on the cellular and molecular level. The application of PDT as a frontline clinical therapeutic modality for the treatment of cancers necessitates a complete understanding of the many mechanisms and responses on the tissue level. The differential uptake, localization, pharmacokinetics, and mechanisms of action of many PSs introduce numerous variables in the photochemical treatment of cancer. Therapeutic parameters such as drug dose, incubation time, drug-light interval (the period of time between drug administration and therapeutic illumination), light fluence rate, and light dose must be individually tailored for the application of a specific PS to a patient’s needs. Furthermore, microenvironmental tumor heterogeneity is a major contributing factor to the complex treatment response and therapeutic resistance mechanisms observed in vivo. In order to fully understand treatment response in vivo, quantitative analysis methods are needed that provide detailed structural information at both cellular- and tissue-level scales. Light scattering–based methods such as OCT provide non-perturbative, longitudinal, quantitative therapeutic monitoring capabilities that have the potential to enable the new insights and breakthroughs necessary to bring PDT to the forefront of therapy.
3. Optical Coherence Tomography
OCT is a non-invasive imaging modality that can provide cross-sectional images of a sample with high resolution and deep penetration of up to several millimeters.[70,71] These properties have driven the rapid development of OCT since its first demonstration in retinal and coronary imaging.[72] Developments in light source technology, detectors, and detection schemes have helped to drive this clinical push.[70,72–74] Today, OCT is widely applied in ophthalmology,[75–77] cardiology,[78] gastroenterology,[79,80] dermatology,[81,82] and oncology.[71,83]
3.1. Light Scattering Contrast for Diagnostics
OCT derives its contrast from light scattering in tissue, which occurs through a complex interaction resulting in the generation of an induced dipole moment and re-emission of light at the initial wavelength. The properties of scattering in tissue are most commonly described in terms of two phenomena: Rayleigh and Mie scattering. Rayleigh scattering, the simpler of the two, is dominant when the diameter of the scattering particles is much smaller than the wavelength of incident light. The more complex Mie interaction, which requires explicit evocation of Maxwell’s equations, is more applicable to the larger-sized particles and structures found in cells and tissues[84] and is therefore the major contributor to biological contrast in OCT. Mie theory accurately describes the scattering induced by particles such as lipids and cellular organelles and is primarily attributable to the difference in the indices of refraction between adjacent mediums, Δn. So-called “strong scatterers” are therefore tissue components that possess a large Δn relative to the surrounding environment (such as water, blood, cytoplasm, etc.).
Scattering can redirect photons back out of tissue, where they can then be measured and analyzed to generate considerable information regarding their interactions. Information such as scatterer size, depth, and type can be gleaned from this process and has been used to analyze intact tissue non-destructively.[85] These capabilities have sparked great interest in the past decades in identifying, characterizing, and utilizing scattering for the identification of pathological indicators.[86]
Fortuitously for cancer detection, the refractive index discontinuity Δn that occurs between lipid bilayers and the cytoplasm or organelle lumen is among the most pronounced in the cell, making the nucleus, mitochondria, and other organelles strong scatterers. Furthermore, changes in the nuclear/cytoplasmic ratio are among the earliest and most important indicators of a dysplastic transition in tissue.[87–89] Correspondingly, a body of work has emerged that correlates changes in scattering with dysplasia or malignancy in epithelial cancers. Kortum et al. used a computational/experimental hybrid approach combining a Mie model with image cytometry of cervical cancer cells to show that the transition in cell nuclear morphology from benign to dysplastic to malignant is accompanied by an overall increase in the cellular scattering cross-section.[90] Scattering from tissue as measured using reflectance spectroscopy has also been used to distinguish precancerous colon polyps from normal mucosa.[91]
The capabilities of light scattering–based technologies have been extensively applied to visualizing therapeutic response, particularly the effects of PDT in the treatment of cancer. Spectroscopic scattering and reflectance measurements have been used to quantify tumor blood oxygenation, hemoglobin concentration, and PS concentration before, during, and after PDT in human patients in situ.[92] Reflectance-based measurements of tumor blood flow and oxygenation have been useful in predicting optimal PDT response in tissue.[92,93] Scattering and reflectance measurements can also be used to pre-optimize light delivery prior to PDT by determining tissue optical properties and local PS concentrations.[94]
3.2. Fundamentals of OCT
As mentioned above, OCT is considered to be the optical analog of ultrasound, in which the time delay of a sound wave back reflected from a reflective surface is used to determine its depth. The speed of light, however, is five orders of magnitude faster than that of sound, rendering direct optical timing an impractical and technically daunting approach to determine the temporal delay. Timing measurements in OCT are therefore accomplished using low-coherence interferometry, in which broadband light is split into two paths using a Michelson-type interferometer. One arm, the “sample arm,” relays this light towards a sample, from which it is backscattered and recollected. The other path, the “reference arm,” provides a path length-matched reference reflection. The outputs of both arms are merged, generating an interference pattern that is sent into a detection arm.[95]
In the classic “time-domain” OCT configuration, the position of the reference arm is scanned to create interference fringes that correspond to reflective surfaces at equal optical path lengths in the sample. This length modulation creates an optical depth scan of the sample that, when combined with a 2D raster scan, allows for the collection of large volume, high resolution, 3D, scattering-weighted images.[72,96] Although the time-domain model is conceptually straightforward, the requirement of a moving mirror renders the scanning process slow and cumbersome. The majority of modern OCT systems instead operate in the so-called “frequency domain” or “spectral domain” (SD-OCT) (Figure 3). In this approach, the reference arm remains fixed and instead a spectral interference pattern is collected, in which spectral components of higher frequency correspond to scattering planes at greater depths. In standard SD-OCT systems, a broadband light source is utilized, and the spectral interference pattern created by reflecting sample surfaces is measured using a spectrometer in the detection path.[97–100] The depth scan is recovered by Fourier-transforming the spectrum, eliminating the need for mechanical scanning and resulting in dramatic enhancements in both speed and sensitivity; SD-OCT has been found to be orders of magnitude more sensitive than time-domain approaches.[101–104] In another spectral-domain approach, a point detector is placed in the detection arm and the wavelength of light is instead swept over a large range to create the spectral interferogram. The most developed examples of this technique are optical frequency domain imaging (OFDI)[105] and frequency domain mode-locked OCT (FDML-OCT).[106]
Figure 3.
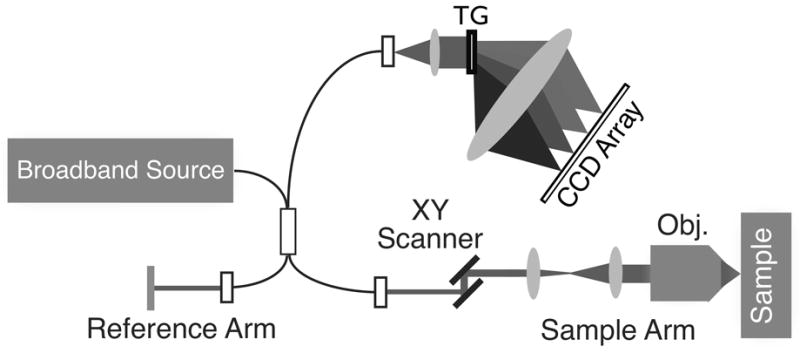
An example SD-OCT system diagram. Light from a broadband source is split into both reference and sample arms using a fiber Michelson interferometer. The returning reflected light from both arms is collected and sent into the interferometer, with the final spectral interferogram recorded using a spectrometer. An XY-scanning system in the sample arm enables raster-scanning over the sample to collect an image volume. TG: transmission grating; Obj.: objective lens. Figure modified with permission from ref. [9].
It is also possible to recover the phase information from the sample reflections, which can be used to glean additional information. For example, the optical phase can be used to visualize blood flow in biological tissue through a technique known as Doppler OCT.[107–109] Phase detection can also reveal small fluctuations in a sample, which can be used, for example, to visualize action potentials[110–112] and cellular structures.[113]
3.3. OCT Applications in Biomedicine
3.3.1. Detection, Diagnosis, and Characterization
The capacity for high-resolution imaging with OCT has enabled tissue- and cellular-level structural analysis both in vitro and ex vivo, revealing, for example, the subcellular structure of human coronary atherosclerosis,[114] the characterization of cellular structural changes in optical neuropathies,[115] and the microanatomy of human organs.[116] It has also been used for the diagnosis and treatment of neurological disorders[117] and abnormal cardiac function,[118] and the detection of transmural inflammation in Crohn’s disease.[119] The capacity of OCT for non-invasive, longitudinal monitoring has enabled its use in applications such as 3D imaging of biofilm development.[120] Additionally, OCT is readily integrated into, and is therefore a natural partner to, other molecular optical imaging modalities such as fluorescence and fluorescence lifetime imaging, enabling simultaneous morphological, biochemical, and molecular characterization of processes from the cellular to the macroscopic tissue level.[121,122] Furthermore, the advent of targeted nanoconstructs enables the use of OCT for the detection of specific cellular phenotypes such as activated endothelial cells[123] and sub-cellular membrane constituents.[124]
3.3.2. Monitoring Processes and Medical Procedures
The ability of OCT to rapidly and non-invasively image at great tissue depths has resulted in its widespread use in a variety of medical applications. Examples include the preclinical optimization, evaluation, and monitoring of surgical techniques such as LASIK eye surgery,[125–127] as well as the monitoring of human cornea grafts and laser incisions.[128] It has also been used to monitor peripheral and sciatic nerve repair in animal models ex vivo,[129] as well as to optimize and develop microneedle drug delivery applications.[130] OCT imaging has also been applied with great success in dermatology, where it has been used to monitor wound reepithelialization,[131] among many other examples.
As OCT can be used to generate cross-sectional images of tissue as well as the underlying architecture, it can be used in a clinical context to detect lesions that might otherwise be invisible to white light endoscopy and visual inspection. One example is in the detection of early stage bladder cancer, in which a microelectromechanical system (MEMS) based deployment of OCT was successfully used to detect preclinical lesions in a cohort of 56 patients.[132] OCT has also been deployed in a spiral-scanning, catheter-based pullback balloon for the detection and diagnosis of Barrett’s esophagus in high-risk patients,[133–135] as well as to visualize and map high-risk atherosclerotic plaques in coronary arteries.[136]
3.3.3. Past Applications of OCT in PDT
In clinical PDT, OCT has been used primarily to monitor PDT treatment efficacy in two main systems: the eye and the vasculature.[137] OCT has long been used in ophthalmology due to its rapid, non-perturbative imaging capabilities. As the numerous layers of the retina reflect light strongly, OCT has proven highly effective in distinguishing retinal tissue architecture with micron resolution.[138] One of the major medical applications of PDT over the past decade has been in treating forms of age-related macular degeneration (AMD), the leading cause of blindness in the developed world.[139] As a quantitative 3D imaging technology, OCT is particularly apt for the diagnosis and monitoring of AMD, which manifests as alterations in retinal structure.[140,141] In several studies, OCT was used to observe the detailed microscale changes following BPD-mediated PDT in human patients, detecting fluid buildup between retinal layers, changes in choroidal neovascularization, and subsequent return to more healthy retinal structure.[140] The sensitivity of OCT to these changes demonstrates its capacity to not only follow but also predict therapeutic response for better PDT therapeutic planning.[142] The use of OCT to monitor changes in tumor-associated vasculature is important for the many PDT regimens that selectively target tumor vasculature. Doppler OCT, an extension of OCT capable of quantitative in vivo blood flow measurements, has proven to be a powerful approach in monitoring PDT-induced vascular shutdown. Using both standard free-space and fiber-imaging approaches, Doppler OCT has been used to effectively visualize blood vessel vasospasm in the minutes following Photofrin PDT, a critical event in the induction of tumor hypoxia for treatment. Recent experiments using two-photon excited PDT have employed Doppler OCT to directly visualize specific blood vessel occlusion in a mouse dorsal window model.[143] These demonstrations show the potential of OCT to directly monitor therapeutic response in situ for better PDT dosimetry and, eventually, improved therapeutic efficacy.
3.4. 3D In Vitro Tumor Model Response
As introduced above, 3D models of cancer can serve as powerful platforms for understanding therapeutic response, heterogeneity, and treatment resistance. Tumor nodules can grow over a period of weeks from small, easily visualized clusters to large, complex tumors with diameters in excess of 1 mm. The large size of these advanced models poses significant challenges to standard microscopy techniques, the penetration depths of which are typically limited to a few hundred micrometers. Light scattering–based approaches such as OCT offer considerable advantages for visualizing these model systems. OCT is a non-perturbative imaging technique that does not require cells to be fixed or stained, thus allowing them to remain viable for long-term, longitudinal imaging of growth, development, and treatment response. Moreover, OCT can rapidly acquire entire three-dimensional volumes in a sample, which is highly advantageous for growth or drug screening applications.
As described by Evans et al.,[34] OCT can be used to visualize the growth and development of model ovarian cancer nodules in vitro. OCT was found to be capable of visualizing the complex growth patterns of nodules over the course of two weeks. For OCT measurements, a broadband Ti:sapphire femtosecond laser with a center wavelength of 850 nm and a bandwidth of 190 nm was used as the light source. The power of the light source at the sample was measured to be 1.5 mW. The speed of OCT imaging was determined by the frequency of a line-scan camera used to acquire the spectral interferograms. For the image in Figure 4, the camera was run at a rate of 20 kHz, which corresponds to a time period of 50 μs per depth scan (A-scan). The two dimensional images in Figure 4 (B-scan), were made by acquiring 2048 sequential A-scans, for a rate of 9.8 xz frames per second. OCT images were calculated using a custom Matlab script that employed eightfold zero padding.
Figure 4.

Natural growth of in vitro ovarian cancer 3D nodules at different growth time points visualized with OCT. The nodules can be seen to enlarge and eventually hollow, with the appearance of numerous highly scattering apoptotic bodies filling the nodule core after three weeks of growth. Figure used with permission from ref. [34].
Early in the growth process, ovarian cancer nodules were found to assume a spherical shape, eventually forming a heterogeneous distribution of nodule sizes after one week of growth. Interestingly, beyond two weeks, nodules were observed to develop a hollow center full of debris that continuously enlarged throughout the remainder of their growth (Figure 4). As can be seen from the figure, nodules rapidly grew to diameters of 300 μm within two weeks, and continued to grow beyond 1 mm in diameter by 45 days of growth. The OCT image contrast was determined to have arisen due to scattering from the individual tumor cells that composed the nodule structure. Moreover, by combining OCT with standard two-photon fluorescence microscopy, the highly scattering debris that had accumulated in the nodule center was determined to be composed of apoptotic cells (Figure 5). This study demonstrated the capability of OCT to not only follow 3D model dynamics but also to differentiate between viable and apoptotic cells in vitro.[34]
Figure 5.
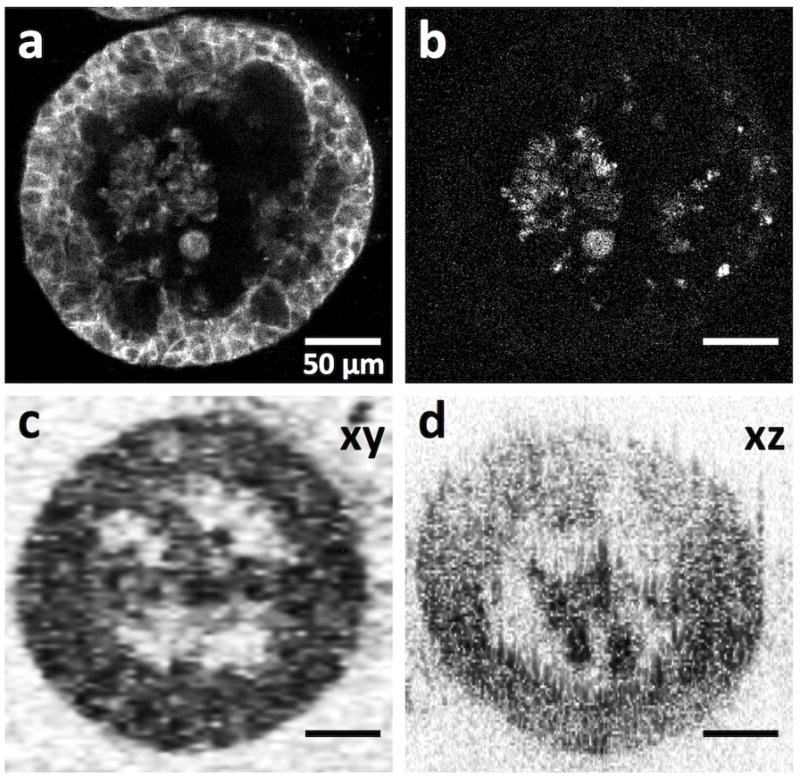
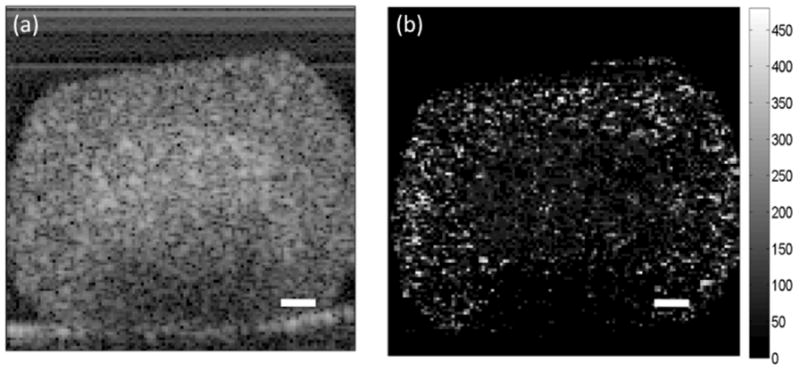
Comparison of confocal fluorescence images and OCT images of ovarian cancer 3D tumor nodules. Confocal fluorescence image of 3D nodules stained for (a) E-cadherin, and (b) activated caspase-3. (c,d) OCT cross-sectional image along the xy and xz planes, respectively. Parts of this figure are reproduced with permission from ref. [34].
The morphological changes caused by cell death have been observed to alter intensity and can therefore be readily visualized using OCT. More specifically, an increase in backscatter can be detected during apoptosis and mitotic arrest, whereas necrosis has been observed to cause a decrease in light scattering.[144,145] These observations agree with the result of histological examination and can be linked to differences in structural changes that cells undergo during different modes of cell death.
These observations have been confirmed in a more recent study in which multicellular tumor spheroids were imaged in vitro with OCT using concepts taken from dynamic light scattering.[146] Increased backscatter intensity was observed in the core of the spheroid (Figure 6) and was presumed to be an early sign of cell death, consistent with the increase in backscatter associated with apoptosis.
Figure 6.
OCT cross-sectional images of an HT-29 spheroid. (a) Increased backscatter intensity is observed in the core of the spheroid. (b) Parametric image of decorrelation time for the spheroid depicted in (a). Shorter decorrelation times in the core of the spheroid correspond with the regions of higher backscatter intensity. The scale bars represent 100 μm. Reproduced with permission from ref. [145].
It should be noted that the changes in scattering observed in these studies were found under controlled settings using carefully constructed in vitro model systems. While the controlled nature of models can provide unique insight into therapeutic response mechanisms, tissue and cellular changes posttreatment are always more complex in vivo. Numerous factors can lead to changes in scattering in complex living systems that may be entirely unrelated to apoptosis. Natural biological processes can also obscure the detection of therapeutic changes, such as phagocytosis of apoptotic bodies by macrophages. Still, the ability to detect structural changes associated with different modes of cell death in vitro[145,146] has significant implications for cancer treatment as well as for the assessment of therapeutic response.
4. Time-Lapse OCT of PDT
4.1. Time-Lapse OCT
Time-lapse OCT (TL-OCT) is a variant of the standard OCT approach that allows for continuous visualization of structural changes within a sample over the course of hours, days, and even weeks. Like traditional time-lapse light and fluorescence microscopes, TL-OCT systems are designed to operate for prolonged periods of time while running preprogrammed image capture routines that generate volumetric time series datasets. As opposed to episodic imaging, TL-OCT systems incorporate stable light sources and detectors that are utilized along with low-drift optomechanics to ensure minimal optical changes over the course of many days.
Longitudinal episodic OCT imaging has been carried out in the past, with images acquired using a variety of methods. One of the best recent examples of episodic OCT treatment response imaging was the visualization of blood vessel normalization in a murine model of glioblastoma following vascular endothelial growth factor blockade therapy in vivo.[147] In this work, the microscale alterations in blood vessel size, shape, and quantity were followed using a dorsal skin imaged using Dopler OFDI. The OCT system was powered up for each session, during which imaging was carried out manually. Despite a spatial locking mechanism to hold the tissue in place, the composition of the final longitudinal movie required careful manual pixel-by-pixel registration to map the sequential OCT frames.[147]
TL-OCT seeks to avoid OCT system power cycling, manual imaging, and manual registration through an always-on, programmable acquisition system. This is especially important for the visualization of therapeutic response, where the limitations of manual, episodic imaging can result in missing rare events that are crucial to understanding treatment dynamics. Moreover, when used with high-resolution motorized stages for in vitro imaging applications, TL-OCT systems can be used in conjunction with multiwell plates and chambers for simultaneous, multiplexed experiments, allowing the structural evolution of multiple samples to be followed over time. Live imaging can be accomplished through the use of standard microincubation chambers or sealed incubation enclosures that maintain sterile cellular culture conditions. This is of prime importance for carrying out high-throughput, high-content screening of drugs and drug combinations in vitro, where spatiotemporal treatment response features can be monitored for therapeutic screening without the use of labels or other perturbation-inducing methods. Importantly, TL-OCT volumetric movies can be mined and quantified using robust image analysis tools for quantitative, real-time therapeutic analysis.
Time-lapse approaches also offer additional advantages. Instead of a static image, TL-OCT presents the full structural evolution of a sample as a function of time. The increased OCT signal caused by apoptosis[148] can be recognized by TL-OCT and TL-OCT processing algorithms more readily than by conventional OCT, because the appearance and evolution of apoptotic bodies can be comparatively tracked over time. Time-lapse frame averaging can additionally be used to reduce speckle noise and improve imaging resolution for better analysis of cellular features.[149] Finally, TL-OCT systems can be readily integrated into fluorescence, confocal, and multiphoton systems for combined structural and molecular imaging.[34]
4.2. TL-OCT of 3D In Vitro Model Systems: Growth and Treatment Response
TL-OCT is ideal for continuous monitoring of the structural dynamics of biological processes. A good example of this capability is the study tracking the growth and development of the 3D ovarian cancer tumors described in Section 3.4. While nodular hollowing can be imaged using approaches such as fluorescence imaging and OCT, the exact nature of the structural and cellular evolution can only be inferred from these static, episodic imaging approaches. To track how hollowing occurred and discover the origin of the apoptotic cells filling the lumens of the nodules, a TL-OCT session was run over the course of days, using an incubation chamber to maintain optimal growth conditions. Through the use of continuous, longitudinal monitoring, TL-OCT revealed that the hollowing process began through a combination of nodule growth and cellular migration away from the nodule core. Interestingly, after the hollow center had formed, TL-OCT showed numerous cells being shed from the interior nodule wall and collecting at the bottom of the luminal center. These shedded cellular bodies were observed to give rise to stronger scattering than normal cells, indicating apoptosis. Another interesting finding from this experiment was the observation of nodule merging, where two tumors migrated together to form a single nodule. Without the continuous imaging provided by TL-OCT, this rare event would likely have been missed.[34]
TL-OCT imaging has been particularly useful for following the complex structural dynamics that occur both during and after therapeutic intervention. Despite recent advances in quantitative microscale evaluation of therapeutic efficacy, many methods can be used only as experimental endpoints, and do not allow for continuous observation of cell death. For example, Hasan and colleagues recently created a high-content 3D model-based approach to evaluate therapeutic response in vitro using a modified version of the live/dead assay.[35] In this assay, viable cells show green fluorescence from cleaved calcein green AM dye, whereas dead cells stained by ethidium homodimer-1 appear as red. Figure 7 shows four in vitro ovarian cancer cultures subjected to this assay, with three panels showing the spatial cell killing patterns triggered by treatment with carboplatin chemotherapy, BPD-PDT, and EtNBS-PDT (Figure 7b, c, d, respectively). In spite of its usefulness, the live/dead assay is only capable of providing a static picture of the cancer cellular population, as the assay itself irreversibly perturbs growing cultures. TL-OCT, on the other hand, enables label-free, long-term visualization to track the full three-dimensional therapeutic response. When combined, these two complementary approaches provide a far more complete picture of the complex treatment response in model tumors.
Figure 7.
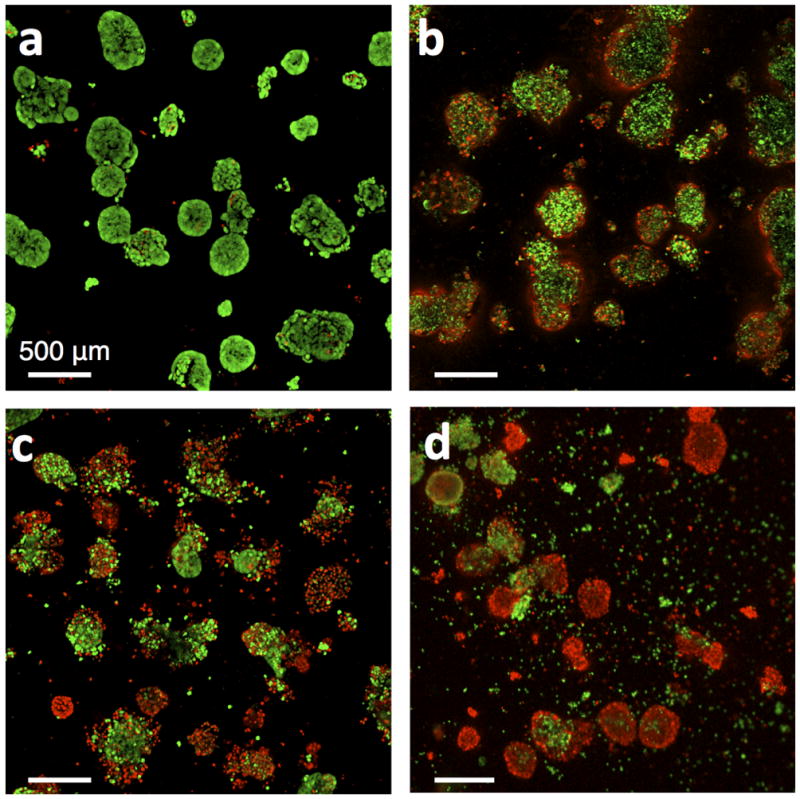
Live/dead fluorescence image of ovarian cancer nodules after treatment with various chemotherapeutics and PDT photosensitizers. Green fluorescence is from cleaved calcein green AM and indicates viable cells. Red fluorescence is from ethidium homodimer-1 and indicates dead cells. (a) Live/dead images of nodules after no treatment, (b) carboplatin treatment, (c), BPD-PDT treatment with 10 J/cm2, and (d) EtNBS-PDT treatment with 20 J/cm2. Reproduced with permission from ref. [37].
4.2.1. Chemotherapeutic Response
Figure 7b shows the pattern of cytotoxicity in ovarian cancer nodules resulting from three continuous days of treatment with carboplatin, a front-line agent for the treatment of ovarian cancer.[150] Platin drugs impart cytotoxicity by causing breaks in the DNA of cells that can eventually lead to cell death. The lack of effective therapy observed in the core of the tumor nodules is striking. These tumor regions, which have been found to be both hypoxic and acidic,[37] are known to be resistant to many therapeutic interventions, possibly due to the induction of a series of cellular defense mechanisms stimulated by the hypoxia-inducible transcription factor 1 (HIF-1).[151]
To better understand the nature of this treatment response, TL-OCT was used to investigate the therapeutic response of ovarian cancer nodules to the similar front-line platin drug cisplatin (Figure 8).[34] For long-term TL-OCT imaging, a superluminescent diode array with a center wavelength of 890 nm (90 nm bandwidth) was used as the light source. Superluminescent diodes were chosen for their long-term stability, and demonstrated both excellent spectral and power stability for TL-OCT experiments lasting four days or more. The camera was operated at line rates between 1.67 and 3.33 kHz, which corresponded to imaging speeds of 0.81 to 1.63 B-scans/s (Figure 8, 9, 10). Final TL-OCT movies were created using a custom Matlab script, with two sequential B-scans averaged together during postprocessing to reduce noise.
Figure 8.
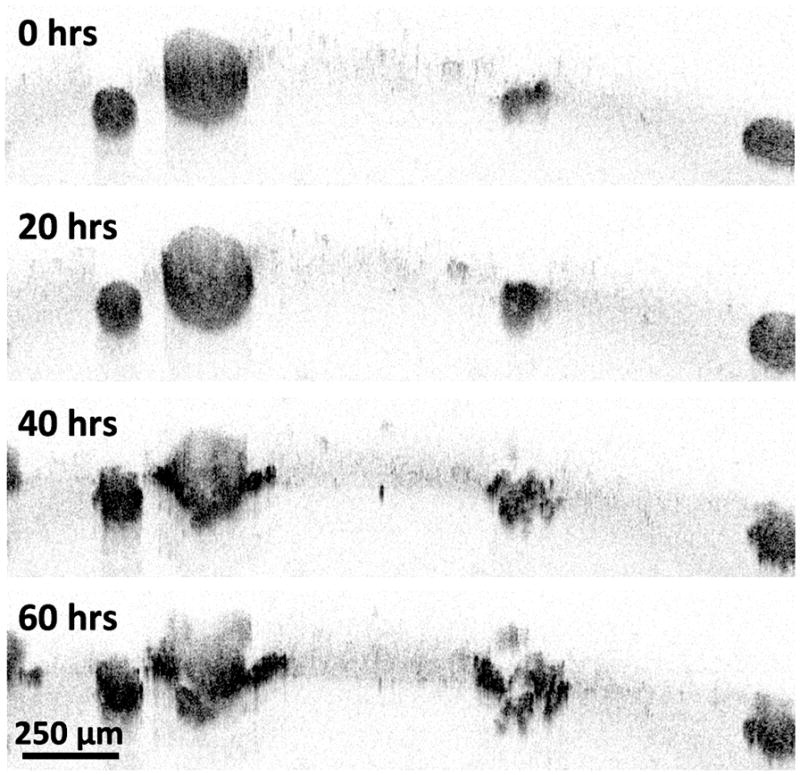
TL-OCT images of nodules at various time points following cisplatin treatment. Volumetric images were taken every 30 minutes. OCT images at time points of 0, 20, 40, and 60 hours are shown. Adapted, with permission, from a movie in ref. [34].
Figure 9.

TL-OCT images of 3D nodules treated with BPD-PDT. Images were taken for 60 hours. Nodules in (a) and (b) were grown for 10 days and 13 days before treatment, respectively. Part of this figure was used with permission from ref. [154].
Figure 10.

TL-OCT images of nodules treated with EtNBS-PDT. The three nodules in the figure are over 300 μm in diameter. Volumetric images were taken every 30 minutes. OCT images at time points of 0, 4, 12, 24 hours are shown. Reproduced with permission from ref. [37].
In the TL-OCT movie, ovarian nodules were initially observed to display growth arrest, with no significant structural changes observed during the first 20 hours of post-treatment. After one day of therapy, only small vacuoles could be seen appearing in the tumor structures. However, after 40 hours of post-treatment, most large (>200 μm in diameter) nodules exhibited substantial damage in their peripheral regions, with smaller nodules being destroyed completely. By 60 hours posttreatment, the peripheral damage to the larger nodules was far more severe, with small nodules disintegrating into multiple smaller fragments. When the time-lapse imaged sample was subsequently stained using the live/dead assay, the largest nodules were revealed to have surviving cores, a result which closely matches the data shown in Figure 7b.
This experiment demonstrated the ability of TL-OCT to not only continuously follow treatment response dynamics in vitro, but also to visualize cellular populations that evade front-line therapy. This unresponsive behavior captured in the TL-OCT movie is likely indicative of similar treatment resistance mechanisms occurring in patients. In this case, it is thought that core cells evade therapy due to the poor penetration of platin agents into the nodule center.[152]
4.2.2. Treatment Response to BPD-PDT
Because it is capable of rapidly screening in vitro tumor nodules in a high-throughput, high-content manner, TL-OCT offers a unique platform for generating datasets suitable for more sophisticated image analysis. For example, TL-OCT can be used to measure the size dependence of therapeutic response in 3D nodules, which is of considerable interest to clinicians and researchers alike. When treating 3D ovarian cancer models with BPD-PDT, it was observed that nodule core cells were largely unresponsive to therapy (Figure 7c), similar to what was found using platin treatment regimens. While complete cellular killing was observed in small nodules (<250 μm in diameter), most large nodules showed cellular death only in their periphery.
To understand the size-dependent response of nodules upon BPD-PDT treatment, TL-OCT was used to track in vitro ovarian cancer tumors treated at ten days[153] (Figure 9a) or thirteen days (Figure 9b) post-plating. As they were given greater time to grow and develop, nodules at day 13 were approximately 1.5 to 2 times larger than those at day 10. Within the first 12 hours, the smaller day 10 nodules were observed to undergo rapid structural degradation along with the appearance of numerous highly scattering apoptotic bodies throughout the tumor structure. Though there was surviving cellular mass left behind, regrowth of the treated tumors was slow, with few structural changes observed after two days. In contrast, the larger day 13 nodules treated with BPD-PDT showed only peripheral structural changes, with apoptosis restricted to only the outermost cell layers. Moreover, these large nodules continued to grow unabated despite treatment. This large difference in treatment response led to a study to investigate BPD treatment in the model tumors, with shallow penetration of BPD into the tumor determined to be a dominant factor in the observed poor response of large nodules. It is also likely that the inefficiency of BPD-PDT was related to the hypoxic environment in the cores of the larger nodules, which deprived the type II PS BPD of the oxygen necessary to induce cytotoxicity.[37]
4.2.3. Treatment Response to EtNBS-PDT
In contrast to BPD and many other PSs, EtNBS exerts its cytotoxicity through both oxygen-dependent (type II) and oxygen-independent (type I) mechanisms, making it effective even in anoxic environments. Importantly, EtNBS has been found to selectively accumulate in the hypoxic, acidic, hard-to-treat cores of 3D in vitro ovarian cancer nodules.[37,44] As can be seen in Figure 7d, EtNBS-PDT is capable of imparting substantial cytotoxicity throughout the entire tumor nodule.
TL-OCT imaging of these large micrometastatic nodules was able to provide detailed insight into the complex nature of the structural degradation caused by EtNBS-PDT. Figure 10 shows the response of large ovarian cancer nodules (>300 μm in diameter) to EtNBS-PDT. In contrast to the peripheral killing patterns observed with cisplatin and BPD-PDT post-treatment, TL-OCT revealed that with EtNBS-PDT, nodules are destroyed from the inside out. Between four and twelve hours posttreatment, the nodule core was observed to inflate, filling with numerous dark scattering bodies thought to be apoptotic cells. While cells on the nodule periphery initially remained structurally intact, by eight hours peripheral cells began to apoptose. At the end of 24 hours, the large ovarian cancer nodules had undergone complete structural degradation, with highly scattering apoptotic bodies appearing throughout the nodules and apoptotic and dying cells spilling out from the nodule structure.
As these examples show, TL-OCT is capable of monitoring structural changes and apoptosis in response to a variety of drugs and treatment regimens in 3D nodular ovarian cancer models. It is worth noting that many of these loose dead cells created following therapy may be dispersed or aspirated during the washing and staining steps required for fluorescence-based assays, but are visualized unperturbed when using TL-OCT.
5. Summary and Outlook
By offering rapid, perturbation-free, volumetric imaging capable of following both cellular- and nodular-level photodynamic therapy responses, OCT is a natural partner for imaging, understanding, and optimizing PDT. This is especially true for in vitro applications, where the resolution, depth range, scanning speed, and longitudinal capabilities of OCT facilitate new studies that can directly probe therapeutic responses deep inside complex 3D model systems. The studies presented and discussed in this review are only the first steps in utilizing these abilities for the selection and optimization of PDT regimens, with many more exciting opportunities waiting to be explored.
Efforts are underway to expand the capabilities of OCT by creating a robust image analysis toolkit that can mine high-resolution data for four-dimensional analysis. Specifically, routines must be developed that can identify key cellular and nodular events, and track the evolution of such events over long periods of time. Three-dimensional image segmentation algorithms must be developed to identify and quantify in vitro model factors, including volume, shape, growth rate, scattering intensity, and fragmentation, to name a few. These tools must include the ability to track cellular fate over the entire time-lapse experiment, including cellular migration following treatment. As seen above, the patterns of treatment response are highly dependent on the agent used, its concentration, uptake rate, and localization in tissue. Analysis routines must be developed to track treatment response patterns and make early predictions regarding treatment response. These routines can be applied for real-time analysis during data acquisition. High-throughput, high-content screening applications are likely a future use of OCT and TL-OCT systems, especially when used alongside increasingly relevant in vitro model systems. As mentioned earlier, TL-OCT is entirely compatible with multiwell culture systems where tens or hundreds of separate experiments can be plated and run simultaneously. While current studies investigating tumor response use similar methods, multiplex TL-OCT measurements would allow for the tracking of the natural history of 3D model treatment response for quantitative analysis.
This will be especially important for the optimization of PDT and PDT combination treatment approaches in the future. Combining the precise spatiotemporal knowledge gained through OCT with simultaneously acquired images or measurements of molecular responses would open the door to new intervention strategies. A multiplexed TL-OCT imaging platform combined with automated media collection and analysis, for example, would allow for the exploration and temporal mapping of numerous simultaneous factors to find time periods of peak sensitivity for combination therapeutic regimens.
While this review has focused on the use of OCT in the visualization of in vitro culture systems, there are numerous means of extracting and culturing live tissues ex vivo. Such approaches have several advantages over creating complex in vitro models, most importantly that the tissue of interest can be harvested to preserve the original tissue architecture with its numerous differentiated cell types.[154] These live culture approaches provide an even more biologically relevant ex vivo system than in vitro models, especially for tissues not normally accessible for long-term high-resolution monitoring. OCT and TL-OCT are highly advantageous for imaging and following these large, complex models, especially for monitoring therapy. Tissue engineering experiments and bioreactor work would also benefit from the longitudinal, 3D, non-perturbative imaging capabilities of OCT.
Considerable work has been done in the field of OCT to improve equipment and detection schemes, aiming to boost image resolution and depth in order to obtain more detailed tissue structural information. The TL-OCT system used in the studies described here made use of older SD-OCT configurations optimized to provide long-term stability. Newer OCT technologies have since been developed and commercialized, enabling a new generation of long-term OCT acquisition tools. Swept-source OCT systems have advantages over fixed bandwidth systems, as they offer much improved spectral detection, enabling deeper imaging and oversampling for improved signal-to-noise contrast. Swept-source approaches used to be restricted to low bandwidths and thus had poor (>5 μm) axial imaging resolutions. Newer swept-source light sources can now achieve greater than 100 nm of bandwidth, opening the door for clearer, deeper TL-OCT imaging.
Deeper imaging can also be achieved by moving to longer wavelengths of light that are less attenuated by tissue. OCT systems operating at 1040 nm,[141] 1300 nm,[147] and now 1700 nm[155] can reach increasingly deeper into biological tissue, though the resolution of some of these systems is still too low for many cellular-level imaging applications. Of great interest for future TL-OCT designs has been the recent creation of highly stable μOCT systems using extremely broadband light for submicron imaging resolutions.[114] Furthermore, integration of advanced Doppler capabilities into TL-OCT will likely aid in the study of therapeutic effects, especially in advanced 3D cultures incorporating artificial vasculature.
A potential downside to OCT is its restriction to structural imaging. Unlike approaches that possess molecular sensitivity, such as multiphoton fluorescence microscopy and photoacoustic tomography, standard OCT systems are restricted to scattering-based contrast only. Several innovations, particularly by Boppart and colleagues,[156] might open the door to functional OCT with molecular sensitivity. Magnetic bead approaches,[157] spectrally-sensitive OCT,[158] and plasmonically-resonant targeted-nanoparticles,[159] are potential methods for enabling molecular sensitivity deep within 3D cultures for improved longitudinal therapeutic monitoring.
Acknowledgments
The authors would like to thank Professor Tayyaba Hasan, Dr. Imran Rizvi, and Professor Jon Celli for their guidance and assistance in the collection of some of the data presented in this review. The authors would also like to acknowledge Nicole Devoe and Sam Patterson for their help editing this manuscript. AJN wishes to acknowledge the National Science Foundation (NSF) Graduate Fellowship and National Defense and Science Engineering Graduate (NDSEG) Fellowship for their support. This work was partially funded by the National Institutes of Health through the NIH Director’s New Innovator Award Program, grant number 1DP2 OD007096-01. Information on the New Innovator Award Program is available at http://nihroadmap.nih.gov/newinnovator/.
Biographies
Yookyung Jung received his BS and MS in physics from Seoul National University in 2002 and 2005, respectively. His MS thesis research involved visualizing the intensity of focused ultrasound using the acousto-optic effect. He received his PhD in physics from Purdue University in 2010, conducting his thesis research with Dr. Ji-Xin Cheng. His main research topic was nonlinear optical imaging of nanomaterials such as gold nanorods, silicon nanowires, and carbon nanotubes. He also observed that the phase of the transient absorption signal from carbon nanotubes could be used to determine its metallicity. Since 2011 he has been conducting research on the quantitative analysis of the therapeutic response of cancer using optical coherence tomography in the Wellman Center for Photomedicine.
Alexander J. Nichols received his BA in biochemistry with highest honors from Oberlin College in 2008, conducting his thesis research with Manish Mehta studying the conformational dynamics of small molecules using solid-state NMR. After graduation, he worked at QDVision Inc., specializing in cadmium-free quantum dot synthesis. In fall 2009 he began his PhD studies, enrolled in both the Harvard Program in Biophysics and the Harvard-MIT Division of Health Sciences and Technology (HST). He currently holds both the NSF Graduate Research Fellowship and the National Defense Science and Engineering Fellowship (NDSEG). His research interests include synthesis of new cell-permeable oxygen sensors and development of optical hypoxia-monitoring systems.
Oliver J. Klein received his Bachelor’s Degree in Biochemistry from Ithaca College in 2010. His undergraduate research focus was the intracellular trafficking of cholesterol and the regulatory involvement of Rab proteins and phospholipase activity. He is currently a research technician II in the Evans’ Group at the Wellman Center for Photomedicine at Massachusetts General Hospital. His research focus is the development and optimization of photo-dynamic therapy agents using 3D in vitro models of resistant disease.
Emmanuel Roussakis received his PhD in synthetic organic chemistry from the University of Crete in Greece in 2006. In 2008 he moved to the United States to work as a postdoctoral research fellow at the University of Pennsylvania’s Perelman School of Medicine, where he participated in the development of phosphorescent, porphyrin-based macromolecular dendritic probes with applications in in vivo two-photon imaging of tissue oxygenation. His current research interests at the Wellman Center include the development of new oxygen-sensitive probes for visualizing tumor hypoxia and monitoring treatment response of tumor models during photodynamic therapy.

Conor L. Evans received his B.S. in chemical physics from Brown University in 2002, and completed his PhD in physical chemistry in 2007 at Harvard University with X. Sunney Xie. Working on coherent anti-Stokes Raman scattering (CARS) microscopy during his doctoral work, he became fascinated in applying advanced imaging approaches for solving critical problems in cancer. Moving to the Wellman Center for Photomedicine at Massachusetts General Hospital, he pursued a translational cancer imaging research program with both Tayyaba Hasan and Johannes de Boer. Now an assistant professor at the Wellman Center for Photomedicine, his current research interests include ovarian cancer, spectroscopic and interferometric imaging technologies, and photodynamic therapy.
References
- 1.Hanahan D, Weinberg RA. Cell. 2000;100:57–70. doi: 10.1016/s0092-8674(00)81683-9. [DOI] [PubMed] [Google Scholar]
- 2.Gillies RJ, Schornack PA, Secomb TW, Raghunand N. Neoplasia. 1999;1:197–207. doi: 10.1038/sj.neo.7900037. [DOI] [PMC free article] [PubMed] [Google Scholar]
- 3.Dougherty TJ, Gomer CJ, Henderson BW, Jori G, Kessel D, Korbelik M, Moan J, Peng Q. J Natl Cancer Inst. 1998;90:889–905. doi: 10.1093/jnci/90.12.889. [DOI] [PMC free article] [PubMed] [Google Scholar]
- 4.Dolmans DE, Fukumura D, Jain RK. Nat Rev Cancer. 2003;3:380–387. doi: 10.1038/nrc1071. [DOI] [PubMed] [Google Scholar]
- 5.Castano AP, Mroz P, Hamblin MR. Nat Rev Cancer. 2006;6:535–545. doi: 10.1038/nrc1894. [DOI] [PMC free article] [PubMed] [Google Scholar]
- 6.Preise D, Mazor O, Koudinova N, Liscovitch M, Scherz A, Salomon Y. Neoplasia. 2003;5:475–480. doi: 10.1016/s1476-5586(03)80031-3. [DOI] [PMC free article] [PubMed] [Google Scholar]
- 7.Teiten MH, Bezdetnaya L, Merlin JL, Bour-Dill C, Pauly ME, Dicato M, Guillemin F. J Photochem Photobiol, B. 2001;62:146–152. doi: 10.1016/s1011-1344(01)00178-6. [DOI] [PubMed] [Google Scholar]
- 8.Canti G, Lattuada D, Morelli S, Nicolin A, Cubeddu R, Taroni P, Valentini G. Cancer Lett. 1995;93:255–259. doi: 10.1016/0304-3835(95)03818-h. [DOI] [PubMed] [Google Scholar]
- 9.Celli J, Spring B, Rizvi I, Evans C, Samkoe K, Verma S, Pogue B, Hasan T. Chem Rev. 2010;110:2795–2838. doi: 10.1021/cr900300p. [DOI] [PMC free article] [PubMed] [Google Scholar]
- 10.Pautler RG, Fraser SE. Curr Opin Immunol. 2003;15:385–392. doi: 10.1016/s0952-7915(03)00073-6. [DOI] [PubMed] [Google Scholar]
- 11.Rajadhyaksha M, GonzQlez S, Zavislan J, Anderson R, Webb R. J Invest Dermatol. 1999;113:293–303. doi: 10.1046/j.1523-1747.1999.00690.x. [DOI] [PubMed] [Google Scholar]
- 12.Evans CL, Xie XS. Annu Rev Anal Chem. 2008;1:883–909. doi: 10.1146/annurev.anchem.1.031207.112754. [DOI] [PubMed] [Google Scholar]
- 13.Freudiger CW, Min W, Saar BG, Lu S, Holtom GR, He C, Tsai JC, Kang JX, Xie XS. Science. 2008;322:1857–1861. doi: 10.1126/science.1165758. [DOI] [PMC free article] [PubMed] [Google Scholar]
- 14.Pawley J, editor. Handbook of Biological Confocal Microscopy. 3. Springer; New York: 2006. [Google Scholar]
- 15.Zipfel WR. Proc Natl Acad Sci USA. 2003;100:7075–7080. doi: 10.1073/pnas.0832308100. [DOI] [PMC free article] [PubMed] [Google Scholar]
- 16.Skala MC, Riching KM, Gendron-Fitzpatrick A, Eickhoff J, Eliceiri KW, White JG, Ramanujam N. Proc Natl Acad Sci USA. 2007;104:19494–19499. doi: 10.1073/pnas.0708425104. [DOI] [PMC free article] [PubMed] [Google Scholar]
- 17.Bird DK, Yan L, Vrotsos KM, Eliceiri KW, Vaughan EM, Keely PJ, White JG, Ramanujam N. Cancer Res. 2005;65:8766–8773. doi: 10.1158/0008-5472.CAN-04-3922. [DOI] [PubMed] [Google Scholar]
- 18.Tsien RY. Annu Rev Biochem. 1998;67:509–544. doi: 10.1146/annurev.biochem.67.1.509. [DOI] [PubMed] [Google Scholar]
- 19.Shaner NC, Steinbach PA, Tsien RY. Nat Methods. 2005;2:905–909. doi: 10.1038/nmeth819. [DOI] [PubMed] [Google Scholar]
- 20.Hoffman RM. Nat Rev Cancer. 2005;5:796–806. doi: 10.1038/nrc1717. [DOI] [PubMed] [Google Scholar]
- 21.Gross S, Piwnica-Worms D. Cancer Cell. 2005;7:5–15. doi: 10.1016/j.ccr.2004.12.011. [DOI] [PubMed] [Google Scholar]
- 22.Chang SK, Rizvi I, Solban N, Hasan T. Clin Cancer Res. 2008;14:4146–4153. doi: 10.1158/1078-0432.CCR-07-4536. [DOI] [PMC free article] [PubMed] [Google Scholar]
- 23.Saar BG, Freudiger CW, Reichman J, Stanley CM, Holtom GR, Xie XS. Science. 2010;330:1368–1370. doi: 10.1126/science.1197236. [DOI] [PMC free article] [PubMed] [Google Scholar]
- 24.Wright AJ, Poland SP, Girkin JM, Freudiger CW, Evans CL, Xie XS. Opt Express. 2007;15:18209–18219. doi: 10.1364/oe.15.018209. [DOI] [PubMed] [Google Scholar]
- 25.Mueller-Klieser W. Am J Physiol. 1997;273:C1109–1123. doi: 10.1152/ajpcell.1997.273.4.C1109. [DOI] [PubMed] [Google Scholar]
- 26.Radisky DC, Bissell MJ. Science. 2004;303:775–777. doi: 10.1126/science.1094412. [DOI] [PubMed] [Google Scholar]
- 27.Lee GY, Kenny PA, Lee EH, Bissell MJ. Nat Methods. 2007;4:359–365. doi: 10.1038/nmeth1015. [DOI] [PMC free article] [PubMed] [Google Scholar]
- 28.Wang F, Hansen RK, Radisky D, Yoneda T, Barcellos-Hoff MH, Petersen OW, Turley EA, Bissell MJ. J Natl Cancer Inst. 2002;94:1494–1503. doi: 10.1093/jnci/94.19.1494. [DOI] [PMC free article] [PubMed] [Google Scholar]
- 29.Roskelley CD, Desprez PY, Bissell MJ. Proc Natl Acad Sci USA. 1994;91:12378–12382. doi: 10.1073/pnas.91.26.12378. [DOI] [PMC free article] [PubMed] [Google Scholar]
- 30.Weaver VM, Petersen OW, Wang F, Larabell CA, Briand P, Damsky C, Bissell MJ. J Cell Biol. 1997;137:231–245. doi: 10.1083/jcb.137.1.231. [DOI] [PMC free article] [PubMed] [Google Scholar]
- 31.Muthuswamy SK, Li D, Lelievre S, Bissell MJ, Brugge JS. Nat Cell Biol. 2001;3:785–792. doi: 10.1038/ncb0901-785. [DOI] [PMC free article] [PubMed] [Google Scholar]
- 32.Yuhas JM, Tarleton AE, Harman JG. Cancer Res. 1978;38:3595–3598. [PubMed] [Google Scholar]
- 33.Kunz-Schughart LA, Freyer JP, Hofstaedter F, Ebner R. J Biomol Screening. 2004;9:273–285. doi: 10.1177/1087057104265040. [DOI] [PubMed] [Google Scholar]
- 34.Evans CL, Rizvi I, Hasan T, de Boer JF. Opt Express. 2009;17:8892–8906. doi: 10.1364/oe.17.008892. [DOI] [PMC free article] [PubMed] [Google Scholar]
- 35.Celli J, Rizvi I, Evans CL, Abu-Yousift A, Hasan T. J Biomed Opt. 2010;15:051603. doi: 10.1117/1.3483903. [DOI] [PMC free article] [PubMed] [Google Scholar]
- 36.Rizvi I, Celli JP, Evans CL, Abu-Yousif AO, Muzikansky A, Pogue BW, Finkelstein D, Hasan T. Cancer Res. 2010;70:9319–9328. doi: 10.1158/0008-5472.CAN-10-1783. [DOI] [PMC free article] [PubMed] [Google Scholar]
- 37.Evans CL, Abu-Yousif AO, Park YJ, Klein OJ, Celli JP, Rizvi I, Zheng X, Hasan T. PLoS One. 2011;6:e23434. doi: 10.1371/journal.pone.0023434. [DOI] [PMC free article] [PubMed] [Google Scholar]
- 38.Petersen OW, Rønnov-Jessen L, Howlett AR, Bissell MJ. Proc Natl Acad Sci USA. 1992;89:9064–9068. doi: 10.1073/pnas.89.19.9064. [DOI] [PMC free article] [PubMed] [Google Scholar]
- 39.Abu-Yousif AO, Rizvi I, Evans CL, Celli JP, Hasan T. J Visualized Exp. 2009;34:1692. doi: 10.3791/1692. [DOI] [PMC free article] [PubMed] [Google Scholar]
- 40.Xu F, Celli J, Rizvi I, Moon S, Hasan T, Demirci U. Biotechnol J. 2011;6:204–212. doi: 10.1002/biot.201000340. [DOI] [PMC free article] [PubMed] [Google Scholar]
- 41.Nçr JE, Christensen J, Mooney DJ, Polverini PJ. Am J Pathol. 1999;154:375–384. doi: 10.1016/S0002-9440(10)65284-4. [DOI] [PMC free article] [PubMed] [Google Scholar]
- 42.Peters MC, Polverini PJ, Mooney DJ. J Biomed Mater Res. 2002;60:668–678. doi: 10.1002/jbm.10134. [DOI] [PubMed] [Google Scholar]
- 43.Rizvi I, Celli JP, Evans CL, Abu-Yousif AO, Muzikansky A, Pogue BW, Finkelstein D, Hasan T. Cancer Res. 2010;70:9319–9328. doi: 10.1158/0008-5472.CAN-10-1783. [DOI] [PMC free article] [PubMed] [Google Scholar]
- 44.Klein OJ, Bhayana B, Park YJ, Evans CL. sbumitted. [Google Scholar]
- 45.Fu Y, Wang H, Shi R, Cheng J-X. Opt Express. 2006;14:3942–3951. doi: 10.1364/oe.14.003942. [DOI] [PubMed] [Google Scholar]
- 46.Agostinis P, Berg K, Cengel KA, Foster TH, Girotti AW, Gollnick SO, Hahn SM, Hamblin MR, Juzeniene A, Kessel D, Korbelik M, Moan J, Mroz P, Nowis D, Piette J, Wilson BC, Golab J. Ca-Cancer J Clin. 2011;61:250–281. doi: 10.3322/caac.20114. [DOI] [PMC free article] [PubMed] [Google Scholar]
- 47.Reiners JJ, Jr, Agostinis P, Berg K, Oleinick NL, Kessel D. Autophagy. 2010;6:7–18. doi: 10.4161/auto.6.1.10220. [DOI] [PMC free article] [PubMed] [Google Scholar]
- 48.Andrzejak M, Price M, Kessel DH. Autophagy. 2011;7:979–984. doi: 10.4161/auto.7.9.15865. [DOI] [PMC free article] [PubMed] [Google Scholar]
- 49.Moan J. J Photochem Photobiol, B. 1990;6:343–344. [Google Scholar]
- 50.Castano AP, Demidova TN, Hamblin MR. Photodiagn Photodyn Ther. 2004;1:279–293. doi: 10.1016/S1572-1000(05)00007-4. [DOI] [PMC free article] [PubMed] [Google Scholar]
- 51.Runnels J, Chen N, Ortel B, Kato D, Hasan T. Br J Cancer. 1999;80:946–953. doi: 10.1038/sj.bjc.6690448. [DOI] [PMC free article] [PubMed] [Google Scholar]
- 52.Granville D, Jiang H, An M, Levy J, McManus B, Hunt D. Br J Cancer. 1999;79:95–100. doi: 10.1038/sj.bjc.6690017. [DOI] [PMC free article] [PubMed] [Google Scholar]
- 53.Granville DJ, Levy JG, Hunt D. Cell Death Differ. 1997;4:623–628. doi: 10.1038/sj.cdd.4400286. [DOI] [PubMed] [Google Scholar]
- 54.Belzacq AS, Jacotot E, Vieira HLA, Mistro D, Granville DJ, Xie Z, Reed JC, Kroemer G, Brenner C. Cancer Res. 2001;61:1260–1264. [PubMed] [Google Scholar]
- 55.Granville D, Ruehlmann D, Choy J, Cassidy B, Hunt D, Breemen C, McManus B. Cell Calcium. 2001;30:343–350. doi: 10.1054/ceca.2001.0243. [DOI] [PubMed] [Google Scholar]
- 56.Kessel D, Castelli M. Photochem Photobiol. 2001;74:318–322. doi: 10.1562/0031-8655(2001)074<0318:etbitt>2.0.co;2. [DOI] [PubMed] [Google Scholar]
- 57.Cincotta L, Foley JW, MacEachern T, Lampros E, Cincotta AH. Cancer Res. 1994;54:1249–1258. [PubMed] [Google Scholar]
- 58.Reiners JJ, Jr, Caruso JA, Mathieu P, Chelladurai B, Yin XM, Kessel D. Cell Death Differ. 2002;9:934–944. doi: 10.1038/sj.cdd.4401048. [DOI] [PMC free article] [PubMed] [Google Scholar]
- 59.Kessel D, Luo Y, Mathieu P, Reiners JJ., Jr Photochem Photobiol. 2000;71:196–200. doi: 10.1562/0031-8655(2000)071<0196:dotart>2.0.co;2. [DOI] [PubMed] [Google Scholar]
- 60.Buytaert E, Callewaert G, Hendrickx N, Scorrano L, Hartmann D, Missiaen L, Vandenheede JR, Heirman I, Grooten J, Agostinis P. FASEB J. 2006;20:756–758. doi: 10.1096/fj.05-4305fje. [DOI] [PubMed] [Google Scholar]
- 61.Teiten M, Bezdetnaya L, Morliere P, Santus R, Guillemin F. Br J Cancer. 2003;88:146–152. doi: 10.1038/sj.bjc.6600664. [DOI] [PMC free article] [PubMed] [Google Scholar]
- 62.Marchal S, François A, Dumas D, Guillemin F, Bezdetnaya L. Br J Cancer. 2007;96:944–951. doi: 10.1038/sj.bjc.6603631. [DOI] [PMC free article] [PubMed] [Google Scholar]
- 63.Georgakoudi I, Foster TH. Photochem Photobiol. 1998;68:115–122. [PubMed] [Google Scholar]
- 64.Mellish KJ, Cox RD, Vernon DI, Griffiths J, Brown SB. Photochem Photobiol. 2002;75:392–397. doi: 10.1562/0031-8655(2002)075<0392:ivpaoa>2.0.co;2. [DOI] [PubMed] [Google Scholar]
- 65.Lo PC, Chen J, Stefflova K, Warren MS, Navab R, Bandarchi B, Mullins S, Tsao M, Cheng JD, Zheng G. J Med Chem. 2008;52:358–368. doi: 10.1021/jm801052f. [DOI] [PMC free article] [PubMed] [Google Scholar]
- 66.Duska LR, Hamblin MR, Bamberg MP, Hasan T. Br J Cancer. 1997;75:837–844. doi: 10.1038/bjc.1997.149. [DOI] [PMC free article] [PubMed] [Google Scholar]
- 67.Mitsunaga M, Ogawa M, Kosaka N, Rosenblum LT, Choyke PL, Kobayashi H. Nat Med. 2011;17:1685–1691. doi: 10.1038/nm.2554. [DOI] [PMC free article] [PubMed] [Google Scholar]
- 68.Berg K, Kristian Selbo P, Prasmickaite L, Tjelle TE, Sandvig K, Moan J, Gaudernack G, Fodstad Ø, Kjølsrud S, Anholt H, Rodal GH, Rodal SK, Hogset A. Cancer Res. 1999;59:1180–1183. [PubMed] [Google Scholar]
- 69.Schneider R, Tirand L, Frochot C, Vanderesse R, Thomas N, Gravier J, Guillemin F, Barberi-Heyob M. Anti-Cancer Agents Med Chem. 2006;6:469–488. doi: 10.2174/187152006778226503. [DOI] [PubMed] [Google Scholar]
- 70.Drexler W, Morgner U, Kärtner F, Pitris C, Boppart S, Li X, Ippen E, Fujimoto J. Opt Lett. 1999;24:1221–1223. doi: 10.1364/ol.24.001221. [DOI] [PubMed] [Google Scholar]
- 71.Zysk AM, Nguyen FT, Oldenburg AL, Marks DL, Boppart SA. J Biomed Opt. 2007;12:051403. doi: 10.1117/1.2793736. [DOI] [PubMed] [Google Scholar]
- 72.Huang D, Swanson EA, Lin CP, Schuman JS, Stinson WG, Chang W, Hee MR, Flotte T, Gregory K, Puliafito CA. Science. 1991;254:1178–1181. doi: 10.1126/science.1957169. [DOI] [PMC free article] [PubMed] [Google Scholar]
- 73.Busetti A, Soncin M, Jori G, Rodgers M. Br J Cancer. 1999;79:821–824. doi: 10.1038/sj.bjc.6690131. [DOI] [PMC free article] [PubMed] [Google Scholar]
- 74.Povazay B, Bizheva K, Unterhuber A, Hermann B, Sattmann H, Fercher AF, Drexler W, Apolonski A, Wadsworth W, Knight J. Opt Lett. 2002;27:1800–1802. doi: 10.1364/ol.27.001800. [DOI] [PubMed] [Google Scholar]
- 75.Fujimoto JG. Nat Biotechnol. 2003;21:1361–1367. doi: 10.1038/nbt892. [DOI] [PubMed] [Google Scholar]
- 76.Nassif N, Cense B, Hyle Park B, Yun S, Chen T, Bouma B, Tearney G, de Boer J. Opt Lett. 2004;29:480–482. doi: 10.1364/ol.29.000480. [DOI] [PubMed] [Google Scholar]
- 77.Cense B, Nassif N, Chen T, Pierce M, Yun S, Park B, Bouma B, Tearney G, de Boer J. Opt Express. 2004;12:2435–2447. doi: 10.1364/opex.12.002435. [DOI] [PubMed] [Google Scholar]
- 78.Jang IK, Bouma BE, Kang DH, Park SJ, Park SW, Seung KB, Choi KB, Shishkov M, Schlendorf K, Pomerantsev E. J Am Coll Cardiol. 2002;39:604–609. doi: 10.1016/s0735-1097(01)01799-5. [DOI] [PubMed] [Google Scholar]
- 79.Poneros JM, Brand S, Bouma BE, Tearney GJ, Compton CC, Nishioka NS. Gastroenterology. 2001;120:7–12. doi: 10.1053/gast.2001.20911. [DOI] [PubMed] [Google Scholar]
- 80.Bouma BE, Tearney GJ, Compton CC, Nishioka NS. Gastrointest Endosc. 1999;49:AB152. doi: 10.1016/s0016-5107(00)70449-4. [DOI] [PubMed] [Google Scholar]
- 81.De Boer J, Srinivas S, Malekafzali A, Chen ZP, Nelson J. Opt Express. 1998;3:212–218. doi: 10.1364/oe.3.000212. [DOI] [PubMed] [Google Scholar]
- 82.Park BH, Saxer C, Srinivas SM, Nelson JS, de Boer JF. J Biomed Opt. 2001;6:474–479. doi: 10.1117/1.1413208. [DOI] [PubMed] [Google Scholar]
- 83.Fercher AF. Z Med Phys. 2010;20:251–276. doi: 10.1016/j.zemedi.2009.11.002. [DOI] [PubMed] [Google Scholar]
- 84.Saidi IS, Jacques SL, Tittel FK. Appl Opt. 1995;34:7410–7418. doi: 10.1364/AO.34.007410. [DOI] [PubMed] [Google Scholar]
- 85.Popp AK, Valentine MT, Kaplan PD, Weitz DA. Appl Opt. 2003;42:2871–2880. doi: 10.1364/ao.42.002871. [DOI] [PubMed] [Google Scholar]
- 86.Mourant JR, Freyer JP, Hielscher AH, Eick AA, Shen D, Johnson TM. Appl Opt. 1998;37:3586–3593. doi: 10.1364/ao.37.003586. [DOI] [PubMed] [Google Scholar]
- 87.Kumar V, Abbas AK, Aster JC, Fausto N. Robbins and Cotran Pathologic Basis of Disease. 8. Saunders; Philadelphia, USA: 2010. [Google Scholar]
- 88.Boone CW, Stoner GD, Bacus JV, Kagan V, Morse MA, Kelloff GJ, Bacus JW. Cancer Epidemiol, Biomarkers Prev. 2000;9:495–500. [PubMed] [Google Scholar]
- 89.Backman V, Wallace MB, Perelman LT, Arendt JT, Gurjar R, M4ller MG, Zhang Q, Zonios G, Kline E, McGilligan JA, Shapshay S, Valdez T, Badizadegan K, Crawford JM, Fitzmaurice M, Kabani S, Levin HS, Seiler M, Dasari RR, Itzkan I, Van Dam J, Feld MS, McGillican T. Nature. 2000;406:35–36. doi: 10.1038/35017638. [DOI] [PubMed] [Google Scholar]
- 90.Drezek R, Guillaud M, Collier T, Boiko I, Malpica A, Macaulay C, Follen M, Richards-Kortum R. J Biomed Opt. 2003;8:7–16. doi: 10.1117/1.1528950. [DOI] [PubMed] [Google Scholar]
- 91.Zonios G, Perelman LT, Backman V, Manoharan R, Fitzmaurice M, Van Dam J, Feld MS. Appl Opt. 1999;38:6628–6637. doi: 10.1364/ao.38.006628. [DOI] [PubMed] [Google Scholar]
- 92.Wang H-W, Zhu TC, Putt ME, Solonenko M, Metz J, Dimofte A, Miles J, Fraker DL, Glatstein E, Hahn SM, Yodh AG. J Biomed Opt. 2005;10:14004. doi: 10.1117/1.1854679. [DOI] [PubMed] [Google Scholar]
- 93.Yu G, Durduran T, Zhou C, Wang H, Putt M, Saunders H, Sehgal C, Glatstein E, Yodh A, Busch TM. Clin Cancer Res. 2005;11:3543–3552. doi: 10.1158/1078-0432.CCR-04-2582. [DOI] [PubMed] [Google Scholar]
- 94.Yu G, Durduran T, Zhou C, Zhu TC, Finlay JC, Busch TM, Malkowicz SB, Hahn SM, Yodh AG. Photochem Photobiol. 2006;82:1279–1284. doi: 10.1562/2005-10-19-RA-721. [DOI] [PubMed] [Google Scholar]
- 95.Bouma BE, Tearney GJ, editors. Handbook of Optical Coherence Tomography. Marcel Dekker; New York: 2002. [Google Scholar]
- 96.Tearney GJ, Brezinski ME, Bouma BE, Boppart SA, Pitris C, Southern JF, Fujimoto JG. Science. 1997;276:2037–2039. doi: 10.1126/science.276.5321.2037. [DOI] [PubMed] [Google Scholar]
- 97.Fercher A, Hitzenberger C, Kamp G, El-Zaiat S. Opt Commun. 1995;117:43–48. [Google Scholar]
- 98.Häusler G, Lindner MW. J Biomed Opt. 1998;3:21. doi: 10.1117/1.429899. [DOI] [PubMed] [Google Scholar]
- 99.Wojtkowski M, Leitgeb R, Kowalczyk A, Fercher AF. Proc SPIE. 2003;4619:230. [Google Scholar]
- 100.de Boer JF, Cense B, Park BH, Pierce MC, Tearney GJ, Bouma BE. Opt Lett. 2003;28:2067–2069. doi: 10.1364/ol.28.002067. [DOI] [PubMed] [Google Scholar]
- 101.Andretzky P, Lindner MW, Herrmann JM, Schultz A, Konzog M, Kiesewetter F, Hausler G. Proc SPIE. 1998;3567:78–87. [Google Scholar]
- 102.Mitsui T. Jpn J Appl Phys. 1999;38:6133. [Google Scholar]
- 103.Choma M, Sarunic M, Yang C, Izatt J. Opt Express. 2003;11:2183–2189. doi: 10.1364/oe.11.002183. [DOI] [PubMed] [Google Scholar]
- 104.Leitgeb R, Hitzenberger C, Fercher A. Opt Express. 2003;11:889–894. doi: 10.1364/oe.11.000889. [DOI] [PubMed] [Google Scholar]
- 105.Yun S, Tearney G, de Boer J, Iftimia N, Bouma B. Opt Express. 2003;11:2953–2963. doi: 10.1364/oe.11.002953. [DOI] [PMC free article] [PubMed] [Google Scholar]
- 106.Huber R, Wojtkowski M, Fujimoto JG. Opt Express. 2006;14:3225–3237. doi: 10.1364/oe.14.003225. [DOI] [PubMed] [Google Scholar]
- 107.Izatt JA, Kulkarni MD, Yazdanfar S, Barton JK, Welch AJ. Opt Lett. 1997;22:1439–1441. doi: 10.1364/ol.22.001439. [DOI] [PubMed] [Google Scholar]
- 108.Chen Z, Milner T, Srinivas S, Wang X, Malekafzali A, van Gemert M, Nelson J. Opt Lett. 1997;22:1119–1121. doi: 10.1364/ol.22.001119. [DOI] [PubMed] [Google Scholar]
- 109.Vakoc B, Yun S, de Boer J, Tearney G, Bouma B. Opt Express. 2005;13:5483–5493. doi: 10.1364/opex.13.005483. [DOI] [PMC free article] [PubMed] [Google Scholar]
- 110.Akkin T, Davé D, Milner T, Rylander H., III Opt Express. 2004;12:2377–2386. doi: 10.1364/opex.12.002377. [DOI] [PubMed] [Google Scholar]
- 111.Fang-Yen C, Chu MC, Seung HS, Dasari RR, Feld MS. Opt Lett. 2004;29:2028–2030. doi: 10.1364/ol.29.002028. [DOI] [PubMed] [Google Scholar]
- 112.Akkin T, Joo C, de Boer JF. Biophys J. 2007;93:1347–1353. doi: 10.1529/biophysj.106.091298. [DOI] [PMC free article] [PubMed] [Google Scholar]
- 113.Joo C, Akkin T, Cense B, Park B, de Boer J. Opt Lett. 2005;30:2131–2133. doi: 10.1364/ol.30.002131. [DOI] [PubMed] [Google Scholar]
- 114.Liu L, Gardecki JA, Nadkarni SK, Toussaint JD, Yagi Y, Bouma BE, Tearney GJ. Nat Med. 2011;17:1010–1014. doi: 10.1038/nm.2409. [DOI] [PMC free article] [PubMed] [Google Scholar]
- 115.Choi SS, Zawadzki RJ, Keltner JL, Werner JS. Invest Ophthalmol Visual Sci. 2008;49:2103–2119. doi: 10.1167/iovs.07-0980. [DOI] [PMC free article] [PubMed] [Google Scholar]
- 116.Li Q, Onozato ML, Andrews PM, Chen C-W, Paek A, Naphas R, Yuan S, Jiang J, Cable A, Chen Y. Opt Express. 2009;17:16000–16016. doi: 10.1364/OE.17.016000. [DOI] [PubMed] [Google Scholar]
- 117.Jafri MS, Farhang S, Tang RS, Desai N, Fishman PS, Rohwer RG, Tang CM, Schmitt JM. J Biomed Opt. 2005;10:051603. doi: 10.1117/1.2116967. [DOI] [PubMed] [Google Scholar]
- 118.Ambrosi CM, Moazami N, Rollins AM, Efimov IR. 2009;14:054002–054007. doi: 10.1117/1.3213604. [DOI] [PMC free article] [PubMed] [Google Scholar]
- 119.Shen B, Zuccaro G, Gramlich TL, Gladkova N, Lashner BA, Delaney CP, Connor JT, Remzi FH, Kareta M, Bevins CL, Feldchtein F, Strong SA, Bambrick ML, Trolli P, Fazio VW. Clin Gastroenterol Hepatol. 2004;2:754–760. doi: 10.1016/s1542-3565(04)00346-5. [DOI] [PubMed] [Google Scholar]
- 120.Xi C, Marks D, Schlachter S, Luo W, Boppart SA. J Biomed Opt. 2006;11:034001. doi: 10.1117/1.2209962. [DOI] [PubMed] [Google Scholar]
- 121.Park J, Jo JA, Shrestha S, Pande P, Wan Q, Applegate BE. Biomed Opt Express. 2010;1:186–200. doi: 10.1364/BOE.1.000186. [DOI] [PMC free article] [PubMed] [Google Scholar]
- 122.Yuan S, Lai M, Roney CA, Jiang J, Li Q, Ma H, Cable A, Summers RM, Chen Y. Proc SPIE. 2009;7169:71690O. [Google Scholar]
- 123.Jefferson A, Wijesurendra RS, McAteer MA, Digby JE, Douglas G, Bannister T, Perez-Balderas F, Bagi Z, Lindsay AC, Choudhury RP. Atherosclerosis. 2011;219:579–587. doi: 10.1016/j.atherosclerosis.2011.07.127. [DOI] [PMC free article] [PubMed] [Google Scholar]
- 124.Skala MC, Crow MJ, Wax A, Izatt JA. Nano Lett. 2008;8:3461–3467. doi: 10.1021/nl802351p. [DOI] [PMC free article] [PubMed] [Google Scholar]
- 125.Kermani O, Will F, Massow O, Oberheide U, Lubatschowski H. J Refract Surg. 2010;26:57–60. doi: 10.3928/1081597X-20101215-09. [DOI] [PubMed] [Google Scholar]
- 126.Vaddavalli P, Hurmeric V, Wang J, Yoo S. J Refract Surg. 2012;28:72–74. doi: 10.3928/1081597X-20111202-01. [DOI] [PubMed] [Google Scholar]
- 127.Rosas Salaroli CH, Li Y, Huang D. J Cataract Refractive Surg. 2009;35:1640–1642. doi: 10.1016/j.jcrs.2009.04.025. [DOI] [PMC free article] [PubMed] [Google Scholar]
- 128.Latour G, Georges G, Lamoine LS, Deumié C, Conrath J, Hoffart L. J Biomed Opt. 2010;15:056006. doi: 10.1117/1.3486544. [DOI] [PubMed] [Google Scholar]
- 129.Chlebicki CA, Lee AD, Jung W, Li H, Liaw LH, Chen Z, Wong BJ. Lasers Surg Med. 2010;42:306–312. doi: 10.1002/lsm.20915. [DOI] [PMC free article] [PubMed] [Google Scholar]
- 130.Donnelly RF, Garland MJ, Morrow DIJ, Migalska K, Singh TRR, Majithiya R, Woolfson AD. J Controlled Release. 2010;147:333–341. doi: 10.1016/j.jconrel.2010.08.008. [DOI] [PubMed] [Google Scholar]
- 131.Singer AJ, Wang Z, McClain SA, Pan Y. Acad Emerg Med. 2007;14:387–391. doi: 10.1197/j.aem.2006.11.022. [DOI] [PubMed] [Google Scholar]
- 132.Ren H, Waltzer WC, Bhalla R, Liu J, Yuan Z, Lee CSD, Darras F, Schulsinger D, Adler HL, Kim J, Mishail A, Pan Y. Urology. 2009;74:1351–1357. doi: 10.1016/j.urology.2009.04.090. [DOI] [PMC free article] [PubMed] [Google Scholar]
- 133.Vakoc BJ, Shishko M, Yun SH, Oh W-Y, Suter MJ, Desjardins AE, Evans JA, Nishioka NS, Tearney GJ, Bouma BE. Gastrointest Endosc. 2007;65:898–905. doi: 10.1016/j.gie.2006.08.009. [DOI] [PMC free article] [PubMed] [Google Scholar]
- 134.Bouma BE, Tearney GJ, Compton CC, Nishioka NS. Gastrointest Endosc. 2000;51:467–474. doi: 10.1016/s0016-5107(00)70449-4. [DOI] [PubMed] [Google Scholar]
- 135.Evans JA, Poneros JM, Bouma BE, Bressner J, Halpern EF, Shishkov M, Lauwers GY, Mino-Kenudson M, Nishioka NS, Tearney GJ. Clin Gastroenterol Hepatol. 2006;4:38–43. doi: 10.1053/S1542-3565(05)00746-9. [DOI] [PMC free article] [PubMed] [Google Scholar]
- 136.Tearney GJ, Waxman S, Shishkov M, Vakoc BJ, Suter MJ, Freilich MI, Desjardins AE, Oh W-Y, Bartlett LA, Rosenberg M, Bouma BE. JACC Cardiovasc Imaging. 2008;1:752–761. doi: 10.1016/j.jcmg.2008.06.007. [DOI] [PMC free article] [PubMed] [Google Scholar]
- 137.Zhong W, Celli JP, Rizvi I, Mai Z, Spring BQ, Yun SH, Hasan T. Br J Cancer. 2009;101:2015–2022. doi: 10.1038/sj.bjc.6605436. [DOI] [PMC free article] [PubMed] [Google Scholar]
- 138.Nassif N, Cense B, Park B, Pierce M, Yun S, Bouma B, Tearney G, Chen T, de Boer J. Opt Express. 2004;12:367–376. doi: 10.1364/opex.12.000367. [DOI] [PubMed] [Google Scholar]
- 139.Miller JW, Schmidt-Erfurth U, Sickenberg M, Pournaras CJ, Laqua H, Barbazetto I, Zografos L, Piguet B, Donati G, Lane AM, Birngruber R, van den Berg H, Strong A, Manjuris U, Gray T, Fsadni M, Bressler NM, Gragoudas ES. Arch Ophthalmol. 1999;117:1161–1173. doi: 10.1001/archopht.117.9.1161. [DOI] [PubMed] [Google Scholar]
- 140.Ozdemir H, Karacorlu SA, Karacorlu M. Am J Ophthalmol. 2006;141:574–576. doi: 10.1016/j.ajo.2005.09.031. [DOI] [PubMed] [Google Scholar]
- 141.de Bruin DM, Burnes DL, Loewenstein J, Chen Y, Chang S, Chen TC, Esmaili DD, de Boer JF. Invest Ophthalmol Visual Sci. 2008;49:4545–4552. doi: 10.1167/iovs.07-1553. [DOI] [PubMed] [Google Scholar]
- 142.Salinas-AlamQn A, Garc%a-Layana A, Maldonado M, Sainz-G+mez C, AlvQrez-Vidal A. Am J Ophthalmol. 2005;140:23–28. doi: 10.1016/j.ajo.2005.01.044. [DOI] [PubMed] [Google Scholar]
- 143.Collins HA, Khurana M, Moriyama EH, Mariampillai A, Dahlstedt E, Balaz M, Kuimova MK, Drobizhev M, Yang VXD, Phillips D. Nat Photonics. 2008;2:420–424. [Google Scholar]
- 144.Blankenberg FG, Norfray JF. Am J Roentgenol. 2011;197:308–317. doi: 10.2214/AJR.11.6953. [DOI] [PubMed] [Google Scholar]
- 145.Farhat G, Yang VXD, Kolios MC, Czarnota GJ. Proc SPIE. 2011;7907:790713. [Google Scholar]
- 146.Farhat G, Mariampillai A, Yang VX, Czarnota GJ, Kolios MC. J Biomed Opt. 2011;16:070505. doi: 10.1117/1.3600770. [DOI] [PubMed] [Google Scholar]
- 147.Vakoc BJ, Lanning RM, Tyrrell JA, Padera TP, Bartlett LA, Stylianopoulos T, Munn LL, Tearney GJ, Fukumura D, Jain RK. Nat Med. 2009;15:1219–1223. doi: 10.1038/nm.1971. [DOI] [PMC free article] [PubMed] [Google Scholar]
- 148.van der Meer F, Faber D, Aalders M, Poot A, Vermes I, van Leeuwen T. Laser Med Sci. 2010;25:259–267. doi: 10.1007/s10103-009-0723-y. [DOI] [PMC free article] [PubMed] [Google Scholar]
- 149.Pan YT, Wu ZL, Yuan ZJ, Wang ZG, Du CW. J Biomed Opt. 2007;12:050504. doi: 10.1117/1.2800007. [DOI] [PubMed] [Google Scholar]
- 150.Berek JS, Bast RCJ. In: Cancer Medicine. 6. Kufe DW, Pollock RE, Weichselbaum RR, Bast RC Jr, Gansler TS, Holland JF, Frei E III, editors. B. C. Decker Inc; Hamilton, Ontario: 2003. pp. 1831–1861. [Google Scholar]
- 151.Song X, Liu X, Chi W, Liu Y, Wei L, Wang X, Yu J. Cancer Chemother Pharmacol. 2006;58:776–784. doi: 10.1007/s00280-006-0224-7. [DOI] [PubMed] [Google Scholar]
- 152.Alderden RA, Mellor HR, Modok S, Hall MD, Sutton SR, Newville MG, Callaghan R, Hambley TW. J Am Chem Soc. 2007;129:13400–13401. doi: 10.1021/ja076281t. [DOI] [PubMed] [Google Scholar]
- 153.Evans CL, Rizvi I, Celli J, Abu-Yousif A, de Boer J, Hasan T. Proc SPIE. 2010;7551:75510J. [Google Scholar]
- 154.Gähwiler BH, Capogna M, Debanne D, McKinney RA, Thompson SM. Trends Neurosci. 1997;20:471–477. doi: 10.1016/s0166-2236(97)01122-3. [DOI] [PubMed] [Google Scholar]
- 155.Sharma U, Chang EW, Yun SH. Opt Express. 2008;16:19712–19723. doi: 10.1364/oe.16.019712. [DOI] [PMC free article] [PubMed] [Google Scholar]
- 156.Boppart SA, Oldenburg AL, Xu C, Marks DL. J Biomed Opt. 2005;10:041208. doi: 10.1117/1.2008974. [DOI] [PubMed] [Google Scholar]
- 157.Oldenburg A, Gunther J, Boppart S. Opt Lett. 2005;30:747–749. doi: 10.1364/ol.30.000747. [DOI] [PubMed] [Google Scholar]
- 158.Xu C, Vinegoni C, Ralston T, Luo W, Tan W, Boppart SA. Opt Lett. 2006;31:1079–1081. doi: 10.1364/ol.31.001079. [DOI] [PubMed] [Google Scholar]
- 159.Oldenburg AL, Hansen MN, Ralston TS, Wei A, Boppart SA. J Mater Chem. 2009;19:6407–6411. doi: 10.1039/b823389f. [DOI] [PMC free article] [PubMed] [Google Scholar]