Abstract
Current thoracic artificial lungs (TALs) have blood flow impedances greater than the natural lungs, which can result in abnormal pulmonary hemodynamics. This study investigated the impedance and gas transfer performance of a TAL with a compliant housing (cTAL). Fluid-structure interaction (FSI) analysis was performed using ADINA to examine the effect of the inlet and outlet expansion angle, θ, on device impedance and blood flow patterns. Based on the results, the θ=45° model was chosen for prototyping and in vitro testing. Glycerol was pumped through this cTAL at 2, 4, and 6 L/min at 80 and 100 beats/min, and the zeroth and first harmonic impedance moduli, Z0 and Z1, were calculated. Gas transfer testing was conducted at blood flow rates of 3, 5, and 7 L/min. FSI results indicated that the 45° model had an ideal combination of low impedance and even blood flow patterns, and was thus chosen for prototyping. In vitro, Z0=0.53 ± 0.06 mmHg/(L/min) and Z1=0.86 ± 0.08 mmHg/(L/min) at 4 L/min and 100 beats/min. Outlet PO2 and SO2 values were above 200 mmHg and 99.5%, respectively, at each flow rate. Thus, the cTAL had lower impedance than hard-shell TALs and excellent gas transfer.
Keywords: Compliant thoracic artificial lung (cTAL), Fluid-structure interaction (FSI) modeling, impedance
Introduction
Thoracic artificial lungs (TALs) are being developed as a long-term bridge to lung transplant for patients with end-stage lung disease. These devices are attached to the pulmonary circulation with blood flow provided by the right ventricle (RV) of the heart. Current TALs possess blood flow impedances greater than the natural lungs, resulting in abnormal pulmonary hemodynamics when implanted in series (pulmonary artery (PA) – PA) with the natural lung or in parallel (PA – left atrium (LA)) . In series attachment increases pulmonary system impedance and decreases CO under most conditions.1 In parallel attachment decreases pulmonary system impedance and increases CO if the PA is not banded but can lead to elevated pulmonary artery pressures if the PA is banded to increase TAL flow. During simulated exercise, this can lead to decreased CO and exercise tolerance.2 Further decreases in device impedance are thus necessary to improve hemodynamics under both attachment modes.
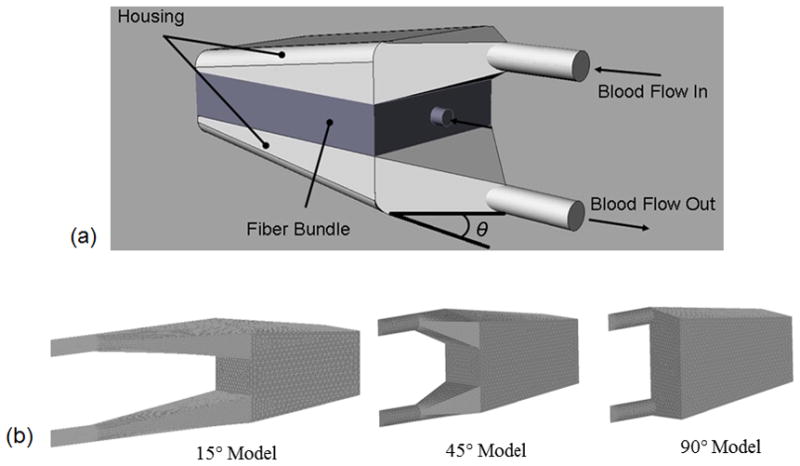
This study aimed to reduce TAL impedance using a housing that has a gradual inlet and outlet design and a compliant material. In this compliant thoracic artificial lung (cTAL), blood flows through the inlet and into the compliant inlet manifold (Figure 1). The housing expands, accommodating the stroke volume without a large pressure increase. Blood then flows through the fiber bundle where gas exchange occurs, through the bottom housing manifold and finally exits through the outlet. The effect of inlet and outlet expansion angle, θ, on cTAL impedance and flow patterns was explored with fluid-structure interaction (FSI) analysis. The FSI analysis was necessary to examine the interaction between fluid forces and housing deformation. The optimal cTAL design was determined from FSI results, prototyped, and tested in vitro to assess impedance and gas transfer performance.
Figure 1.
(a) cTAL model showing blood flow path and inlet and outlet expansion angle, θ (b) cTAL housing models used for CFD study with θ = 15°, 45° and 90°
Methods
Fluid Structure Interaction Analysis
SolidWorks (Dassault Systèmes SolidWorks Corp, Concord, MA) computer aided design (CAD) software was used to create cTAL models with varying housing geometries using θ= 15°, 45°, and 90° (Figure 1). The inlet/outlet diameter, height, and width of each cTAL model are 0.016 m, 0.103 m, and 0.102 m, respectively. The fiber bundle length, path length, and frontal area are 0.127 m, 0.038 m, and 0.013 m2, respectively, for each model. The 15°, 45°, and 90° models have a total length of 0.178 m, 0.221 m, and 0.338 m. These models were then imported into the ADINA (ADINA R&D Inc., Watertown, MA) computational fluid dynamics (CFD) software program for 3D analysis.
For FSI analysis, separate structure and fluid models were created, coupled and then run together. The fluid model consisted of all regions that fluid passed through while the structure model consisted of the Biospan housing.
Problem Formulation
Program assumptions included a transient solution with incompressible flow. At a flow of 3 L/min, the peak Reynolds number was 4150 in the inlet section, 170 coming out of the bundle into the outlet section, and 3300 exiting the device. Due to limitations in the CFD software, we could not apply turbulent flow to the fiber bundle (porous media model). This required us to split up sections and run their simulations independently, while carrying boundary conditions from one section to the next. Two such solutions were attempted: i) running each section independently, with turbulence in the inlet and outlet sections and laminar flow in the bundle, and ii) running the inlet section as turbulent and remainder of the model as laminar. The latter gave us the most quantitatively accurate and physically realistic results possible and is thus presented here. Turbulence equations used for this analysis have been previously described.3
The fiber bundle was modeled as isotropic rigid porous media, utilizing Darcy’s model, with a porosity of 0.75, permeability of 2.81×10⁻⁹ m2, fluid viscosity of 3.0 cP, fluid density of 1040 kg/m3, and solid density of 900 kg/m3. Further details are provided elsewhere.4 A slip wall boundary condition was applied to the bundle walls while a FSI condition was used in the inlet and outlet regions. A pressure of 770 mmHg (absolute pressure) was applied at the outlet and also used for the initial pressure condition. A time dependent velocity was applied to the inlet face using a previously described pulsatile flow waveform4 (Figure 2) with average flow rates, Q, of 3 and 5 L/min and a heart rate, HR, of 100 beats/min.
Figure 2.
cTAL inlet and outlet flow waveforms for the FSI models at 3 L/min and 100 beats/min, showing outlet flow dampening. Representative cTAL inlet flow waveform from the in vitro study at 4 L/min and 100 beats/min.
The structure model consisted of the compliant, Biospan (DSM PTG, Berkeley, CA) housing at the cTAL inlet and outlet. Biospan was defined as an elastic isotropic material with a Young’s modulus of 6.21 MPa, Poisson’s ratio of 0.40, and density of 1030 kg/m3. FSI boundary conditions were applied to each face and shell elements were used with a face thickness of 0.51 mm. The edges bordering the fiber bundle were fixed in all directions, along with the inlet and outlet edge to prevent translation of the model in space. Symmetry plane edges were fixed in the direction normal to the symmetry plane. An atmospheric pressure of 760 mmHg was applied to to the exterior faces of the structure model. Lastly, the governing equations used for FSI analysis included the Navier-Stokes equations, the elastodynamics equation, and boundary conditions defined at the fluid-solid interface (equation 1), all described in previous work.5
| (1) |
Numerical Scheme
A finite element formulation based on the Galerkin method was utilized to solve the governing equations. 3D tetrahedral elements were used for the fluid model mesh, while quadrilateral shell elements were used in the structure model mesh. Different grid size was used to achieve grid-independent results. Direct computing of two-way fluid-structure coupling was used. A value of 10−5 was set for the relative error in the simulation. Convergence criteria were set at ≤ 1.5% difference in impedance between models of different time step or mesh size. The final mesh size was 3 mm for the bodies, 0.25 mm for the inlet and outlet sections, and 1.0 mm for the inlet and outlet faces. A time step of 0.001 s was used.
Data Analysis
The fluid and structure models were run simultaneously with FSI analysis for four consecutive heart beats to achieve a converged, periodic solution. Inlet and outlet pressure data, along with flow, from the final beat were obtained from the program. Fourier transforms were performed on the inlet flow and pressure to calculate the zeroth and first harmonic impedance moduli (Z0 and Z1, respectively) according to previous methods.5 The Z0 is the opposition to the steady component of blood flow, and Z1 is the opposition to pulsatile flow at a frequency equal to the heart rate. Average blood pressures and flow at the inlet and outlet fiber bundle faces were used to determine bundle resistance. Average maximum housing displacement, Davg, was also calculated, from absolute magnitude values, over the last heartbeat for the inlet and outlet manifold of each model.
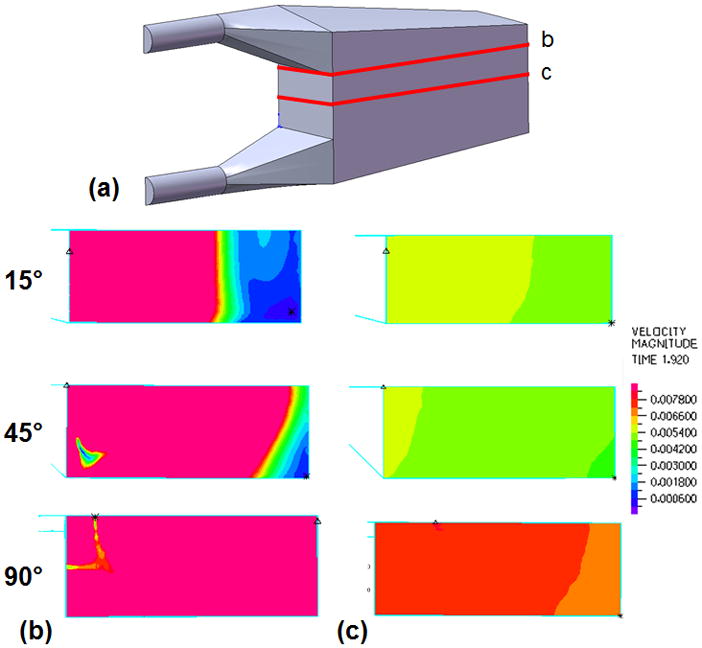
Velocity band plots were created to assess flow uniformity in the housing and bundle of each model. Plots were created on a cross section along the y-axis (top down view) for cross sections at the entrance to the fiber bundle from the inlet section and in the middle of the fiber bundle (Figure 6). In these plots, color denotes velocity magnitude with red representing the highest velocity in the plot range and blue representing a velocity of 0 m/s. A plot range of 0–0.0081 m/s was created at peak systole in the cardiac cycle.
Figure 6.
(a) Sections taken along the y-axis of the cTAL model and used to create velocity band plots for the 15°, 45°, and 90° cTAL models at peak systole in the (b) inlet housing region at the entrance to the fiber bundle and (c) middle of the fiber bundle.
Compliant Thoracic Artificial Lung
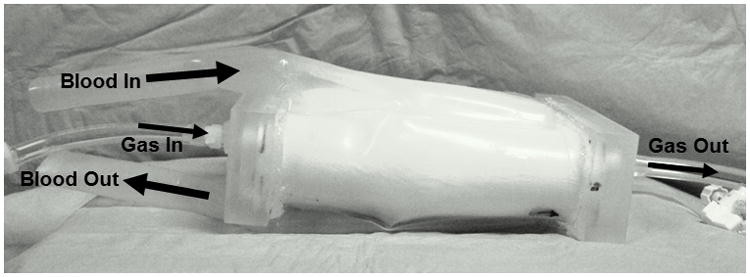
The cTAL with θ= 45° was prototyped for in vitro testing (Figure 3). The housing consisted of 0.51 mm thick Biospan (DSM PTG, Berkeley, CA), a polyurethane polymer and a bundle of 210 μm OD polypropylene hollow fibers with a void fraction, path length, frontal area, and surface area of 0.75, 0.038 m, 0.013 m2, and 2.4 m2, respectively. Device compliance was determined using previously reported methods.6 Fluid volume was slowly added to the device while pressure was recorded and compliance was calculated as ΔV/ΔP.
Figure 3.
cTAL prototype showing blood flow path
In Vitro Testing: Hemodynamics
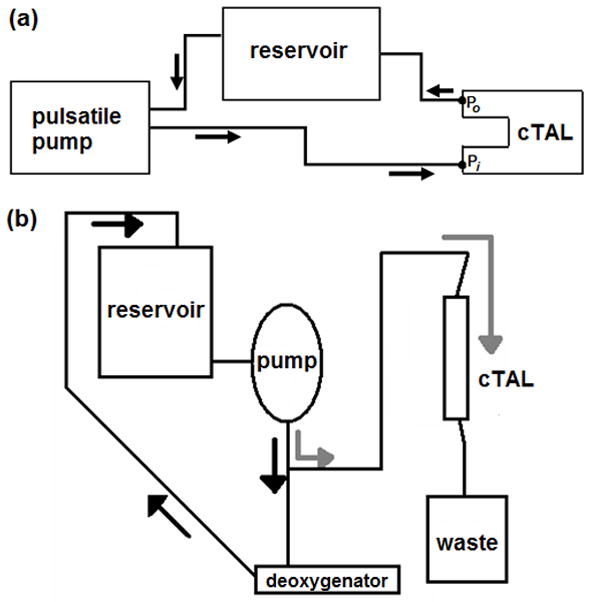
In vitro testing was conducted in a circuit consisting of a pulsatile pump (Harvard Apparatus, Holliston, MA), cTAL (n = 4), and reservoir filled with 3.0 cP glycerol solution (Figure 4a). Fluid-coupled pressure transducers (Abbott Critical Care Systems, Chicago, IL) measured pressure at the cTAL inlet (Pi) and outlet (Po). A flow probe (14PXL, Transonic Systems Inc, Ithaca, NY) measured the flow rate into the cTAL (QcTAL). The pulsatile pump created six flow conditions: heart rates (HR) of 80 and 100 beats/min and flow rates (Q) of 2, 4, and 6 L/min. At each condition, a data set of QcTAL, Pi, and Po was digitally acquired for 15 seconds at a sampling frequency of 250 Hz through a BIOPAC data acquisition system (BIOPAC, Goleta, CA). The Z0 and Z1 were calculated as described previously. Stroke volume, SV, was calculated as Q/HR, and linear regressions were performed between Z0 and Z1 and SV.
Figure 4.
(a) In vitro testing circuit for resistance study consisting of pulsatile pump, cTAL model, and reservoir filled with 3.0 cP glycerol solution. Two pressure lines were connected to the model at the inlet (P1) and outlet (P2). (b) Gas transfer testing circuit consisting of a reservoir filled with bovine blood, roller pump, deoxygenator (conditioning loop) and a cTAL (testing loop).
In Vitro Testing: Gas Transfer
The gas transfer performance of four cTALs was tested in a recirculation circuit consisting of bovine blood (Figure 4b). Blood was pumped by a roller pump (Baxter Century, Baxter, Deerfield, IL) from the recirculation reservoir, through a deoxygenator (Capiox Rx 25, Terumo Cardiovascular Systems, Ann Arbor, MI) and returned to the reservoir in order to bring the blood to venous conditions (Hb = 12 ± 1 g/dL, SO2 = 65 ± 5%, base excess = 0 ± 5 mEq/L, PCO2 = 45 ± 5 mmHg).7 The sweep gas used to condition the blood consisted of varying levels of O2, N2, and CO2. Once conditioned, the blood was pumped through the cTAL at flow rates of 3, 5, and 7 L/min, and oxygen flow was set at a gas to blood flow ratio of two. Blood samples were taken from the cTAL inlet and outlet and analyzed to determine PO2, PCO2, pH, SO2, and hemoglobin concentration. The O2 and CO2 transfer rates were calculated with standard formulas.6
Results
Fluid-Structure Interaction Modeling
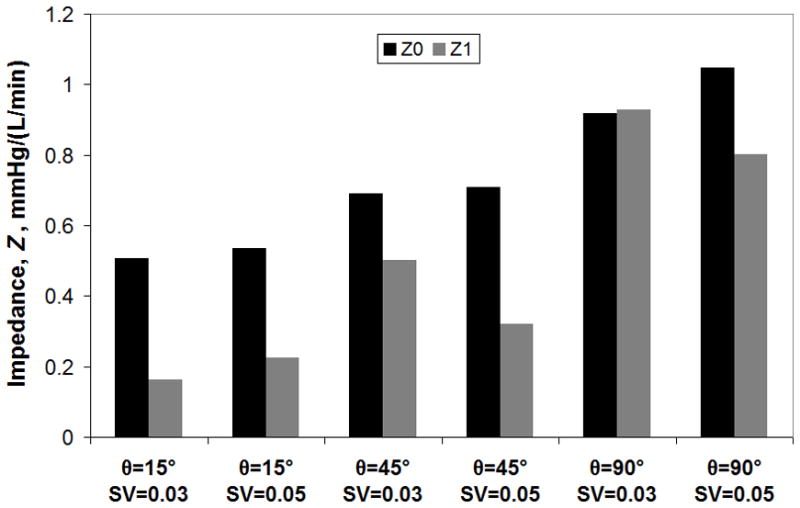
The compliant housing of the cTAL caused dampening of device outlet flow. Inlet and outlet flow waveforms for Q=3 L/min are shown in Figure 2. Figure 5 displays FSI results with cTAL Z0 and Z1 on the y axis and SV on the x axis. For the 15° and 45° models, Z0 increases minimally as SV increases. However, Z0 increased 13% from SV=0.03 to 0.05 L in the 90° model. At SV=0.03 L, Z0 was 0.50, 0.69, and 0.92 mmHg/(L/min) for the 15°, 45°, and 90° devices, respectively. Z1 increases with increasing θ and at SV=0.03 L, Z1 is 0.16, 0.50, and 0.93 mmHg/(L/min) for the 15°, 45°, and 90° models, respectively. Velocity vector plots in the inlet region (not shown) depict recirculation regions in the inlet that increase in size and velocity with θ, explaining the effect of θ on Z0.
Figure 5.

FSI results showing the effect of θ on cTAL Z0 and Z1 for varying stroke volumes
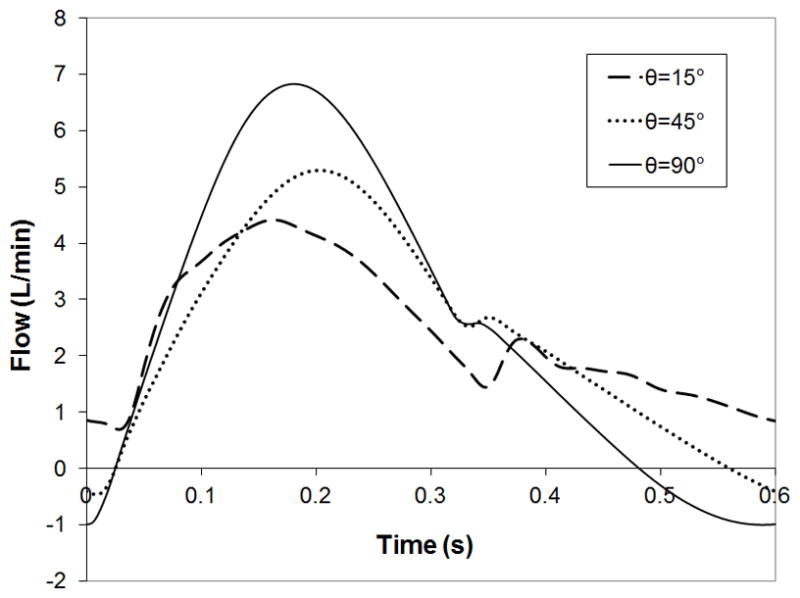
Velocity band plots taken at cross sections in the inlet region at the entrance to the fiber bundle (Figure 6b) and the middle of the fiber bundle (Figure 6c) are shown in Figure 6. These plots are taken during peak systole in the cardiac cycle for a velocity plot range of 0.0 – 0.0081 m/s. Figure 6b shows areas of low flow in the distal end of the housing in the 15° and 45° models. At the entrance to the fiber bundle, flow is mostly uniform at the proximal end of all models, except for a small spot in the 45° and 90° models. Figure 6c shows uniform flow in the fiber bundle, with very small velocity differences between the proximal and distal ends. Velocity in the bundle at peak systole in the 90° model is slightly higher than the other models. This is due to less dampening of the flow pulse in the inlet region of the 90° model, causing more blood to enter the fiber bundle during systole (see below). Figure 7 shows the flow waveforms entering the fiber bundle for each model. Peak flow is highest for the 90° model, while flow grows more even across the cardiac cycle with decreasing θ.
Figure 7.
Flow waveforms entering the fiber bundle for the 15°, 45°, and 90° cTAL models
Flow dampening occurs due to the housing expanding and contracting with the flow pulse. The average maximum housing displacement over one heart beat, Davg, for the inlet and outlet housing sections is given in Table 1 for each model and flow rate. With increasing Q, Davg increases for both housing sections. Housing displacement is larger in the inlet section than in the outlet section. Displacement occurs more gradually over the flow pulse for smaller θ, causing Davg to be largest in the 15° model.
Table 1.
Maximum housing displacement in one heart beat, Dmax, and average maximum housing displacement over one heart beat, Davg, for the inlet and outlet housing sections for each model and flow rate.
| Model, θ | Flow Rate, Q, L/min | Inlet Davg (mm) | Outlet Davg (mm) |
|---|---|---|---|
| 15° | 3 | 1.97 | 1.82 |
| 15° | 5 | 2.29 | 2.04 |
| 45° | 3 | 1.8 | 1.66 |
| 45° | 5 | 2.08 | 1.86 |
| 90° | 3 | 1.64 | 1.51 |
| 90° | 5 | 1.95 | 1.73 |
In Vitro Testing: Hemodynamics
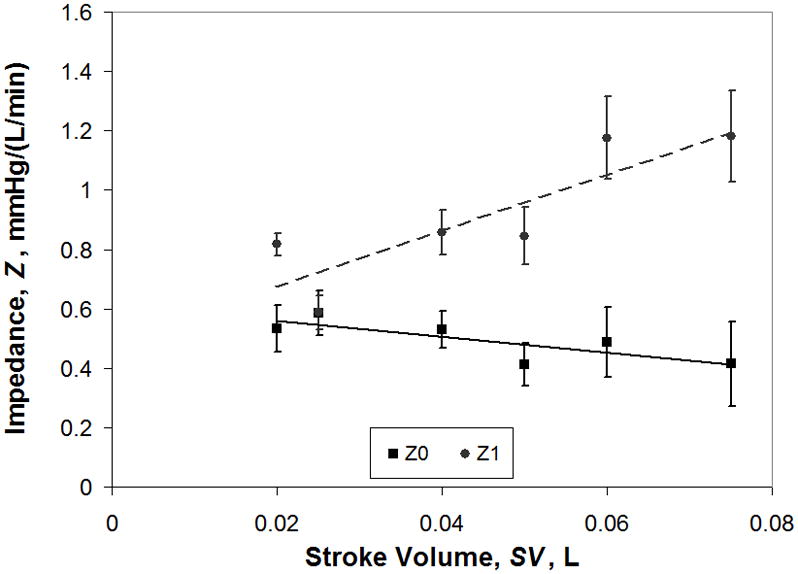
cTAL compliance was 93.9 ± 8.75 mL/mmHg for internal pressure < 5 mmHg and 5.21 ± 0.57 mL/mmHg for internal pressure > 5 mmHg. When pressures are < 5 mmHg, the housing of the cTAL is unfurling and compliance is very high. When internal pressures are > 5 mmHg, the housing has begun to stretch, reducing compliance. In vitro Z0 and Z1 data for varying SV are displayed in Figure 8. As SV increases, Z0 decreases slightly from 0.53 ± 0.08 mmHg/(L/min) at SV=0.02 L to 0.41 ± 0.14 mmHg/(L/min) at SV=0.075 L. The correlation relating Z0 to SV was: Z0 = −2.691SV + 0.615, R2=0.65. The value of Z1 increases with SV, with a correlation of Z1 = 9.472SV + 0.485, R2=.75%. In vitro, Z1 values are higher than the FSI models predicted, while experimental Z0 values are slightly lower.
Figure 8.
In vitro impedance results showing the effect of stroke volume on Z0 and Z1
In Vitro Testing: Gas Transfer
Gas transfer performance is shown in Table 2. Average Hb, inlet pH, and outlet pH for all the experiments was 11.7 ± 0.3 g/dL, 7.2 ± 0.02, and 7.3 ± 0.1, respectively. The outlet PO2 decreases with blood flow rate but remains above 240 mmHg at all conditions. Similarly, SO2 remains above 99.5%. Lastly, VO2 and VCO2 increase linearly with increasing blood flow rate.
Table 2.
cTAL gas transfer performance: outlet PO2, outlet SO2, VO2 and VCO2 for varying blood flow rates.
| Blood Flow, Q, L/min | Outlet PO2 (mmHg) | Outlet SO2 (%) | VO2 (mL/min) | VCO2 (mL/min) |
|---|---|---|---|---|
| 3 | 436.0 ± 15.9 | 99.9 ± 0.02 | 196.6 ± 13.4 | 330.0 ± 73.2 |
| 5 | 360.9 ± 54.4 | 99.9 ± 0.04 | 307.6 ± 18.0 | 417.5 ± 91.8 |
| 7 | 242.8 ± 48.9 | 99.7 ± 0.14 | 395.4 ± 42.9 | 500.5 ± 35.0 |
Discussion
FSI impedance and flow patterns were used to choose the optimal model for prototyping. As θ decreased, impedance decreased. At Q= 3 L/min and HR= 100 beats/min, Z0 values for the 15°, 45°, and 90° models were 0.51, 0.69, and 0.92 mmHg/(L/min), respectively. Z1 values were low, under 1 mmHg/(L/min), for all three models. For the range of Z0 values found here, an increase in Z1 of 12–24 mmHg/(L/min) is necessary in order to decrease CO by 1%.8 Thus, the Z1 differences found in this study would have no significant effect on cardiac function, and thus had no bearing on device selection.
Based on these results alone, θ = 15° would appear to be the ideal model. However, in the 15° model, blood flow enters with such a limited velocity that it does not reach the back end of the manifold, creating a large low flow region at the distal end of the device. This low flow region could lead to reduced gas transfer performance and clot formation over time. The 45° device had a smaller, low flow region at the distal end. The 90° model possesses a higher velocity inlet jet that reaches the back end of the device, leading to largely uniform flow. Flow through the bundle was mostly uniform in all models, with slightly higher velocities at the proximal end. While flow was more spatially uniform with higher θ, it was less temporally uniform due to lower dampening of the flow pulse. Slow flow during diastole could also lead to stasis and clot formation.
In sum, the 15° model has low impedance and more even flow patterns throughout the cardiac cycle but poor flow at the distal end of the device. Moreover, the 15° model is excessively long, giving it a large priming volume and making it impractical for paracorporeal use. The 90° model has good flow uniformity at the distal end of the device but a period of low flow during systole and higher impedance. Thus, the 45° model was chosen for prototyping and in vitro testing due to its combination of low impedance, good flow patterns, and ease of manufacture.
cTAL impedance of this design is much lower than all previous TAL designs and, for that matter, than a healthy native lung itself. Previous experiments examining the impedance of the MC3 Biolung (MC3, Ann Arbor, MI)9 and an early cTAL6 reported Z0=1.8 and 1.9 mmHg/(L/min), respectively at Q=4 L/min and HR=100 beats/min. Studies with the latter device suggested the majority of device resistance was from the inlet and outlet regions. The low resistance in the cTAL in the current study is a function of three things: a gradual low resistance inlet, a low resistance fiber bundle, and a compliant housing. The cTAL’s fiber bundle has a resistance of approximately 0.3 mmHg/(L/min), making the combined resistance of the inlet and outlet sections around 0.2 mmHg/(L/min).
The compliant housing of the cTAL served to further lower resistance vs. identical hard shell designs. The housing of the cTAL prototype provided a large compliance of 5.21 ± 0.57 mL/mmHg at pressures > 5 mmHg. This allowed the cTAL to accommodate a larger volume of blood during systole and dampen the flow pulse. As the housing expands, fluid enters a larger area and the velocity of the fluid decreases. Minor losses are reduced and less recirculation occurs, lowering Z0. Comparison of cTAL vector plots with those in an identical device with a hard shell housing4 confirmed that recirculation regions are smaller and have lower velocity in the cTAL. This resulted in lower impedances compared to the rigid housing TAL. At 4 L/min and 100 beats/min, Z0 was 0.53 ± 0.06 mmHg/(L/min) and Z1 was 0.86 ± 0.08 mmHg/(L/min) in the cTAL with θ = 45°. In the same device with a rigid housing, Z0=0.69 and Z1=1.22 mmHg/(L/min).4 Moreover, unlike TALs with rigid housings, Z0 decreased slightly with increasing SV in the cTAL. At SV=0.075, Z0 for the cTAL and TAL were 0.41 ± 0.14 and 0.94 ± 0.09 mmHg/(L/min), respectively. Thus, at higher flow rates, such as those experienced during exercise, there is a larger advantage to using the cTAL.
The lower impedance of the cTAL has implications for use in vivo in both PA-PA and PA-LA attachment modes. PA-LA attachment would be advantageous in patients with pulmonary hypertension. Since the device has an impedance much lower than the natural lungs, blood would flow preferentially through the cTAL. This would allow significant unloading of the right ventricle and return PA pressures to normal. One can predict how much the cTAL would lower PA pressures by using the simple formula: PPA=CO*R+PLA, where PPA is the PA pressure, CO is cardiac output, R is the resistance, and PLA is the left atrial pressure. Assuming PVR = 4 mmHg/(L/min), PLA = 6 mmHg, and a cTAL resistance of 1.4 mmHg/(L/min) for the TAL plus anastomoses (adding 0.87 mmHg/(L/min) for the anastomoses)10, the resulting system resistance with the cTAL attached in parallel would be 1.0 mmHg/(L/min). Assuming CO=6 L/min, PPA decreases from 30 mmHg prior to cTAL attachment to 12 mmHg. If the original PVR is 8 mmHg/(L/min), PPA is reduced from 54 mmHg to 13 mmHg.
If the cTAL were attached in series with the native lungs (PA-PA), it would likely result in similar PA pressure but a reduction in CO due to additive impedances and the increased work load of the RV. Relationships developed by Kim et al and Kuo et al predict the percentage decreased in CO as a result of increases in Z0 and Z1.11,8 The increase in pulmonary system impedance (ΔZ) due to the cTAL impedance (ZcTAL) can be calculated with the equation:
| (4) |
where f is the fraction of flow to the cTAL. If we assume CO=6 L/min and allow 4 L/min to travel through the cTAL then f=2/3. Using the cTAL in vitro data at Q=4 L/min and HR=100 beats/min, and adding 0.87 mmHg/(min) for the anastomoses resistance, ΔZ0 and ΔZ1 are 0.93 and 0.57 mmHg/(L/min), respectively. The Kim and Kuo relationships predict a 3.5 and 12.5% decrease in CO, respectively. If f=1/2, the Kim and Kuo relationships become 2.0 and 11.6%. Overall, these predictions are lower than previous devices and may allow for cTAL attachment in series in a small group of patients without significant pulmonary hypertension.
The low impedance and design characteristics of the cTAL should also positively affect in vivo biocompatibility. During PA-LA attachment, due to low device impedance, blood should flow preferentially through the cTAL (>50% of CO). In patients with pulmonary hypertension, blood flow to the cTAL should be well above this. Therefore, the minimum flow rate for this device is likely 3 L/min which is sufficient to prevent clot formation due to low flow. Also, the low resistance fiber bundle and lack of a pump eliminates shear activation of platelets. Finally, high device compliance (5 ml/mmHg) allows flow to be more temporally uniform throughout the cardiac pulse. Thus, blood flow never falls to zero during diastole.
Gas transfer in the cTAL is excellent with outlet PO2 and SO2 values above 240 mmHg and 99.5%, respectively, at each tested flow rate. Thus, the cTAL exceeds its gas transfer goals and the fiber bundle size should be reduced in the future. Previous studies in devices with the same fiber bundle type suggest that 1.7 m2 would still give excellent gas transfer performance6 with smaller prime volume and lesser blood-biomaterial interactions. A shortened device would also help to eliminate any low flow or stasis regions near the distal end.
In conclusion, this cTAL features excellent gas transfer and far lower impedance than any previous TAL. The excellent gas transfer and low impedance indicate that it is ready to proceed to PA-LA and PA-PA in vivo testing to examine its interaction with the right ventricle as well as its biocompatibility.
Footnotes
Disclosures: NIH Heart, Lung and Blood grant #R01HL089043
References
- 1.Perlman CE, Cook KE, Seipelt R, Mavroudis C, Backer CL, Mockros LF. In vivo hemodynamic responses to artificial lung attachment. ASAIO Journal. 2005;51:412–425. doi: 10.1097/01.mat.0000170095.94988.90. [DOI] [PubMed] [Google Scholar]
- 2.Akay B, Reoma JL, Camboni D, et al. In-parallel artificial lung attachment at high flows in normal and pulmonary hypertension models. Ann Thorac Surg. 2010;90:259–65. doi: 10.1016/j.athoracsur.2010.03.085. [DOI] [PMC free article] [PubMed] [Google Scholar]
- 3.Khanafer K, Bull JL, Berguer R. Fluid-Structure Interaction of Laminar and Turbulent Pulsatile Flow within a Flexible Wall Axisymmetric Aortic Aneurysm Models. European Journal of Mechanics, B/Fluids. 2009;28:88–102. [Google Scholar]
- 4.Schewe RE, Khanafer KM, Orizondo RA, Cook KE. Thoracic artificial lung impedance studies using computational fluid dynamics and in vitro models. Ann Biomed Eng. 2012;40:628–36. doi: 10.1007/s10439-011-0435-x. [DOI] [PMC free article] [PubMed] [Google Scholar]
- 5.Khanafer K, Berguer R. Fluid-Structure Interaction Analysis of Turbulent Pulsatile Flow within a Layered Aortic Wall as Related to Aortic Dissection. Journal of Biomechanics. 2009;42:2642–2648. doi: 10.1016/j.jbiomech.2009.08.010. [DOI] [PubMed] [Google Scholar]
- 6.Cook KE, Perlman CE, Seipelt R, et al. Hemodynamic and Gas Transfer Properties of a Compliant Thoracic Artificial Lung. ASAIO J. 2005;51:404–411. doi: 10.1097/01.mat.0000169707.72242.8f. [DOI] [PubMed] [Google Scholar]
- 7.Association for the Advance of Medical Instrumentation. Blood Gas Exchangers. Arlington, VA: Association for the Advance of Medical Instrumentation; 1996. Cardiovascular Implants and Artificial Organs. [Google Scholar]
- 8.Kuo AS, Sato H, Cook KE. Effect of Pulmonary System Impedance on Cardiac Output. ASAIO Journal. 2007;53(2):53A. [Google Scholar]
- 9.McGillicuddy JW, Chambers SD, Galligan DT, Hirschl RB, Bartlett RH, Cook KE. In vitro, fluid mechanical effects of thoracic artificial lung compliance. ASAIO J. 2005;51:789–794. doi: 10.1097/01.mat.0000182473.47668.f1. [DOI] [PubMed] [Google Scholar]
- 10.Akay B, Foucher JA, Camboni D, Koch KL, Kawatra A, Cook KE. Hemodynamic design requirements for in series thoracic artificial lung attachment in a model of pulmonary hypertension. ASAIO Journal. doi: 10.1097/MAT.0b013e318256bb36. submitted. [DOI] [PMC free article] [PubMed] [Google Scholar]
- 11.Kim J, Sato H, Griffith GW, Cook KE. Cardiac output during high afterload artificial lung attachment. ASAIO J. 2009;55:73–77. doi: 10.1097/MAT.0b013e318191500a. [DOI] [PubMed] [Google Scholar]


