Abstract
This study measures the vascular wall shear rate at the vessel edge using decorrelation based ultrasound speckle tracking. Results for nine healthy and eight renal disease subjects are presented. Additionally, the vascular wall shear rate and circumferential strain during physiologic pressure, pressure equalization and hyperemia are compared for five healthy and three renal disease subjects. The mean and maximum wall shear rates were measured during the cardiac cycle at the top and bottom wall edges. The healthy subjects had significantly higher mean and maximum vascular wall shear rate than the renal disease subjects. The key findings of this research were that the mean vascular wall shear rates and circumferential strain changes between physiologic pressure and hyperemia that was significantly different between healthy and renal disease subjects.
Keywords: Ultrasound decorrelation based velocity estimation, Vascular wall shear rate, Vascular circumferential strain, Chronic kidney disease, End stage renal disease
INTRODUCTION
Vascular wall shear rate measurement
Patients with chronic kidney disease (CKD) and end-stage renal disease (ESRD) are at high risk of cardiovascular disease associated with vascular calcification (Schiffrin et al. 2007) and accelerated atherosclerosis, caused at least in part by abnormal endothelial function (Schiffrin et al. 2007; Galil et al. 2009; Angelantonio et al. 2010). The vascular wall shear rate (WSR) is associated with impaired endothelial function, and evidence is mounting that WSR is an important indicator of cardiovascular disease (Toborek et al. 1999; Neunteufl et al. 2000; Perticone et al. 2001; Kuvin et al. 2001; Gocke et al. 2002; Modena et al. 2002). The WSR may also help in the diagnosis of the atherosclerosis, which has been associated with low and oscillating mean WSR (Zhao 2002; Irace 2004).
Currently, WSR estimation is usually based on the measurement of peak blood velocity in the vessel center and the assumption that the blood velocity profile is parabolic (Lou et al. 1993; Gnasso et al. 1996; Wu et al. 2004; Stroev et al. 2007). However, in areas of vascular tortuosity, branching and the presence of vascular plaque, the blood velocity profile is non-parabolic (Ku 1997). Therefore, direct measurements of blood velocity near the vascular wall edge may provide a useful tool for determining accurate WSR and reducing measurement dependence on modeling assumptions that may not be universally applicable.
Ultrasound techniques can provide direct, noninvasive measurements of the WSR. Multi-gate ultrasound Doppler measurements have adequate spatial resolution for determining the flow velocity profile at vascular wall edges (Gill et al. 1985); this has been applied to measure the WSR from longitudinal views of blood vessels based on 1D velocity measurements (Brands et al. 1995; Samijo et al. 1998; Levenson et al. 2001; Bambi et al. 2004; Tortoli et al. 2006; Tortoli et al. 2011). Doppler acquisition requires the ultrasound beam to intersect the blood flow at a non-perpendicular angle, and measures the component of the flow projected along the ultrasound beam. In some settings, the WSR may be over or underestimated if the flow direction cannot be determined, when the flow is not parallel to the wall in the presence of vascular tortuosity, branching or atherosclerosis (Gill et al. 1985).
Fortunately, decorrelation based flow velocity measurement is a method that may overcome some of the assumptions associated with WSR measurements. This method has been applied to measure the flow velocity in the transverse view of the vessel (Bamber et al. 1988; Li et al. 1998; Rubin 1999; Rubin 2001; Lupotti et al. 2003). This method is expanded by investigators in this study to identify vascular wall edges, measure WSR directly at the vessel-blood interface, and shows potential advantages for in-vivo patient study.
Arterial stiffness measurement
Arterial compliance has been shown to be a strong indicator of vascular disease, cardiovascular disease and renal failure. Arterial stiffening is caused by a change in the ratio of collagen to elastin in the extracellular matrix of the arterial media (Faury 2001; Bilato and Crow 1996; Bruel and Oxlund 1996). Both arterial compliance and WSR reflect the mechanical function of the vessel, which is indicative of disease condition.
Ultrasound speckle-tracking algorithms (Lubinski et al. 1999) have been applied to measure vascular compliance. The normal arterial wall is a highly nonlinear elastic medium (Bischoff et al. 2002; Humphrey 2003; Humphrey and Na 2002; Vito and Dixon 2003; Kim et al. 2004). The nonlinear characteristics of the arterial wall have been measured using flow mediated dilation (FMD) (Mahmoud et al. 2009). In this study, the vascular wall strains were measured during post-occlusion reactive hyperemia using ultrasound. Other groups have measured the nonlinear elasticity of the arterial wall by lowering transmural pressure with external compression coupled with ultrasound speckle-tracking (Kim et al. 2004; Weitzel et al. 2005; Park et al. 2010). High arterial wall strains can be obtained using FMD, but five minutes of blood flow occlusion is necessary to generate post-occlusion reactive hyperemia (Corretti et al. 2002). In this study, we utilized external pressure to generate high arterial wall strains while limiting the occlusion time; simplifying data collection and minimizing patient discomfort.
The research presented here utilizes ultrasound radiofrequency (RF)-signals acquired from the brachial artery in upper arm for nine healthy, six CKD and two ESRD subjects. The blood velocity profile is measured from transverse views, perpendicular to the blood flow direction in the brachial artery. The WSR is calculated as a function of time throughout the cardiac cycle using three pixels from the vascular wall edge to lumen interior of the blood velocity profile. The mean and maximum WSR are determined during sequential cardiac cycles and compared between healthy and renal disease (CKD and ESRD) subjects. The WSR and vascular circumferential strain are determined for physiologic pressure, pressure equalization and hyperemia. The change in WSR and vascular circumferential strain between the healthy and the renal disease (CKD and ESRD) subjects is compared
MATERIALS AND METHODS
Subjects
A total of 11 healthy, 10 CKD and two ESRD subjects were enrolled for our study after providing informed consent, under a study protocol approved by our Investigational Review Board. Nine healthy, six CKD and two ESRD subjects were selected because their RF-signals showed sufficiently accurate and reliable vascular wall edge tracking to be used for subsequent WSR and strain analysis. The clinical information for the healthy subjects, denoted N1 to N9, the CKD patients, denoted D1 to D6, and ESRD patients, denoted D7 and D8, are summarized in Table 1. Table 2 summarizes the disease states of the subjects.
Table 1.
The healthy and renal disease (chronic kidney disease (CKD) and end-stage renal disease (ESRD)) subjects’ general information (N: healthy subject, D: diseased subject, M: male, F: female, SBP: systole blood pressure, DBP: diastole blood pressure, eGFR: estimated glomerular filtration rate)
| Subject Number | Age | Gender | SBP | DBP | eGFR (ml/min) | |
|---|---|---|---|---|---|---|
| Healthy Subjects | N1 | 53 | M | 106 | 58 | |
| N2 | 60 | M | 145 | 85 | ||
| N3 | 41 | M | 140 | 80 | ||
| N4 | 66 | M | 154 | 70 | ||
| N5 | 24 | M | 122 | 64 | ||
| N6 | 60 | M | 132 | 84 | ||
| N7 | 55 | F | 139 | 76 | ||
| N8 | 46 | F | 134 | 80 | ||
| N9 | 37 | F | 124 | 70 | ||
| Diseased Subjects | D1 | 73 | F | 142 | 84 | 21 |
| D2 | 62 | F | 158 | 60 | 16 | |
| D3 | 62 | M | 130 | 60 | 39 | |
| D4 | 48 | F | 142 | 88 | 6 | |
| D5 | 42 | F | 180 | 76 | 10 | |
| D6 | 66 | M | 114 | 64 | 4 | |
| D7 | 49 | M | 160 | 84 | 5 | |
| D8 | 30 | M | 150 | 74 | * |
No value due to transplant kidney
Table 2.
The disease state of subjects.
| CKD | ESRD | ||||||||
|---|---|---|---|---|---|---|---|---|---|
| D1 | D2 | D3 | D4 | D5 | D6 | D7 | D8 | ||
| Disease | Coronary artery disease | ||||||||
| Diabetes | |||||||||
| Hyperlipidemia | |||||||||
| Arthritis | |||||||||
| Congenital renal disease | |||||||||
| Hypertension | |||||||||
| Myeloma | |||||||||
| Thrombocytopenia | |||||||||
●: Denote the subject has the disease
Measurement instrumentation
The ultrasound scanner (model Epsilon DCI 6000 scanner, Epsilon Imaging, Ann Arbor, Michigan, USA) with a 9-MHz linear array acquired the 19.5 mm × 24.9 mm B-mode images from the transverse view of the brachial artery. The software EchoInsight™ (Epsilon Imaging, Ann Arbor, Michigan, USA) performed correlation-based, 2D speckle tracking to detect vascular wall edges (Park et al. 2010) using a 5 by 3-pixel kernel and a 9 by 5-pixel filter as well as to measure blood velocity in the vessel lumen.
Measurement protocol
The subjects were examined in the sitting position and their arm was located at the level of the heart. The ultrasound transducer was placed on the anterior surface of the upper arm. The RF-signals were acquired from the transverse views of the brachial artery. The artery remained in the center of the B-mode image by applying continuous freehand positioning over the arterial region of interest during scan data acquisition.
For the physiologic pressure, the dilation of the subject’s brachial artery was observed in response to the transmitted transmural pulse pressure within the artery induced by physiologic cardiac pulsations under normal atmospheric pressure. For the pressure equalization, the artery pulsates maximally when the applied external pressure using the pressure cuff equals the diastolic pressure and the vessel collapses completely when the applied pressure is greater than the systolic pressure. Hyperemia was generated by inflating the pressure cuff for one minute, which is sufficient blood flow restriction to generate reactive hyperemia (Pyke et al. 2005). Figure 1(a) shows the transducer orientation and methods used for the physiologic pressure and the hyperemia measurements and Figure 1(b) shows the pressure equalization measurement method.
Fig. 1.
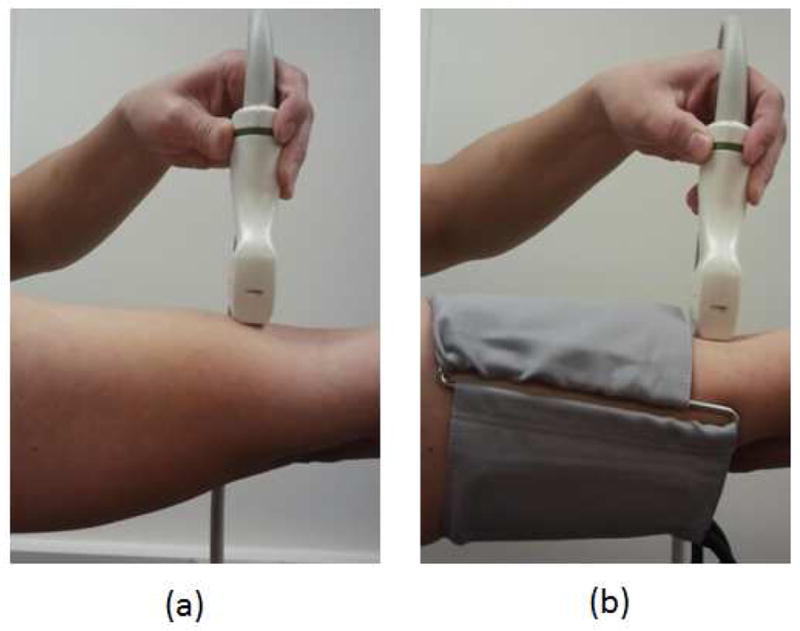
(a) Transverse blood velocity measurement in the brachial artery, (b) transverse blood velocity measurement in the brachial artery with pressure cuff.
Measurement algorithm
Post-processing of RF signals was used to measure the WSR and vascular circumferential strain from the transverse view of the brachial artery for physiologic pressure, pressure equalization and hyperemia. Speckle decorrelation was used to obtain the blood velocity profile from the transverse view of brachial artery. 2D speckle motion tracking was performed over 1000 RF-frames with a 348 Hz frame rate to obtain 999 correlation maps of the artery (2.9 s recording time). A line was visually selected through the vessel center.. Median temporal filtering with a 20 frame moving window was applied to the detected correlation coefficient along the selected line of all 999 frames using MATLAB (version 2009a, Mathworks, Natwick, MA, USA) to reduce the noise from tissue motion by removing large transient signals. A spatial filter was not applied to the correlation coefficient profile because spatial filtering could reduce the accuracy of edge detection by reducing flow signals at edges. The relationship between speckle decorrelation and speckle displacement was obtained through a calibration procedure as described in Rubin et al. (1999). The tissue (blood) velocity profile for each of the 999 selection lines was calculated by integrating the speckle displacement over the time interval between two consecutive frames.
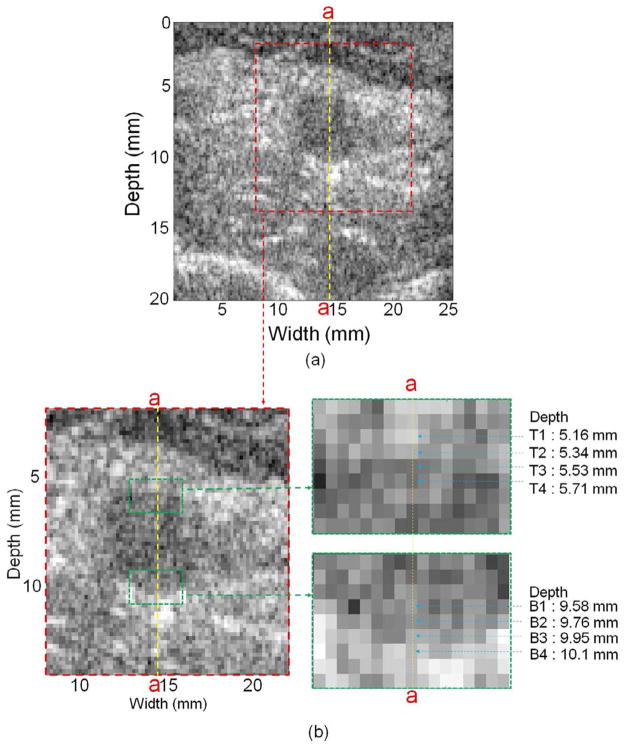
The vascular wall edges were determined from the B-mode image and the 2nd order gradient of the blood velocity profile. Figure 2 shows an example of a healthy subject (N1) B-mode image of the transverse view of the brachial artery without cuff displaying a close-up view of pixels in the artery near the top and bottom edges as well as the center vessel section line (a-a). Four pixels near the top edge, denoted as T1, T2, T3 and T4, were identified based on the transition of grey scale at depth of 5.16, 5.34, 5.53 and 5.71 mm, respectively. Similarly, four pixels, denoted B1, B2, B3 and B4 in Figure 2(b), were selected near the bottom edge in depth from 9.58 to 10.1 mm. The 2nd order gradient of blood velocity at T1, T2, T3, T4, B1, B2, B3 and B4 and adjacent pixels along the a-a line was calculated to determine each vascular wall edge. The WSR was calculated over 2.9 s using three pixels from the wall edge to the lumen interior of the blood velocity profile in the transverse view. A moving average filter with 40 frames using MATLAB (version 2009a, Mathworks, Natwick, MA, USA) was applied to remove the noise for WSR vs. time.
Fig. 2.
(a) B-mode image of the transverse view of the brachial artery and (b) close-up views of pixels in the artery and near the top and bottom edges as well as the center vessel section line (a-a). (N1, without cuff)
In each cardiac cycle, the mean WSR, denoted WSRmean, and the maximum WSR, denoted WSRmax, were calculated and compared between healthy and renal disease (CKD and ESRD) subjects. The average WSRmean, marked as , and the WSRmax, marked as , of the two or three cardiac cycles were determined for each subject. For the and , the Shapiro-Wilk test was performed to evaluate whether the measurements were obtained from a normally distributed population. A t-test was performed for the and to compare the healthy and renal disease (CKD and ESRD) subjects.
Pressure equalization using a pressure cuff was performed on healthy (N1–N9), CKD (D1–D6) and ESRD (D7 and D8) subjects. The was determined for the physiologic pressure, pressure equalization and hyperemia and denoted and , respectively. The was also determined for the physiologic pressure, pressure equalization and hyperemia and denoted and , respectively. The change of and was calculated between conditions, physiologic pressure, pressure equalization and hyperemia, and compared between the healthy and renal disease (CKD and ESRD) subjects. The t-test was performed to compare and for the healthy and diseased subjects. We used the Bonferroni adjustment to account for multiple comparisons of changes in WSR values between the three experimental conditions.
Similarly, in each cardiac cycle, the circumferential strain, denoted ε, was calculated from eqn (1) and compared between healthy and renal disease (CKD and ESRD) subjects.
| (1) |
where Df is the vascular diameter at systole, Di is the minimum diameter at diastole.
The average of circumferential strains ε, marked as ε̄, of the two or three cardiac cycles was determined for the physiologic pressure, pressure equalization and hyperemia and denoted as ε̄PH, ε̄PE and ε̄Hyper, respectively. These strains were compared between the healthy and renal disease (CKD and ESRD) subjects. For ε̄, the Shapiro-Wilk test was performed to evaluate normal distribution of healthy and disease subjects. A t-test was performed for ε̄PH to compare the healthy and renal disease (CKD and ESRD) subjects. The change of ε̄ was calculated between conditions, physiologic pressure, pressure equalization and hyperemia, and compared between the healthy and renal disease (CKD and ESRD) subjects. The t-test was performed to compare ε̄PE – ε̄PH, ε̄PE – ε̄Hyper and ε̄PH – ε̄Hyper for the healthy and diseased subjects. We again used the Bonferroni adjustment to account for multiple comparisons of changes in ε̄ between the three experimental conditions.
An estimate of the elastic modulus of arterial wall (E) was calculated by compensating the intramural strain for the pulse pressure ( ) based on an assumption that surrounding tissue effect on the arterial elasticity is small (Kim et al. 2004; Weitzel et al. 2005).
RESULTS
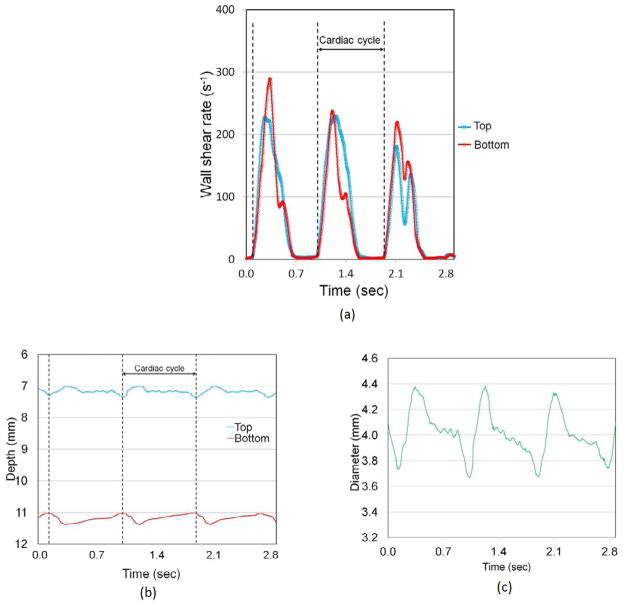
Figure 3(a) shows an example of the top and bottom vessel edge WSR vs. time for a healthy subject (N1) during the 2.9 s recording time which has three cardiac cycles using the decorrelation flow velocity measurement method. The cardiac cycle was determined from the time interval between the sharp gradient changes of the WSR. Figure 3(b) shows the depth of the top and bottom wall edge position vs. time during the recording time. A median filter with 20 frames and moving average filter with 40 frames were applied to the top and bottom wall edge position vs. time for noise reduction. The arterial diameter, as shown in Figure 3(c), was determined by subtracting from the bottom to top wall edges. The arterial diameter changed from 3.7 to 4.4 mm during the cardiac cycle.
Fig. 3.
(a) Time vs. vascular wall shear rate during recording time (in 2.9 s), (b) time vs. top and bottom vascular wall edges during recording time (in 2.9 s) and (c) time vs. arterial diameter during recording time (in 2.9 s). (N1, without cuff)
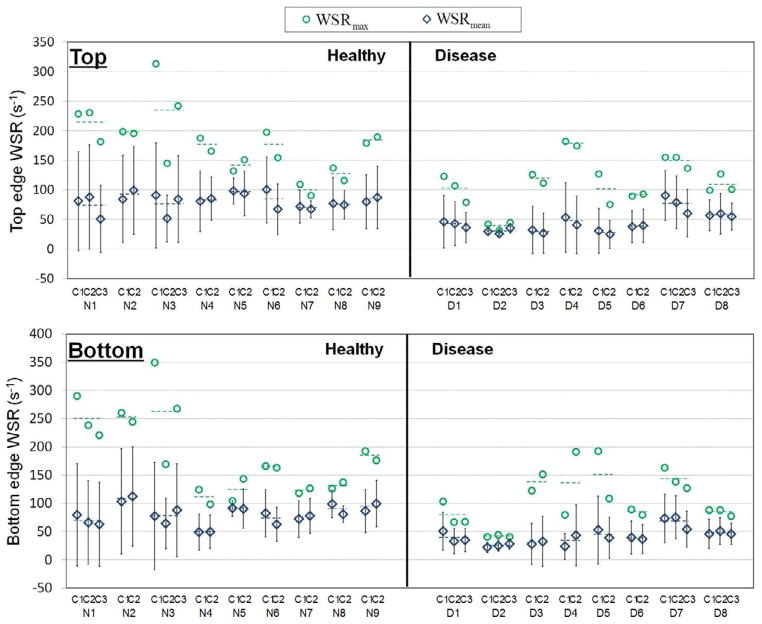
Figure 4 shows the WSRmean and WSRmax in each cardiac cycle for nine healthy and eight renal disease (six CKD and two ESRD) subjects at the top and bottom wall edges. The WSRmean and WSRmax are represented as open green diamond and blue circle symbols, respectively. The dashed line represents the and of the two or three cardiac cycles for each subject.
Fig. 4.
Mean vascular wall shear rate (WSRmean) and maximum vascular wall shear rate (WSRmax) in each cardiac cycle during physiologic pressure for nine healthy and eight renal disease (six CKD and two ESRD) subjects from top and bottom vascular wall edges. (N1 to N9 representing healthy subjects, D1 to D6 representing CKD subjects, D7 and D8 representing ESRD subjects and C1, C2 and C3 representing cardiac cycles and dotted line representing mean values)
The and for nine healthy and eight renal disease (six CKD and two ESRD) subjects are shown in Figure 5 at top and bottom wall edges. The dashed line represents the average and for the nine healthy and eight renal disease subject groups. Both the and had normal distribution for healthy and renal disease subjects with p > 0.05. The average and were significantly different (p < 0.05)at top and bottom wall edges, as summarized in Table 3, for the healthy vs. renal disease subjects.
Fig. 5.
Mean vascular wall shear rate ( ) and maximum vascular wall shear rate ( ) averaged over cardiac cycles during physiologic pressure for nine healthy and eight renal disease (six CKD and two ESRD) subjects from top and bottom vascular wall edges. (N1 to N9 representing healthy subjects, D1 to D6 representing CKD subjects, D7 and D8 representing ESRD subjects and dotted line representing mean values)
Table 3.
The average and standard error of the mean (SEM) of average mean vascular wall shear rate ( ) and maximum vascular wall shear rate ( ) for nine healthy and eight renal disease (six CKD and two ESRD) subjects.
| Healthy (s−1) | Disease (s−1) | p | |||
|---|---|---|---|---|---|
|
|
Top | 80.96±3.03 | 43.51±5.89 | 0.00003* | |
| Bottom | 81.54±5.48 | 40.87±4.66 | 0.0001* | ||
|
|
Top | 168.8±13.4 | 111.1±14.5 | 0.01* | |
| Bottom | 173.7±19.2 | 107.0±14.0 | 0.01* | ||
p < 0.05
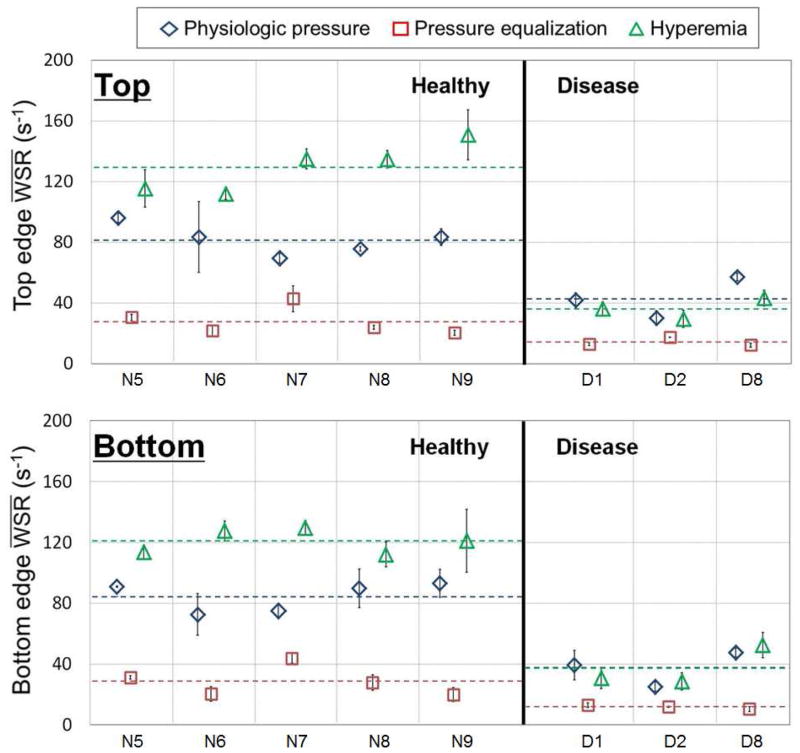
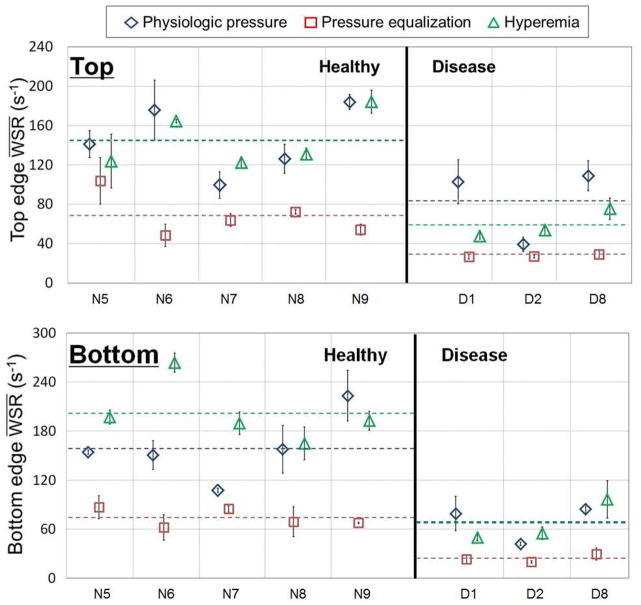
For five healthy and three renal disease (two CKD and one ESRD) subjects, the and are shown in Figure 6 and the and are shown in Figure 7 at the top and bottom wall edges. Changes from the average to the average and from the average to the average were distinctly different for the healthy and renal disease subjects as shown in Figure 7. As summarized in the t-test results in Table 4, the average and average were significant (p < 0.05) at the top and bottom edges for the healthy vs. renal disease subjects. On the contrary, the average and were not significantly different for the healthy and renal disease subjects at top and bottom, as summarized in Table 5.
Fig. 6.
Mean physiologic pressure ( ), mean pressure equalization ( ) and mean hyperemia vascular wall shear rate ( ) averaged over cardiac cycles for five healthy and three renal disease (two CKD and one ESRD) subjects from top and bottom vascular wall edges. (N5 to N9 representing healthy subjects, D1 and D2 representing CKD subjects, D8 representing ESRD subjects and dotted line representing mean values)
Fig. 7.
Max physiologic pressure ( ), max pressure equalization ( ) and max hyperemia vascular wall shear rate ( ) averaged over cardiac cycles for five healthy and three renal disease (two CKD and one ESRD) subjects from top and bottom vascular wall edges. (N5 to N9 representing healthy subjects, D1 and D2 representing CKD subjects, D8 representing ESRD subjects and dotted line representing mean values)
Table 4.
The average and standard error of the mean (SEM) of average mean vascular wall shear rate ( ) change under physiologic pressure, pressure equalization and hyperemia for five healthy and three renal disease (two CKD and one ESRD) subjects.
| Healthy (s−1) | Disease (s−1) | p | |||
|---|---|---|---|---|---|
|
|
Top | 53.80±7.19 | 28.88±9.26 | 0.08 | |
| Bottom | 55.63±6.95 | 25.58±6.88 | 0.03 | ||
|
|
Top | 101.8±8.40 | 22.20±5.44 | 0.001* | |
| Bottom | 92.15±5.00 | 25.53±8.27 | 0.0003* | ||
|
|
Top | 48.00±10.0 | −6.68±3.90 | 0.004* | |
| Bottom | 36.52±7.50 | −0.06±4.30 | 0.006* | ||
p < 0.05/3≈0.02
Table 5.
The average and standard error of the mean (SEM) of average max vascular wall shear rate ( ) change under physiologic pressure, pressure equalization and hyperemia for five healthy and three renal disease (two CKD and one ESRD) subjects.
| Healthy WSR (s−1) | Disease WSR (s−1) | p | |||
|---|---|---|---|---|---|
|
|
Top | 76.88±21.4 | 56.23±22.0 | 0.551 | |
| Bottom | 84.57±21.4 | 44.49±11.1 | 0.226 | ||
|
|
Top | 76.74±20.3 | 31.58±7.71 | 0.154 | |
| Bottom | 127.6±19.1 | 43.02±12.3 | 0.02 | ||
|
|
Top | −0.14±6.99 | −24.7±20.6 | 0.215 | |
| Bottom | 42.97±25.6 | −1.47±14.0 | 0.259 | ||
p < 0.05/3≈0.02
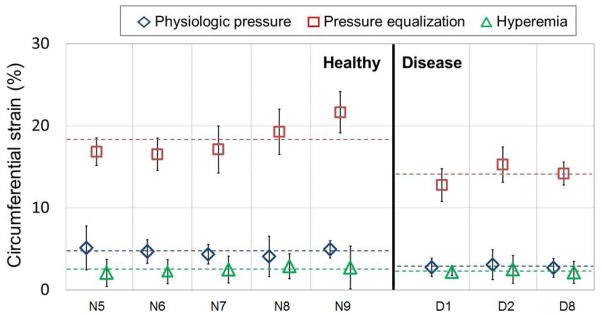
The vascular circumferential strains for physiologic pressure, pressure equalization and hyperemia were measured during the 2.9 s recording time for five healthy and three renal disease (two CKD and one ESRD) subjects. Figure 8 shows the ε̄PH, ε̄PE and ε̄Hyper. The dashed line represents the average ε̄PH, ε̄PE and ε̄Hyper. The ε̄PH, ε̄PE and ε̄Hyper had normal distributions for healthy and renal disease subjects with p > 0.05. The average ε̄PH and ε̄PE were significantly different (p < 0.05), as summarized in Table 6, for the healthy vs. renal disease subjects. Changes from the average ε̄PE to the average ε̄Hyper and from the average ε̄PH to the average ε̄Hyper were distinctly different for the healthy and renal disease subjects as shown in Figure 8. Table 7 shows that the average ε̄PE –ε̄Hyper was moderately insignificant and average ε̄PH –ε̄Hyper was significant (p<0.05) at the top and bottom edges for the healthy vs. renal disease subjects as shown by t-test performed using the Bonferroni adjustment.
Fig. 8.
Physiologic pressure (εPH), pressure equalization (εPE) and hyperemia vascular circumferential strain (εHyper) averaged over cardiac cycles for five healthy and three renal disease (two CKD and one ESRD) subjects. (N5 to N9 representing healthy subjects, D1 and D2 representing CKD subjects, D8 representing ESRD subjects and dotted line representing mean values)
Table 6.
The average and standard error of the mean (SEM) of average vascular circumferential strain (ε̄) under physiologic pressure, pressure equalization and hyperemia for five healthy and three renal disease (two CKD and one ESRD) subjects.
| Healthy ε | Disease ε | p | |
|---|---|---|---|
| ε̄PH | 4.63±0.19 | 2.83±0.12 | 0.001* |
| ε̄PE | 18.28±0.97 | 14.08±0.73 | 0.02* |
| ε̄Hyper | 2.48±0.15 | 2.17±0.02 | 0.17 |
p < 0.05
Table 7.
The average and standard error of the mean (SEM) of average vascular circumferential strain (ε̄) change under physiologic pressure, pressure equalization and hyperemia for five healthy and three renal disease (two CKD and one ESRD) subjects.
| Healthy ε | Disease ε | p | |
|---|---|---|---|
| εPE –εPH | 13.64±0.99 | 11.24±0.64 | 0.14 |
| εPE –εHyper | 15.80±0.86 | 11.91±0.73 | 0.02 |
| εPH –εHyper | 2.16±0.31 | 0.67±0.11 | 0.01* |
p < 0.05/3≈0.02
The average blood pressure for the renal disease and healthy subjects was 160/73 mmHg and 135/75 mmHg, respectively. The pulse pressure (Δp = 73±20 mmHg) of the renal disease subjects was higher than that of the healthy subject (Δp = 59±11mmHg). The arterial wall elasticity changed from 0.7 to 3.5 kPa and from 0.4 to 1.7 kPa from physiologic pressure to pressure equalization for the renal disease and healthy subjects, respectively. This arterial wall elasticity change was significantly different (p < 0.05) for the renal disease and healthy subjects. Thus, the differences in elastic properties between the renal disease and healthy subjects became more pronounced when measured in the low-preload region using pressure equalization as shown in Figure 8.
DISCUSSIONS AND CONCLUSIONS
This study demonstrated that healthy subjects have significantly higher and than renal disease (CKD and ESRD) subjects. The findings were substantiated by using analysis from both top and bottom vascular wall edges. The average was also significantly higher for healthy subjects compared with renal disease subjects, again at both the top and bottom wall edges (p= 0.004 and 0.006, respectively). The healthy subjects had significantly higher ε̄PH and ε̄PE than renal disease (CKD and ESRD) subjects. The ε̄PE –ε̄Hyper and ε̄PH –ε̄Hyper was also distinctively different between the healthy subjects and renal disease (CKD and ESRD) subjects (p= 0.02 and 0.01, respectively). Although this is a small clinical study, an interesting observation is that the WSR and vascular circumferential strain were both found to be significantly different between the study groups. Since the WSR is thought to be an important underlying physical stimulus for vascular dilation it may represent an important indicator for disease, worthy of further study. Since the vascular wall elasticity plays a crucial role in vascular dilation, the vascular wall elasticity measurements may strengthen the assessment of vascular disease in addition to the WSR measurements. Furthermore, these results suggest that using the appropriate measurement and analysis vehicle, WSR and circumferential strain may be practical and robust measurements to determine the vascular sequelae of renal disease or vascular disease in association with renal disease. Important also in interpreting the results of this study, is to recognize that our renal disease group had a high prevalence of vascular disease, which is common for these patients. Knowing this, these results suggest that this measurement method should be tested in future studies in other patient populations with known vascular disease to see if these results are reproducible in other settings. Should these findings be reproducible, this method could potentially provide cardiovascular disease risk stratification.
An additional observation is that a real-time scanner that provides WSR and velocity profiles would be an improvement for future clinical studies to further test the benefits of speckle decorrelation in comparison with Doppler methods. This would allow assessment of velocity information obtained perpendicular to flow, including flow measurements at vessel wall edge, compared directly with Doppler measurements that may be less accurate in detecting small frequency shifts at low flow rates near the vessel edge.
One significant limitation of this study is in our assumption for calculation purposes that the artery is circular in cross section so that the circumferential strain can be computed from two vascular wall edges. Since the artery is not perfectly circular over the entire pressure equalization cycle, this assumption is not completely correct. However, this circumferential strain calculation is an appropriate first order component of strain and not likely to introduce significant error with small deformation under physiologic pressure. These effects will require additional study in the future.
One limitation of the speckle decorrelation method in measuring flow velocity is that the maximum measurable flow velocity is restricted by the maximal frame rate and the beam correlation width. When the speckle movement during the time interval between two consecutive firings of the transducer exceeds the beam correlation width, complete loss of correlation occurs (Rubin et al. 2001). In this study, the limit for accurate decorrelation measurement of flow velocity was about 100 mm/s, which was determined by the beam correlation width (about 0.3 mm) and the acoustic frame rate (348 Hz). Since we were measuring the flow velocity close to the wall, where the velocity is much lower than in the middle of the vessel, and using relatively high frame rates (348Hz), we did not experience this limitation in measuring the WSR. However, this will need to be considered for translation of this method into clinical practice.
In addition to these limitations, we also encountered wall edge detection problems using our automated 2nd order gradient algorithm due to the well documented echogenicity problem during slow or stagnant flow caused by aggregation of red blood cells (Cloutier et al. 1996; Qin et al. 1998). However, since we were able to sample at a very high frame rate, statistical methods, such as standard error and interpolation, were manually used to minimize this measurement error. We are currently working on methods to automate this measurement noise reduction method.
In summary, this report describes a potentially robust method for vascular assessment based on the WSR and vascular circumferential strain. This method was tested in a clinical pilot study showing significant differences in measurements between disease and control study subjects. Further clinical study is necessary to evaluate the application of these measurements for diagnosis of vascular disease, cardiovascular disease and chronic kidney disease.
Acknowledgments
This work was supported in part by NIH grant 2R44EB007842 and a grant from the Renal Research Institute. Software and imaging system support were provided by Epsilon Imaging.
Footnotes
Publisher's Disclaimer: This is a PDF file of an unedited manuscript that has been accepted for publication. As a service to our customers we are providing this early version of the manuscript. The manuscript will undergo copyediting, typesetting, and review of the resulting proof before it is published in its final citable form. Please note that during the production process errors may be discovered which could affect the content, and all legal disclaimers that apply to the journal pertain.
References
- Angelantonio ED, Chowdhury R, Sarwar N, Aspelund T, Danesh J, Gudnason V. Chronic kidney disease and risk of major cardiovascular disease and non-vascular mortality: prospective population based cohort study. BMJ. 2010;341:c4986. doi: 10.1136/bmj.c4986. [DOI] [PMC free article] [PubMed] [Google Scholar]
- Bamber J, Hasan P, Cook-Martin G, Bush N. Parametric imaging of tissue shear and flow using B-scan decorrelation rate. J Ultrasound Med. 1988;7:S135. [Google Scholar]
- Bambi G, Morganti T, Ricci S, Boni E, Guidi F, Palombo C, Tortoli P. A novel ultrasound instrument for investigation of arterial mechanics. Ultrasonics. 2004;42:731–737. doi: 10.1016/j.ultras.2003.11.008. [DOI] [PubMed] [Google Scholar]
- Bilato C, Crow MT. Atherosclerosis and vascular biology of aging. Aging (Milano) 1996;8:221–234. doi: 10.1007/BF03339572. [DOI] [PubMed] [Google Scholar]
- Bischoff JE, Arruda EM, Grosh K. A microstructurally based orthotropic hyperelastic constitutive law. Trans ASME J Appl Mech. 2002;69:570–579. [Google Scholar]
- Brands PJ, Hoeks APG, Hofstra L, Reneman RS. A noninvasive method to estimate wall shear rate using ultrasound. Ultrasound Med Biol. 1995;21(2):171–185. doi: 10.1016/s0301-5629(94)00111-1. [DOI] [PubMed] [Google Scholar]
- Bruel A, Oxlund H. Changes in biomechanical properties, composition of collagen and elastin, and advanced glycation endproducts of the rat arota in relation to age. Atherosclerosis. 1996;127:155–165. doi: 10.1016/s0021-9150(96)05947-3. [DOI] [PubMed] [Google Scholar]
- Cloutier G, Qin Z, Durand LG, Teh BG. Power Doppler ultrasound evaluation of the shear rate and shear stress dependences of red blood cell aggregation. IEEE Trans Biomed Eng. 1996;43:441–450. doi: 10.1109/10.488792. [DOI] [PubMed] [Google Scholar]
- Corretti MC, Anderson TJ, Benjamin EJ, Celermajer D, Charbonneau F, Creager MA, Deanfield J, Drexler H, Gerhard-Herman M, Herrington D, Vallance P, Vita J, Vogel R. Guidelines for the ultrasound assessment of endothelial-dependent flow-mediated vasodilation of the brachial artery: a report of the international brachial artery reactivity task force. J Am Coll Cardiol. 2002;39:257–265. doi: 10.1016/s0735-1097(01)01746-6. [DOI] [PubMed] [Google Scholar]
- Faury G. Function-structure relationship of elastic arteries in evolution: From microfibrils to elastin and elastic fibres. Pathol Biol. 2001;49:310–325. doi: 10.1016/s0369-8114(01)00147-x. [DOI] [PubMed] [Google Scholar]
- Galil AGS, Pinheiro HS, Chaoubah A, Costa DMN, Bastos MG. Chronic kidney disease increases cardiovascular unfavourable outcomes in outpatients with heart failure. BMC Nephrology. 2009;10:31. doi: 10.1186/1471-2369-10-31. [DOI] [PMC free article] [PubMed] [Google Scholar]
- Gill RW. Measurement of blood flow by ultrasound: Accuracy and sources of error. Ultrasound Med Biol. 1985;11:625–641. doi: 10.1016/0301-5629(85)90035-3. [DOI] [PubMed] [Google Scholar]
- Gnasso A, Carallo C, Irace C, et al. Association between intima-media thickness and wall shear stress in common carotid arteries in healthy male subjects. Circulation. 1996;94(12):3257–3262. doi: 10.1161/01.cir.94.12.3257. [DOI] [PubMed] [Google Scholar]
- Gocke N, Keaney JF, Hunter LM, Watkins MT, Menzoian JO, Vita JA. Risk stratification for postoperative cardiovascular events via noninvasive assessment of endothelial function: a prospective study. Circulation. 2002;105:1567–1572. doi: 10.1161/01.cir.0000012543.55874.47. [DOI] [PubMed] [Google Scholar]
- Humphrey JD. Continuum biomechanics of soft biological tissues. Proc R Soc. 2003;A459:3–46. [Google Scholar]
- Humphrey JD, Na S. Elastodynamics and arterial wall stress. Ann Biomed Eng. 2002;30:509–523. doi: 10.1114/1.1467676. [DOI] [PubMed] [Google Scholar]
- Irace C, Cortese C, Fiaschi E, Caralllo C, Farinaro E, Gnasso A. Wall shear stress is associated with intima-media thickness and carotid atherosclerosis in subjects at low coronary heart disease risk. Stroke. 2004;35:464–468. doi: 10.1161/01.STR.0000111597.34179.47. [DOI] [PubMed] [Google Scholar]
- Kim K, Weitzel WF, Rubin JM, Xie H, Chen X, O’Donnell M. Vascular intramural strain imaging using arterial pressure equalization. Ultrasound Med Biol. 2004;30:761–71. doi: 10.1016/j.ultrasmedbio.2004.04.003. [DOI] [PubMed] [Google Scholar]
- Ku DN. Blood flow in arteries. Annu Rev Fluid Mech. 1997;29:399–434. [Google Scholar]
- Kuvin JT, Patel RR, Sliney KA, Pandian NG, Rand WM, Udelson JE, Karas RH. Peripheral vascular endothelial function testing as a noninvasive indicator of coronary artery disease. J Am Coll Cardiol. 2001;38:1843–1849. doi: 10.1016/s0735-1097(01)01657-6. [DOI] [PubMed] [Google Scholar]
- Levenson J, Pessana F, Gariepy J, Armentano R, Simon A. Gender differences in wall shear-mediated brachial artery vasoconstriction and vasodilation. J Am Coll Cardiol. 2001;38:1669–1674. doi: 10.1016/s0735-1097(01)01604-7. [DOI] [PubMed] [Google Scholar]
- Li W, van der Steen AFW, Lancée CT, Céspedes I, Nicolaas B. Blood flow imaging and volume flow quantitation with intravascular ultrasound. Ultrasound Med Biol. 1998;24(2):203–214. doi: 10.1016/s0301-5629(97)00275-5. [DOI] [PubMed] [Google Scholar]
- Lou Z, Yang WJ, Stein PD. Errors in the estimation of arterial wall shear rates that result from curve fitting of velocity profiles. J Biomech. 1993;25:383–390. doi: 10.1016/0021-9290(93)90002-v. [DOI] [PubMed] [Google Scholar]
- Lubinski MA, Emelianov SY, O’Donnell M. Speckle tracking methods for ultrasonic elasticity imaging using short time correlation. IEEE Trans Ultrason Ferroelec Freq Control. 1999;46:82–96. doi: 10.1109/58.741427. [DOI] [PubMed] [Google Scholar]
- Lupotti FA, Mastik F, Carlier SG, de Korte CL, van der Giessen W, Serruys PW, van der Steen AFW. Quantitative IVUS blood flow: validation in vitro, in animals and in patients. Ultrasound Med Biol. 2003;29(4):507–515. doi: 10.1016/s0301-5629(02)00774-3. [DOI] [PubMed] [Google Scholar]
- Mahmoud AM, Frisbee JC, D’Audiffret A, Mukdadi OM. In vivo vascular wall tissue characterization using a strain tensor measuring (STM) technique for flow-mediated vasodilation analyses. Phys Med Biol. 2009;54:6217–6238. doi: 10.1088/0031-9155/54/20/012. [DOI] [PubMed] [Google Scholar]
- Modena MG, Bonetti L, Coppi F, Bursi F, Rossi R. Prognostic role of reversible endothelial dysfunction in hypertensive postmenopausal women. J Am Coll Cardiol. 2002;40:505–510. doi: 10.1016/s0735-1097(02)01976-9. [DOI] [PubMed] [Google Scholar]
- Neunteufl T, Heher S, Katzenschlager R, Wolfl G, Kostner G, Maurer G, Weidinger F. Late prognostic value of flow-mediated dilation in the brachial artery of patients with chest pain. Am J Cardiol. 2000;86:207–210. doi: 10.1016/s0002-9149(00)00857-2. [DOI] [PubMed] [Google Scholar]
- Perticone F, Ceravolo R, Puji A, Ventura G, Iacopino S, Scozzafva A, Ferraro A, Chello M, Mastroroberto P, Verdechhia P, Schillaci G. Prognostic significance of endothelial dysfunction in hypertensive patients. Circulation. 2001;104:191–196. doi: 10.1161/01.cir.104.2.191. [DOI] [PubMed] [Google Scholar]
- Park DW, Richards MR, Rubin JM, Hamilton J, Kruger GH, Weitzel WF. Arterial elasticity imaging: comparison of finite-element analysis models with high-resolution ultrasound speckle tracking. Cardiovascular Ultrasound. 2010;8:22. doi: 10.1186/1476-7120-8-22. [DOI] [PMC free article] [PubMed] [Google Scholar]
- Pyke KE, Tschakovsky ME. The relationship between shear stress and flow-mediated dilatation: implications for the assessment of endothelial function. J Physiol. 2005;568(2):357–369. doi: 10.1113/jphysiol.2005.089755. [DOI] [PMC free article] [PubMed] [Google Scholar]
- Qin Z, Durand LG, Allard L, Cloutier G. Effects of a sudden flow reduction on red blood cell rouleau formation and orientation using RF backscattered power. Ultrasound Med Biol. 1998;24:503–511. doi: 10.1016/s0301-5629(98)00019-2. [DOI] [PubMed] [Google Scholar]
- Rubin JM, Fowlkes JB, Tuthill TA, Moskalik AP, Rhee RT, Adler RS, Kazanjian S, Carson PL. Speckle decorrelation flow measurement with B-mode US of contrast agent flow in a phantom and in rabbit kidney. Radiology. 1999;213:429–437. doi: 10.1148/radiology.213.2.r99nv14429. [DOI] [PubMed] [Google Scholar]
- Rubin JM, Tuthill TA, Fowlkes JB. Volume flow measurement using Doppler and grey-scale decorrelation. Ultrasound Med Biol. 2001;27:101–109. doi: 10.1016/s0301-5629(00)00291-x. [DOI] [PubMed] [Google Scholar]
- Samijo SK, Willigers JM, Barkhuysen R, et al. Wall shear stress in the common carotid artery as function of age and gender. Cardiovasc Res. 1998;39:515–522. doi: 10.1016/s0008-6363(98)00074-1. [DOI] [PubMed] [Google Scholar]
- Schiffrin EL, Lipman ML, Mann JFE. Chronic kidney disease: effects on the cardiovascular system. Circulation. 2007;116:85–97. doi: 10.1161/CIRCULATIONAHA.106.678342. [DOI] [PubMed] [Google Scholar]
- Stroev PV, Hoskins PR, Easson WJ. Distribution of wall shear rate throughout the arterial tree: A case study. Atherosclerosis. 2007;191:276–280. doi: 10.1016/j.atherosclerosis.2006.05.029. [DOI] [PubMed] [Google Scholar]
- Toborek M, Kaiser S. Endothelial cell functions: relationship to atherogenesis. Basic Res Cardiol. 1999;94:295–314. doi: 10.1007/s003950050156. [DOI] [PubMed] [Google Scholar]
- Tortoli P, Morganti T, Bambi G, Palombo C, Ramnarine KV. Noninvasive simultaneous assessment of wall shear rate and wall distention in carotid arteries. Ultrasound Med Biol. 2006;32(11):1661–1670. doi: 10.1016/j.ultrasmedbio.2006.07.023. [DOI] [PubMed] [Google Scholar]
- Tortoli P, Palombo C, Ghiadoni L, Bini G, Francalanci L. Simultaneous ultrasound assessment of brachial artery shear stimulus and flow-mediated dilation during reactive hyperemia. Ultrasound Med Biol. 2011;37(10):1561–1570. doi: 10.1016/j.ultrasmedbio.2011.06.001. [DOI] [PubMed] [Google Scholar]
- Vito RP, Dixon SA. Blood vessel constitutive models—1995–2002. Annu Rev Biomed Eng. 2003;5:413–439. doi: 10.1146/annurev.bioeng.5.011303.120719. [DOI] [PubMed] [Google Scholar]
- Weitzel WF, Kim K, Rubin JM, Xie H, O’Donnell M. Renal advances in ultrasound elasticitiy imaging: Measuring the compliance of arteries and kidneys in end-stage renal disease. Blood Purif. 2005;23:10–17. doi: 10.1159/000082005. [DOI] [PubMed] [Google Scholar]
- Wu SP, Ringgaard S, Oyre S, Hansen MS, Rasmus S, Pedersen EM. Wall shear rates differ between the normal carotid, femoral and brachial arteries: An in vivo MRI study. J Magn J Magn Resonance Imag. 2004;19:188–193. doi: 10.1002/jmri.10441. [DOI] [PubMed] [Google Scholar]
- Zhao SZ, Ariff B, Long Q, et al. Interindividual variations in wall shear stress and mechanical stress distributions at the carotid artery bifurcation of healthy humans. J Biomech. 2002;35:1367–1377. doi: 10.1016/s0021-9290(02)00185-9. [DOI] [PubMed] [Google Scholar]


