Abstract
LF-3-88 (2-[5-[5-(2(S)-azetidinylmethoxyl)-3-pyridyl]-3-isoxazolyl] ethanol) was identified as a highly selective α4β2-nAChRs partial agonist, with a Ki value of 0.4 nM and EC50 value of 110 nM. A sensitive and selective ultra high pressure liquid chromatography-tandem mass spectrometry (UHPLC-MS-MS) method was developed and validated to study the pharmacokinetics profile of this compound in mice. Protein precipitation with acetonitrile was used to prepare the plasma and brain samples, and the recovery was greater than 90%. The inter-day and intra-day accuracy and precision of the quantitative method ranged from 95 % to 106 % for plasma and from 93 % to 105 % for brain homogenates. The precision of the assay was <10 %. The limit of detection and limit of quantitation were 0.5 ng/mL (1.8 nM) and 1 ng/mL (3.6 nM), respectively. LF-3-88 was stable (>93 %) for 24 h on the bench top at room temperature, and for at least 3 weeks at 4 °C and −80 °C. The UHPLC-MS-MS assay was applied to the measurement of plasma and brain levels of LF-3-88 following oral administration to male Balb/c mice. Plasma concentrations of LF-3-88 and brain levels were dose-dependent with half-lives of approximately 60 min and 180 min, respectively, indicating good oral bioavailability and penetration of the blood-brain barrier.
Keywords: α4β2-nAChRs partial agonist, Antidepressant, UHPLC-MS-MS Pharmacokinetics, Quantitative analysis
Introduction
Neuronal nicotinic acetylcholine receptors (nAChRs) belong to the ligand-gated ion channel super-family of neurotransmitter receptors, which are widely distributed in both the central and peripheral nervous systems. They are pentamers assembled from varying combinations of subunits (α2–α10, β2–β4) with a broad range of pharmacological properties [1]. nAChRs in the brain play important roles not only in the mediation of classical cholinergic neurotransmission at selected loci, but also in the modulation of neurotransmission by other chemical messengers, including monoamines dopamine, norepinephrine and serotonin [2]. The α4β2*-nAChRs (note that “*” indicates subunits other than those specified are possible partners in the closed assembly) are the most widely expressed nAChRs subtype in the brain. Previous studies have shown that blockade (antagonism or receptor desensitization) of α4β2-nAChRs results in antidepressant-like effects [3–9]. Highly selective α4β2-nAChRs partial agonists are regarded as promising antidepressant medications, especially for patients who do not respond to selective serotonin reuptake inhibitors (SSRIs) [10–14].
LF-3-88 (2-[5-[5-(2(S)-azetidinylmethoxyl)-3-pyridyl]-3-isoxazolyl]ethanol) (Figure 1) was identified as a highly selective α4β2-nAChRs partial agonist, with a Ki value of 0.4 nM and EC50 value of 110 nM [15]. Its antidepressant-like effects were confirmed in the mouse forced swim test, where it was found to be orally active at 1 mg/kg. To evaluate the pharmacokinetics profile of LF-3-88, male Balb/c mice were treated with LF-3-88 orally at 5 or 10 mg/kg. A selective and sensitive analytical method was required to determine the plasma and brain concentrations of LF-3-88, and therefore we developed and validated a quantitative method based on UHPLC-MS-MS as described herein.
Figure 1.
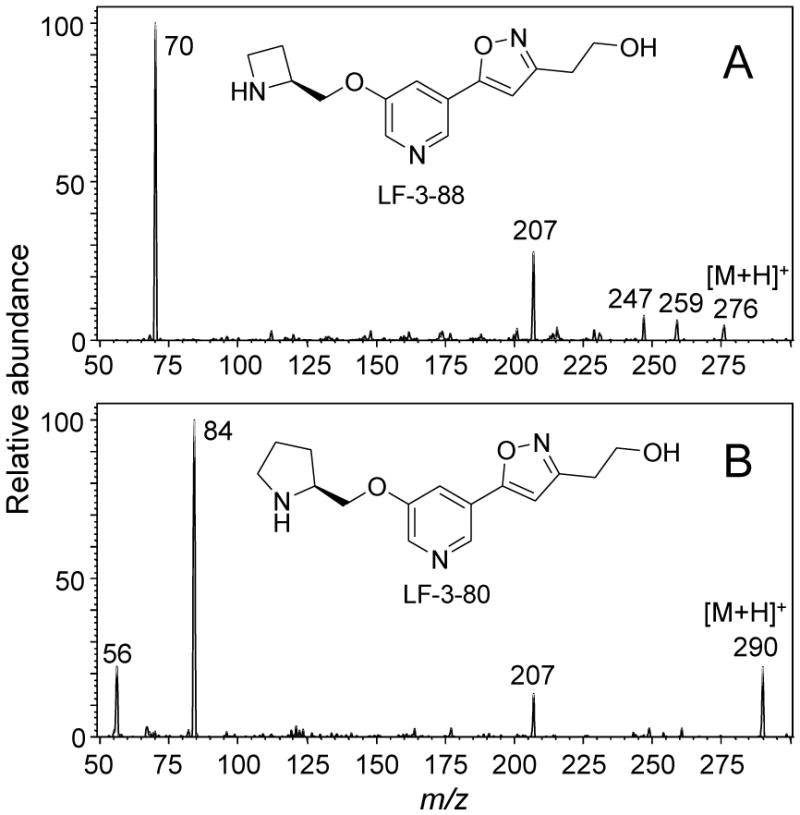
Positive ion electrospray product ion tandem mass spectra of the protonated molecules of A) LF-3-88 and B) LF-3-80.
1. Experimental
1.1 Reagents and chemicals
Solvents including acetonitrile, methanol and water were LC-MS grade and purchased from Fisher Scientific (Fair Lawn, NJ). Formic acid was purchased from Sigma-Aldrich (St. Louis, MO). LF-3-88 and LF-3-80 (Figure 1) were synthesized as described previously [15]. Blank mouse plasma and brain tissue were obtained from PsychoGenics (Tarrytown, NY).
1.2 In vivo administration of LF-3-88 to mice
Male Balb/c/7 mice (8 weeks, 3 animals per group) were administered LF-3-88 in water orally at 5 or 10 mg/kg of free base. The control group received water (vehicle) only. At appropriate time points after dosing, mice were decapitated and trunk blood was collected in Eppendorf microcentrifuge tubes (1.5 mL) containing K2-EDTA and kept on ice for short term storage. Within 15 min, the tubes were centrifuged for 10 min at 10,000–12,000 × g in a refrigerated centrifuge. Plasma was removed and stored in a −80 °C freezer until analysis. For brain tissues, whole brains were collected from decapitated mice in Nalgene 1.2 mL CryoVials on dry ice. Samples were stored at −80 °C until analysis.
2.3 Sample preparation
After thawing at room temperature, plasma (50 μL) was transferred to a 1.5 mL Eppendorf tube and mixed with 200 μL of acetonitrile containing LF-3-80 (10 ng/mL) as an internal standard. LF-3-80 was selected as an internal standard due to its structural similarity to LF-3-88 (Figure 1). The mixture was vortexed vigorously for 2 min and centrifuged for 15 min at 13,000 × g at 4 °C. A 210 μL aliquot of the supernatant was transferred to a new Eppendorf tube and evaporated to dryness under a stream of nitrogen. The residue was reconstituted in 50 μL of 10% aqueous methanol, and 10 μL was injected onto the UHPLC-MS-MS for analysis.
Brain tissue was weighed accurately and transferred to a 15 mL tube. A 3 mL aliquot of 50 % aqueous methanol (containing 0.1 % formic acid) was added to the tube, and the tissue was homogenized for 1 min. Acetonitrile (400 μL) containing 10 ng/mL of LF-3-80 was added to the homogenate, and the mixture was vortexed vigorously for 2 min. After centrifugation for 15 min at 13,000 × g at 4 °C, 500 μL of the supernatant was transferred to a new Eppendorf tube and evaporated to dryness under a stream of nitrogen. The residue was reconstituted in 100 μL of 10 % aqueous methanol, and 5 μL was injected onto the UHPLC-MS-MS for quantitative analysis.
2.4 Calibration curve and quality controls
LF-3-88 stock solution was prepared in water at a final concentration of 5 mg/mL and stored in amber glass vials. Working standards were made by serial dilution from stock solutions using water as diluent. Quality control (QC) stock solutions were prepared from a separate weighing of the reference standards and stored at 4 °C. For plasma, calibration standards and QC samples were prepared by mixing 5 μL of each working standard or QC solution with 45 μL blank plasma and mixed well before protein precipitation. The concentrations of LF-3-88 used for the 8-point plasma standard curve were 1, 2, 5, 10, 50, 100, 250, and 500 ng/mL. Protein precipitation was carried out using 200 μL acetonitrile containing 10 ng/mL of LF-3-80 as an internal standard. For brain tissue, calibration standards and QC samples were prepared by mixing 20 μL of each working standard or QC solution with 180 μL of blank brain homogenate and mixed well. The concentrations of LF-3-88 used for the 7-point brain tissue standard curve were 1, 2, 5, 10, 50, 100, and 250 ng/mL. Acetonitrile (400 μL) containing LF-3-80 (10 ng/mL) was added to precipitate proteins, and the samples was prepared as described above.
2.5 UHPLC-MS-MS
LF-3-88 was measured using UHPLC-MS-MS on a Shimadzu Nexera UHPLC interfaced with a Shimadzu LCMS-8030 triple quadrupole mass spectrometer (Kyoto, Japan). Analytes were separated on a Shimadzu Shim-pack XR-ODS III UHPLC column (2.0 × 50 mm, 1.6 μm) using a 1.5 min linear gradient from 10–50 % acetonitrile in 0.2 % aqueous formic acid. After holding at 50 % acetonitrile for 0.5 min, the column was re-equilibrated at 10 % acetonitrile for 2 min before the next injection. The total run time including equilibration was 4 min. The flow rate was 0.5 mL/min, the column oven temperature was 50 °C, and the autosampler temperature was 4°C. LF-3-88 and internal standard LF-3-80 were measured using positive ion electrospray mass spectrometry with collision-induced dissociation and selected reaction monitoring (SRM). Two SRM transitions (quantifier and qualifier) were monitored for each compound with a dwell time of 50 ms/ion as follows: LF-3-88, m/z 276 to 70 and m/z 276 to 207; and LF-3-80, m/z 290 to 84. The DL temperature was 300 °C, the spray voltage was 4500 V, the nebulizing gas flow was 3 L/min, and the drying gas flow was 20 L/min.
2.6 Method validation
Method validation was carried out in accordance with the US Food and Drug Administration (FDA) guidelines for bioanalytical method validation [16]. Intra-day assay accuracy and precision were determined by measuring 6 replicates at low, medium, and high concentrations, and inter-day precision was measured by comparing 3 sets of QC samples analyzed on 3 consecutive days. The specificity of the assay was evaluated by analyzing 3 different lots of blank mouse plasma for possible chromatographic interference. Any peak detected using SRM at the retention time of the corresponding analyte with an area greater than 20 % of the analyte (5 % for the internal standard) at the LLOQ (lower limit of quantification) was considered significant interference. The LLOQ was defined as the lowest standard on the calibration curve giving an analyte response of >5-times that of a blank with a precision within 20% and an accuracy of 80–120%.
Recovery was determined at 3 concentrations using 3 replicates and was calculated by comparing the peak area ratios of the analyte/internal standard in the extracted samples with blank matrix spiked after extraction. Internal standards were post-spiked into both the extracted samples and the extracted matrix blanks. Matrix effects were investigated by injecting a prepared pooled blank plasma sample or blank brain homogenate sample onto the UHPLC-MS-MS system and post-column infusing 500 ng/mL LF-3-88 at 100 μL/min.
Bench top stabilities of LF-3-88 in plasma and brain homogenate were assessed using low and high QC samples (n = 6) that were stored on the bench top at room temperature for 24 h. Short-term stability was determined using low and high QC samples (n = 6) that were stored at 4 °C for 7 days, and long-term stability was determined after storage at −80 °C for 3 weeks. All stability results were compared with those of freshly prepared QC samples.
2.7 Quantification, data analysis and pharmacokinetics
Calibration curves were constructed by plotting the peak area ratio for LF-3-88 and its internal standard LF-3-80 versus the corresponding concentration and fitting a linear regression equation to the data. A weighting factor of 1/x was applied to the calibration curve. Data analysis was carried out using Shimadzu Labsolution software and Microsoft Excel. Pharmacokinetic parameters were calculated using WinNonlin 6.2 (Pharsight, Mountain View, CA) based on non-compartmental analysis. Pharmacokinetic parameters for LF-3-88 were generated for each group (3 mice per dosage group) and expressed as mean ± SD using a non-compartmental model. The area under the curve (AUC) was calculated using the log-linear trapezoidal rule. Plasma half-life was determined based on the terminal elimination constant by linear regression analysis.
2. Results and Discussion
2.1 Method validation
During positive ion electrospray, LF-3-88 and LF-3-80 formed abundant protonated molecules of m/z 276 and m/z 290, respectively. Their product ion tandem mass spectra with collision-induced dissociation are shown in Figure 1. The two most abundant product ions of LF-3-88 during MS-MS were observed at m/z 207 and m/z 70, corresponding to the loss of a 2-methylazetidinyl group, [MH-69]+, or to a 2-methylazetidine cation, respectively. Since the product ion m/z 70 was the base peak of the product ion tandem mass spectrum of LF-3-88, the SRM transition of m/z 276 to m/z 70 was used as the quantifier for UHPLC-MS-MS quantitative analysis. The SRM transition of m/z 276 to m/z 207 was used as the qualifier. During UHPLC-MS-MS, LF-3-88 eluted at 0.78 min (Figure 2).
Figure 2.
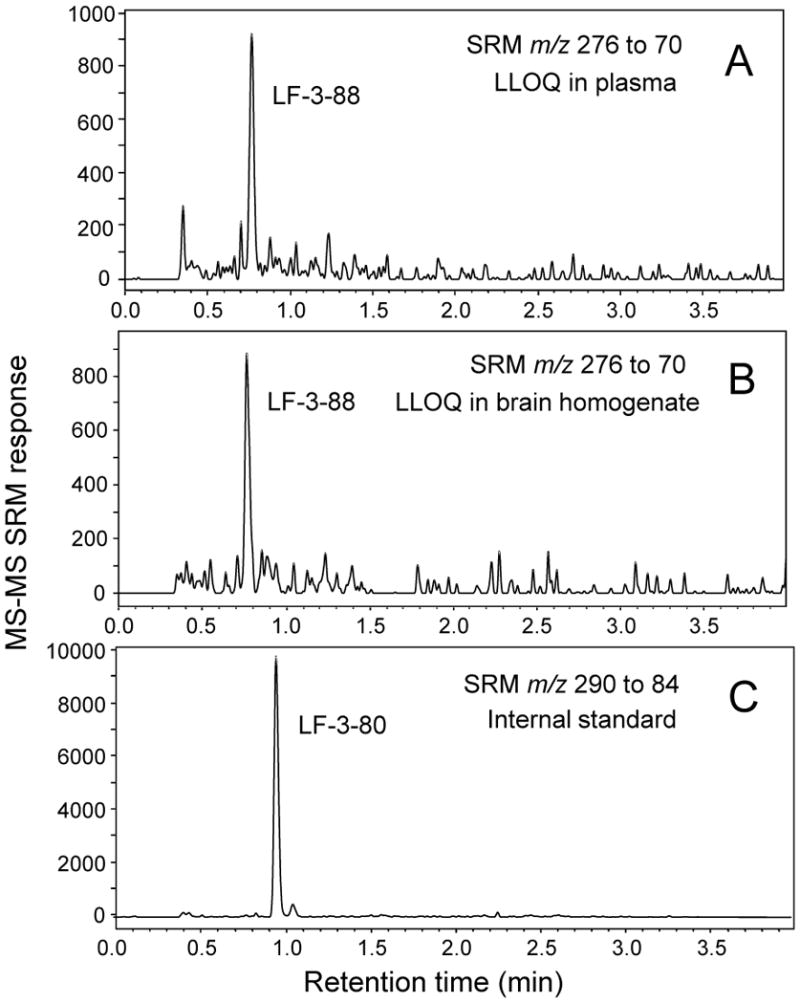
Positive ion electrospray UHPLC-MS-MS SRM chromatograms of A) LF-3-88 in plasma at the LLOQ of 1 ng/mL (3.6 nM); B) LF-3-88 in brain homogenate at the LLOQ of 1 ng/mL (3.6 nM); and C) LF-3-80 (internal standard).
The fragmentation pattern of the internal standard LF-3-80 was similar to that of LF-3-88, and the product ion of m/z 84 was the base peak in the positive ion product ion tandem mass spectrum of the protonated molecule of m/z 290 (Figure 1). Therefore during UPHLC-MS-MS, the SRM transition of m/z 290 to m/z 84 was monitored for the internal standard LF-3-80. LF-3-80 eluted at a retention time of 0.95 min (Figure 2).
The limit of detection (signal/noise ratio of 3) and LLOQ for LF-3-88 were 0.5 ng/mL (1.8 nM) and 1 ng/mL (3.6 nM), respectively, in both plasma and brain homogenate. The calibration curve was linear over the ranges of 1–500 ng/mL for plasma and 1–250 ng/mL for brain homogenate (r2 > 0.99). Three different lots of blank mouse plasma and brain from untreated mice were checked for chromatographic interference. No peaks were detected at 0.78 min and 0.95 min, which were the retention times of LF-3-88 and internal standard LF-3-80, respectively (data not shown).
Protein precipitation was used for both plasma and brain tissue preparation because it is a simple and fast procedure that usually provides good recovery of the analyte. Recoveries of LF-3-88 from plasma and brain homogenates were evaluated at low (3 ng/mL), medium (40 ng/mL) and high (400 ng/mL for plasma and 200 ng/mL for brain homogenate) concentrations. After protein precipitation, the recoveries of LF-3-88 from plasma were 97 %, 102 % and 96 %. The recoveries of LF-3-88 from brain homogenates were 96 %, 91 % and 99 %.
Since co-eluting matrix compounds might suppress or enhance the analyte signal, the potential for matrix effects was evaluated. Blank pooled mouse plasma or brain homogenates were prepared as described in section 2.3 and then analyzed using UHPLC-MS-MS as described in section 2.5 except that LF-3-88 (500 ng/mL, 1.8 μM) was infused continuously into the mobile phase post-column. As indicated in the chromatograms in Figure 3, no matrix interference was observed at the retention time of LF-3-88 (0.78 min).
Figure 3.
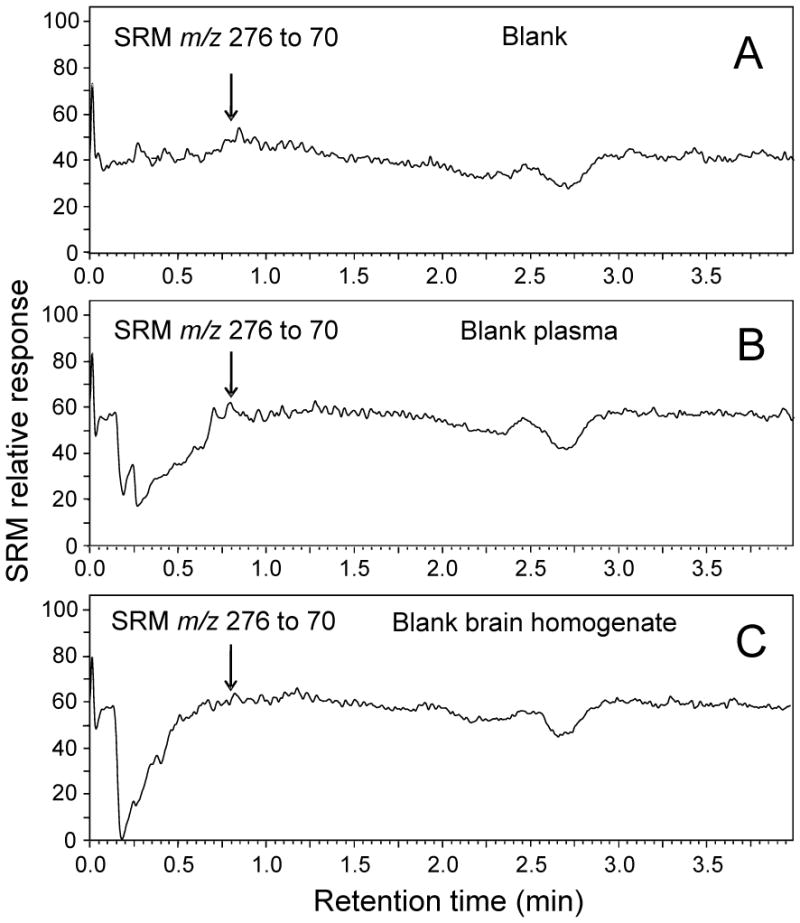
UHPLC-MS-MS analyses of LF-3-88 infused continuously at 500 ng/mL during injections of A) blank solvent; B) extracted blank plasma; and C) extracted blank brain homogenate. Note the absence of matrix effects at 0.78 min which would be the retention time of LF-3-88.
Intra-day and inter-day precision and accuracy of the UHPLC-MS-MS method are summarized in Table 1. The accuracy was defined as the percentage of the mean of multiple measurements of 3 concentrations of QCs in plasma and brain homogenates. The 3 concentrations included 3 ng/mL (3-fold the LLOQ value of 1 ng/mL), 40 ng/mL and 400 ng/mL. All of the intra-day and inter-day precision and accuracy values were within 15 % of the expected values indicating that the assay was accurate and precise with good reproducibility for the quantitation of LF-3-88 in both mouse plasma and brain homogenates.
Table 1.
Inter-day and intra-day reproducibility of UHPLC-MS-MS quantitation of LF-3-88 in mouse plasma and brain tissue.
| Concentration (ng/mL) | Intra-day (n=6)a | Inter-day (n=18) | ||
|---|---|---|---|---|
|
| ||||
| Accuracy (%) | CV (%) | Accuracy (%) | CV (%) | |
| Plasma | ||||
|
| ||||
| 3 | 106.1 | 2.1 | 103.2 | 5.4 |
| 40 | 95.5 | 2.3 | 96.8 | 6.9 |
| 400 | 100.5 | 4.9 | 97.3 | 8.1 |
|
| ||||
| Brain | ||||
|
| ||||
| 3 | 98.7 | 6.5 | 94.2 | 7.3 |
| 40 | 101.3 | 6.8 | 105.5 | 9.2 |
| 200 | 93.4 | 7.2 | 100.1 | 9.8 |
Intra-day accuracy and CV were determined on 3 different days, and representative data from day 1 are shown.
Stability was evaluated in mouse plasma and brain homogenate to validate acceptable sample handling and storage conditions. The stability of LF-3-88 was determined by comparing the peak areas after storage with that of freshly prepared standard. LF-3-88 was stable (>96 %) for 24 h on the bench top at room temperature, stable for 3 weeks at 4 °C (>94 %) and stable for at least 3 weeks during storage at −80 °C (>93 %). The handling and storage conditions represent conditions under which samples might be handled on the bench top, the autosampler of UHPLC-MS-MS system, or in the freezer prior to analysis, respectively.
2.2 Pharmacokinetic analysis
After UHPLC-MS-MS method validation, the method was applied to the analysis of mouse plasma and brain tissues obtained at 7 time points after oral administration of LF-3-88. Concentration-over-time curves of LF-3-88 in plasma are shown in Figure 4, and concentration-over-time curves for brain tissues are shown in Figure 6. The calculated pharmacokinetics parameters are summarized in Tables 2 and 3. The Cmax values of LF-3-88 in mouse plasma were dose-dependent and were 263.7 ± 38.6 ng/mL and 548.9 ± 199.4 ng/mL for oral dosages of 5 mg/kg and 10 mg/kg, respectively. The plasma Tmax was 60 min after oral administration of either dosage of LF-3-88 suggesting rapid and non-saturable absorption into the systemic circulation. The half-lives of LF-3-88 in mouse plasma were similar, 70 min and 54 min, for dosages of 5 mg/kg and 10 mg/kg, respectively.
Figure 4.
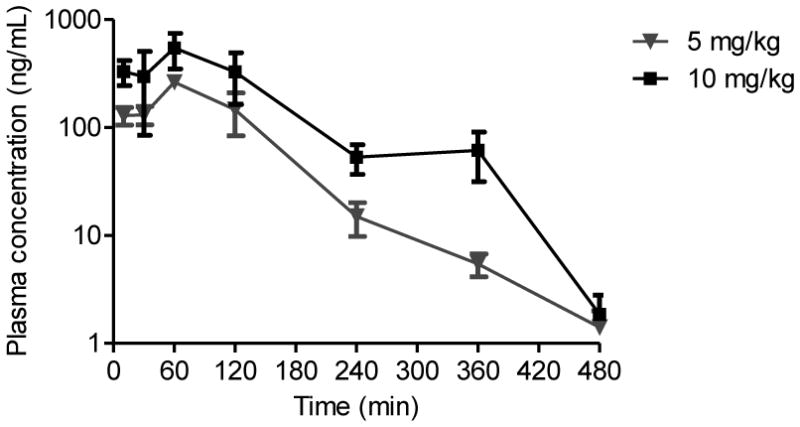
Plasma concentration-time profile of LF-3-88 after oral administration to mice.
Table 2.
Pharmacokinetic parameters of LF-3-88 in mouse plasma following oral administration.
| Dose (mg/kg) | Tmaxa (min) | Cmaxb (ng/mL) | T1/2c (min) | AUClastd (min*ng/mL) | AUCINFe (min*ng/mL) |
|---|---|---|---|---|---|
| 5 | 60 | 263.7 ± 38.6 | 70.0 ± 1.3 | 32860 ± 9230 | 33000 ± 9280 |
| 10 | 60 | 548.9 ± 199.4 | 53.8 ± 0.8 | 79290 ± 34230 | 79430 ± 34300 |
Tmax = time required to reach maximum concentration
Cmax = maximum concentration
T1/2 = half-life
AUClast = area under the curve from time zero to last quantifiable concentration
AUCINF = area under the curve from zero to infinite time
Table 3.
Pharmacokinetic parameters of LF-3-88 in mouse brain.
| Dose (mg/kg) | Tmax (min) | Cmax (ng/g) | T1/2 (min) | AUClast (min*ng/g) | AUCINF (min*ng/g) |
|---|---|---|---|---|---|
| 5 | 30 | 28.2 ± 6.5 | 183.6 ± 10.5 | 6100 ± 1120 | 7640 ± 1680 |
| 10 | 120 | 57.4 ± 15.7 | 178.8 ± 92.1 | 10830 ± 2770 | 12570 ± 4140 |
The levels of LF-3-88 in brain tissues showed that a substantial amount crossed the blood-brain barrier (BBB). The Cmax values of LF-3-88 in brain tissues were dose-dependent 28.2 ± 6.5 ng/g and 57.4 ± 15.7 ng/g following oral doses of 5 mg/kg and 10 mg/kg, respectively. The Tmax shifted from 30 min to 120 min when the dose was doubled suggesting that LF-3-88 might cross the BBB via transporters that became saturated at high dosage. BBB transport of LF-3-88 should be a subject of further investigation.
3. Conclusions
In this study, a fast, sensitive and accurate UHPLC-MS-MS method was developed and validated for the quantitative analysis of LF-3-88 in mouse plasma and brain tissues. The method was applied successfully to the measurement of samples from a pharmacokinetics study, which showed that LF-3-88 is absorbed rapidly following oral administration and readily crosses the BBB. No acute toxicity was observed in mice after single oral dosage of LF-3-88. Based on these data, LF-3-88, which is a highly selective α4β2-nAChRs partial agonist, has pharmacokinetics characteristics and BBB penetration properties that show promise for additional in vivo studies.
Figure 5.
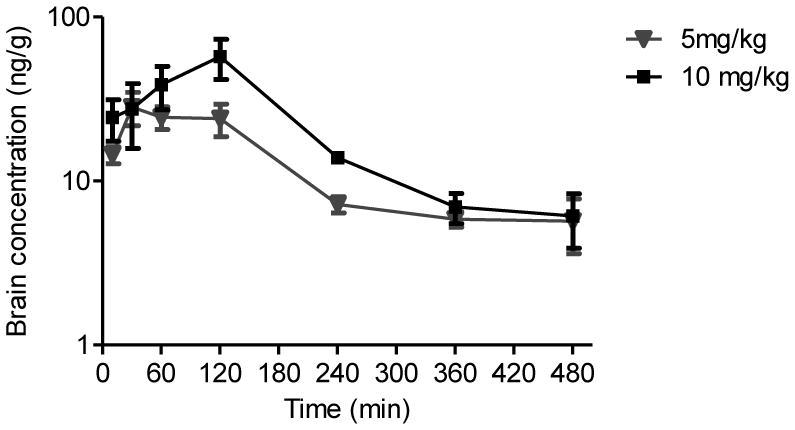
Brain homogenate concentration-time profile of LF-3-88 after oral administration to mice.
Highlights.
LF-3-88, a novel agonist of α4β2*-nAChRs, is being developed as an antidepressant.
A quantitative method based on UHPLC-MS-MS was developed and validated for LF-3-88.
LF-3-88 was measured in mouse plasma and brain tissue after oral administration.
Pharmacokinetics of LF-3-88 indicated good bioavailability and brain penetration.
Acknowledgments
This research was supported by Award Number U19MH085193 from the National Institute of Mental Health. The content is solely the responsibility of the authors and does not necessarily represent the official views of the National Institute of Mental Health or the National Institutes of Health. We thank PsychoGenics Inc. for supplying the plasma and brain samples, and we thank Shimadzu Corp. for providing the UHPLC-MS-MS system.
Footnotes
Publisher's Disclaimer: This is a PDF file of an unedited manuscript that has been accepted for publication. As a service to our customers we are providing this early version of the manuscript. The manuscript will undergo copyediting, typesetting, and review of the resulting proof before it is published in its final citable form. Please note that during the production process errors may be discovered which could affect the content, and all legal disclaimers that apply to the journal pertain.
References
- 1.Lukas RJ, Changeux JP, Le Novere N, Albuquerque EX, Balfour DJ, Berg DK, Bertrand D, Chiappinelli VA, Clarke PB, Collins AC, Dani JA, Grady SR, Kellar KJ, Lindstrom JM, Marks MJ, Quik M, Taylor PW, Wonnacott S. Pharmacol Rev. 1999;51:397. [PubMed] [Google Scholar]
- 2.McGehee DS, Heath MJ, Gelber S, Devay P, Role LW. Science. 1995;269:1692. doi: 10.1126/science.7569895. [DOI] [PubMed] [Google Scholar]
- 3.Mineur YS, Picciotto MR. Trends Pharmacol Sci. 2010;31:580. doi: 10.1016/j.tips.2010.09.004. [DOI] [PMC free article] [PubMed] [Google Scholar]
- 4.Caldarone BJ, Wang D, Paterson NE, Manzano M, Fedolak A, Cavino K, Kwan M, Hanania T, Chellappan SK, Kozikowski AP, Olivier B, Picciotto MR, Ghavami A. Psychopharmacology (Berl) 2011;217:199. doi: 10.1007/s00213-011-2271-y. [DOI] [PMC free article] [PubMed] [Google Scholar]
- 5.Shytle RD, Silver AA, Lukas RJ, Newman MB, Sheehan DV, Sanberg PR. Mol Psychiatry. 2002;7:525. doi: 10.1038/sj.mp.4001035. [DOI] [PubMed] [Google Scholar]
- 6.Caldarone BJ, Harrist A, Cleary MA, Beech RD, King SL, Picciotto MR. Biol Psychiatry. 2004;56:657. doi: 10.1016/j.biopsych.2004.08.010. [DOI] [PubMed] [Google Scholar]
- 7.Mineur YS, Somenzi O, Picciotto MR. Neuropharmacology. 2007;52:1256. doi: 10.1016/j.neuropharm.2007.01.006. [DOI] [PMC free article] [PubMed] [Google Scholar]
- 8.Yu LF, Tuckmantel W, Eaton JB, Caldarone B, Fedolak A, Hanania T, Brunner D, Lukas RJ, Kozikowski AP. J Med Chem. 2012;55:812. doi: 10.1021/jm201301h. [DOI] [PMC free article] [PubMed] [Google Scholar]
- 9.Zhang H, Tuckmantel W, Eaton JB, Yuen PW, Yu LF, Bajjuri KM, Fedolak A, Wang D, Ghavami A, Caldarone B, Paterson NE, Lowe DA, Brunner D, Lukas RJ, Kozikowski AP. J Med Chem. 2012;55:717. doi: 10.1021/jm201157c. [DOI] [PMC free article] [PubMed] [Google Scholar]
- 10.George TP, Sacco KA, Vessicchio JC, Weinberger AH, Shytle RD. J Clin Psychopharmacol. 2008;28:340. doi: 10.1097/JCP.0b013e318172b49e. [DOI] [PubMed] [Google Scholar]
- 11.Ruhe HG, Huyser J, Swinkels JA, Schene AH. J Clin Psychiatry. 2006;67:1836. doi: 10.4088/jcp.v67n1203. [DOI] [PubMed] [Google Scholar]
- 12.Philip NS, Carpenter LL, Tyrka AR, Price LH. Psychopharmacology (Berl) 2010;212:1. doi: 10.1007/s00213-010-1932-6. [DOI] [PMC free article] [PubMed] [Google Scholar]
- 13.Dunbar GC, Inglis F, Kuchibhatla R, Sharma T, Tomlinson M, Wamsley J. J Psychopharmacol. 2007;21:171. doi: 10.1177/0269881107066855. [DOI] [PubMed] [Google Scholar]
- 14.Philip NS, Carpenter LL, Tyrka AR, Whiteley LB, Price LH. J Clin Psychiatry. 2009;70:1026. doi: 10.4088/jcp.08m04441. [DOI] [PMC free article] [PubMed] [Google Scholar]
- 15.Liu J, Yu LF, Eaton JB, Caldarone B, Cavino K, Ruiz C, Terry M, Fedolak A, Wang D, Ghavami A, Lowe DA, Brunner D, Lukas RJ, Kozikowski AP. J Med Chem. 2011;54:7280. doi: 10.1021/jm200855b. [DOI] [PMC free article] [PubMed] [Google Scholar]
- 16.United States Food and Drug Administration. Guidance for Industry: Bioanalytical Method Validation. GPO; Washington: 2001. [Google Scholar]


