Abstract
Introduction
Complications of infection can increase burn-related morbidity and mortality. Early detection of burn wound infection could lead to more precise and effective treatment, reducing systemic complications and the need for long term, broad-spectrum intravenous antibiotics. Quantitative cultures from biopsies are the gold standard to determine infection. However, this methodology can take days to yield results and is invasive. This investigation focuses on the use of non-invasive imaging to determine the infection status of burn wounds in a controlled in-vivo model.
Methods
Full-thickness burn wounds were created on the dorsum of adult male rats (n=6). Twenty-four hours after burn wound creation, wounds in the “Infected” group were inoculated with a vehicle containing 1 × 10⁸ CFU Staphylococcus aureus. “Control” group animals received vehicle alone. Subsequently, the wounds were imaged daily for a total of 10 days and the differences of skin optical properties were assessed using a Spatial Frequency Domain Imaging (SFDI) at 16 different wavelengths from 500 nm to 700 nm. Regions of interest on the resulting images were selected and averaged at each time point.
Results
Statistically significant differences in average absorption and reduced scattering coefficients (μa and μs’) at 620 and 700 nm were observed between the two groups (p<0.05). Differential optical properties were most evident by day 4 and persisted throughout the time course.
Conclusions
Differential signature changes in optical properties are evident in infected burn wounds. This novel application of SFDI may prove to be a valuable adjunct to burn wound assessment. Further work will be aimed at determining dose-response relationships and prokaryotic species differences.
Keywords: Spatial Frequency Domain Imaging, burn wound infection, Staphylococcus aureus
Introduction
Complications resulting from infection in burn patients can cause drastic increases in morbidity and mortality [1, 2]. Local and systemic impacts may result from burn wound infections, including delayed healing, immune reactions, and shock [3]. Early intervention including bacteriostatic and bacteriocidal topical and systemic treatments can reduce these risks; however antibiotic treatment regimens must be carefully considered and chosen according to pathogen characteristics. Treating a bacterial infection at an inappropriate time or with a drug with a mode of action that is not suited for the pathogen can be detrimental and potentially result in a worse outcome than not treating at all [4]. Early diagnosis of pathogen presence and traits would allow for more tailored, appropriate antibiotic treatment regimens, however limitations exist in diagnostics available for determining burn wound infection status and type.
Currently, clinicians rely on quantitative cultures of wounds or blood, which involve swabs, biopsies, or blood draws. These methods are invasive and not ideal, as they can increase the trauma to the wound and cause discomfort for the patient. Furthermore, cultures may take 2-3 days to yield definitive results, allowing additional time for the pathogens to invade the host system.
Spatial Frequency Domain Imaging (SFDI) is a novel, non-invasive imaging technique used to calculate the quantitative optical properties, absorption coefficient μa and reduced scattering coefficient μs’, of a biological tissue. This technique was first successfully utilized by Cuccia et al. [5]. The goal of this study was to test the hypothesis that by applying this method to imaging infected and non-infected burn wounds in a controlled model system, infection status based on optical properties could be determined, thereby demonstrating a novel, non-invasive technique for assessing wound infections.
Materials and Methods
Burn Wound Infection Model
The MedStar Health Research Institute (MHRI) Institutional Animal Care and Use Committee (IACUC) reviewed and approved all described animal research. Animals were received and husbandry was provided according to facility standard operating procedures. Six male Sprague Dawley rats (Harlan Labs, Frederick, MD) were anesthetized and prepped as described previously [6].
Burn wounds were created on the dorsum of all animals, as described by Shupp et al. [6]. Briefly, custom milled aluminum branding irons with 2 cm by 2 cm base areas were heated to 100 °C. Irons were applied to the prepared skin for 12 seconds, using only the weight of the iron and no additional pressure, to create two paired wounds, each 1 cm away from the spine. Approximately 24 hours after burn wound creation, 3 animals received an inoculation, as described [6] with 200 μl of a vehicle containing 1 × 10⁸ CFU methicillin-resistant Staphylococcus aureus (MRSA) to both wounds, while the wounds of the remaining three animals were treated with culture broth alone (sham).
Experimental Design
Another 24 hours after inoculation, animals were anesthetized, weighed, placed on a warming blanket and monitored, and their right dorsal wound imaged using SFDI. These assessments under anesthesia were repeated daily for 9 more days. Biopsies (2 mm punch) were also taken for quantitative wound cultures from the left wound of each animal on days 0, 2, 5, 7, and 10, in order to preserve the right wound for imaging only.
Quantitative Cultures
Biopsies were weighed and homogenized in sterile saline using a LabGen Homogenizer (Omni International, Kennesaw, GA) with disposable, sterilized plastic probes. The homogenates were then serially diluted in sterile saline, with 100 μl of each dilution plated on Mannitol Salt Agar plates (BD, Franklin Lakes, NJ), selective for S. aureus. Plates were incubated at 37 °C until colony counts were performed 24 and 48 hours after plating. Counts (positive, yellow colonies only) were then used to calculate colony forming units per gram (CFU/g) for each biopsy. This method is described in Shupp et al. [6]. Means (CFU/g) were then calculated for wounds from infected animals (n=3) and non-infected animals (n=3) for each time point.
Spatial Frequency Domain Imaging
A Spatial Frequency Domain Imaging (SFDI) system was built to image infected and non-infected burn wounds daily in a ten day set. Imaging was conducted at sixteen different wavelengths from 500 nm to 700 nm. SFDI images were post-processed to calculate optical properties calculations that were then related to pathophysiology of the wounds. Differences of optical properties between two groups (infected and non-infected wounds) were assessed. The SFDI system was connected to a Laser Doppler Imaging (LDI) tool and constituted an integrated system shown in Figures 1A and 1B. The LDI system was used to measure blood perfusion in wounds of two groups of animals. The LDI results were then used, combined with SFDI results, to obtain a better understanding of patho-physiological changes in the wounds. In this study, results of LDI are not shown.
Figure 1.
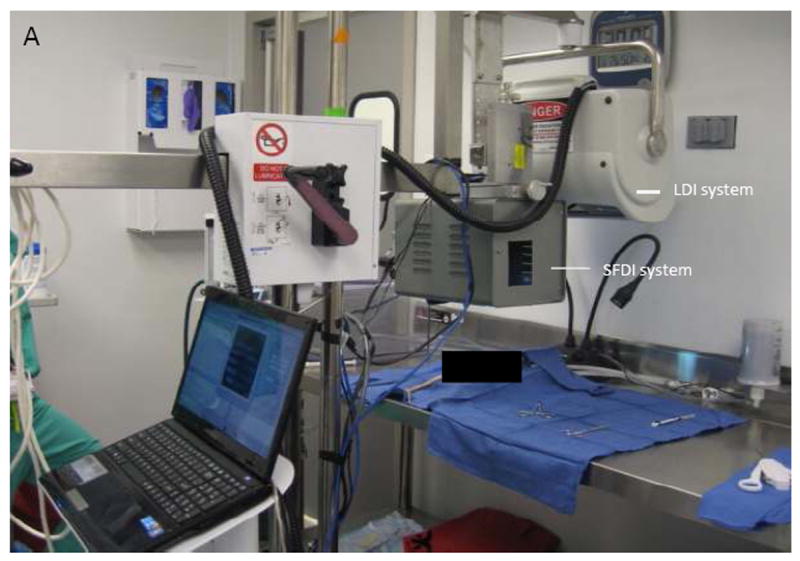
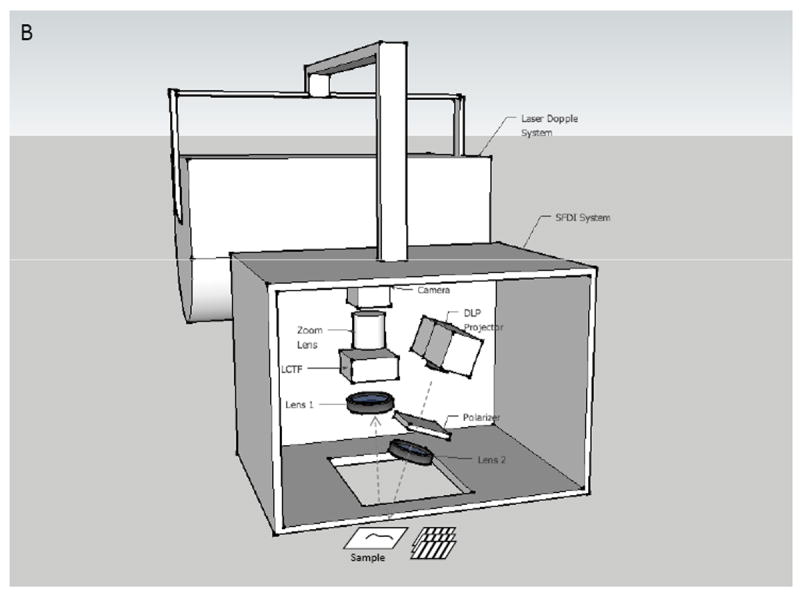
Experimental setup (A) and Schematic setup (B) of SFDI and LDI system.
In the system, a light source is modulated to project sinusoidal fringe patterns on a sample at three different phases (0, 2π/3, 4π/3) of a specific spatial frequency f (mm-1) and three images of diffuse reflected light from the sample are acquired (Figure 1B). A value of spatial frequency of f=0.2 mm-1 was selected to control the optical penetration depth of light into the skin. With this value, light can penetrate into the skin dermal layer (with penetration depth of approximately 700 μm). The optical properties of the skin are wavelength-dependent; in this work, sixteen wavelengths (500, 516, 529, 541, 545, 556, 560, 570, 577, 584, 588, 596, 620, 632, 650, and 700 nm) were utilized and a minimization algorithm was used to extrapolate specific metrics of interest from the calculated optical properties.
Optical property analysis
In order to determine optical properties at one wavelength, three images of the sample were acquired. The diffused reflectance at frequency zero Rd(0) and at frequency f Rd(f) were calculated. These components are the inputs to the Diffusion equation and are ultimately used to calculate μa and μs’. By scanning each pixel of the reflected image, entire two-dimensional maps of μa and μs’ can be reconstructed. More details of these calculation steps are described in a previous publication [7]. The SFDI system was calibrated with polyurethane diffusive phantoms mimicking tissue optical properties [8].
The achieved μa at different wavelengths can be utilized to determine relative amounts of tissue molecular components. Oxygenated hemoglobin, deoxygenated hemoglobin, melanin concentration, water, and met-hemoglobin are typical metrics of interest. In this study the maps of absorption coefficients of each wound at desired wavelengths were used to extract a map of oxygen saturation level (SO2) and a map of blood volume fraction (HB). A least square fitting method based on the Nelder-Mead simplex minimization algorithm [9] was applied to Equation (1) [10] and tabulated values of oxy- and deoxy-hemoglobin absorption coefficients μaHB and μaHB02 [10] were used to calculate values of SO2 and HB.
| (1) |
B represents HB volume fraction, S represents SO2 and C is a fixed offset that represents skin background absorption.
In this animal study, the absorption of water and met-hemoglobin are neglected because of their insignificant contribution in comparison with the absorption of the other chromophores (oxy- and deoxy-hemoglobin). Nevertheless, the absorption of melanin of rat skin is taken into account. The total absorption of the skin is the summation of the melanin absorption within the epidermal layer and the absorption of oxy- and deoxy-hemoglobin within the penetration depth of the light in the dermal layer.
Instrumentation
Our SFDI system included a DLP projector (1024 × 768, maximum contrast 2000:1). Two dimensional sinusoidal fringe patterns created with MATLAB (Natick, MA) were projected on the skin using a projection lens (f = 50 mm). Reflected light from the skin was captured by a monochromatic camera (1024 × 1024 pixels, CCD Genie Dalsa, The Netherlands) through an imaging zoom lens (f = 200 mm, Nikkon, Japan). A liquid crystal tunable filter (CRI, Woburn MA) was positioned in front of the camera and was computer controlled, allowing sequential selection of different wavelengths from 400nm to 700nm with a 7nm bandwidth. A pair of polarizers were assembled on the illumination arm and the receiving arm of our system and were crossed to each other to avoid skin specular reflection. All components were fixed into a light - tight enclosure. The entire imaging process was set up to run automatically on an area of 3 cm × 3 cm on the wounded skin.
Results
Quantitative Cultures
Wound biopsies from animals receiving bacterial inoculation had detectable levels of S. aureus growth starting on day 2 (24 hours after inoculation). The mean bacteria load peaked at 6.66 × 10¹³ CFU/g on day 5, and decreased, but remained at detectable levels until day 10 (Figure 2). Biopsies from animals receiving the sham (media alone) inoculation did not demonstrate a detectable level of S. aureus infection at any time point.
Figure 2.
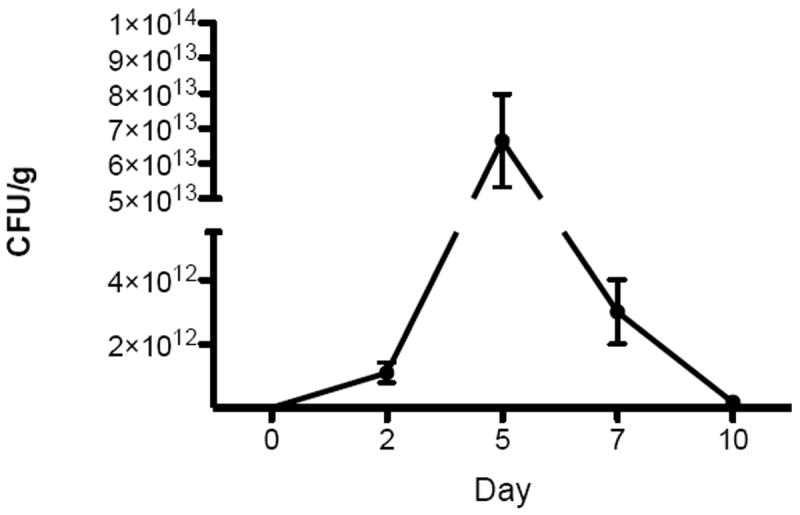
S. aureus growth in biopsies from infected wounds at 5 time points. Data shown are means (n=3) with error bars representing standard deviations.
SFDI
In order to assess differences between optical properties of the group of infected wounds (n=3) and the group of non-infected wounds (n=3), maps of optical properties (μa, μs’) of each wound were first reconstructed along sixteen wavelengths over twelve time points (before burn, immediately after burn, day 1 to day 10). To observe the same skin area throughout the twelve days, regions of interest (ROI) were selected in correlation with marks created on the skin on the first day using a black permanent marker. Short wavelengths below 620nm did not penetrate deep enough into the wounds and did not give any helpful information about μa and μs’. At longer wavelengths (620, 632, 650 and 700nm), reconstruction results of μa of both infected and non-infected wounds indicated a increasing trend along the time course, in most cases. Results of μs’ of all wounds seemed to increase during the first two days post-burn but started lowering from day 3 and continued in the same trend in the following days. Optical properties changed for all wounds but more significantly for infected wounds. In the imaging wound of one animal, an assumed fungal presence started appearing as white growth on day 5 and drastically scattered light. This infection was not considered in this analysis.
Mean values of absorption coefficients and scattering coefficients on all animals of each group were considered for statistical assessment. For every animal, average values of μa and μs’ of three selected viable regions on the wound were first calculated at each time point and each wavelength, avg-μa and avg-μs’. Figure 3 shows typical reconstruction maps of an infected wound with three selected regions (marked by three squares of white, black and red color) over twelve time points for absorption coefficient (A) and reduced scattering coefficient (B) at the wavelength of 700nm. The colorbars on the right hand side in Fig. 3A and Fig. 3B show the values of absorption coefficient and reduced scattering coefficient maps in the unit of mm-1.
Figure 3.
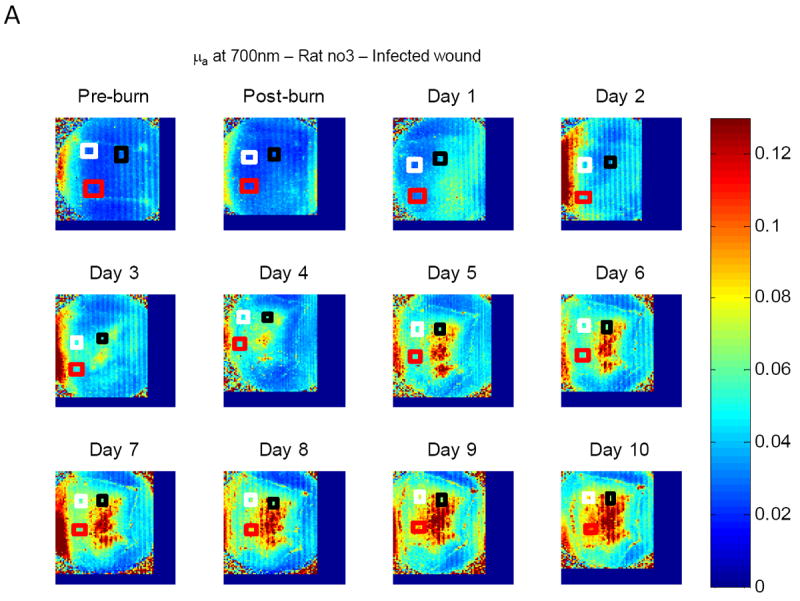
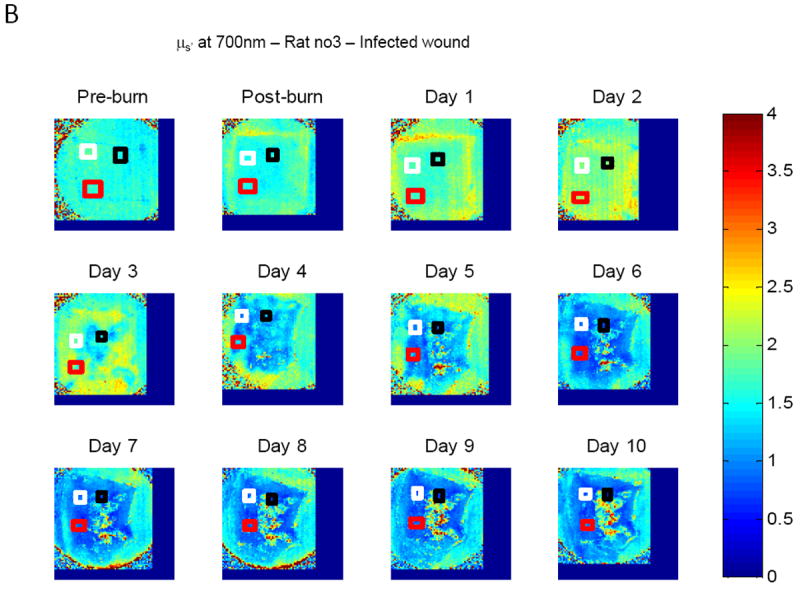
Typical reconstruction maps of an infected wound with three selected regions over twelve time points (before burn, immediately after burn, day 1 to day 10) for absorption coefficient (A) and scattering coefficient (B) at the wavelength of 700nm.
The mean of three avg-μa values, named mean-avg-μa, from 3 animals in the same group was calculated; a similar procedure was used to obtain a mean-avg-μs’. At every wavelength, mean-avg-μa as well as mean-avg-μs’ for twelve time points were obtained for the infected group and the non-infected group of animals. Values of standard error of the mean (SEM) of each group were also calculated. A comparison of μa and μs’ values between the two groups of wounds was then conducted by applying a statistical Student’s T-test. The results of absorption coefficient and reduced scattering coefficient showed that there is significant separation (p<0.05) between the two groups at the observed wavelengths starting at day 4 (Figure 4 and Table 1). SEMs of the two groups are also included. A comparison of mean value of μa and μs’ between the infected group and the non-infected group along the time course (pre-burn, post-burn, day 1 to day 10) is presented in Figure 4 (at wavelength 632nm) with p-values listed in Table 1. Similar behavior was noted for 650 nm and 700 nm data.
Figure 4.
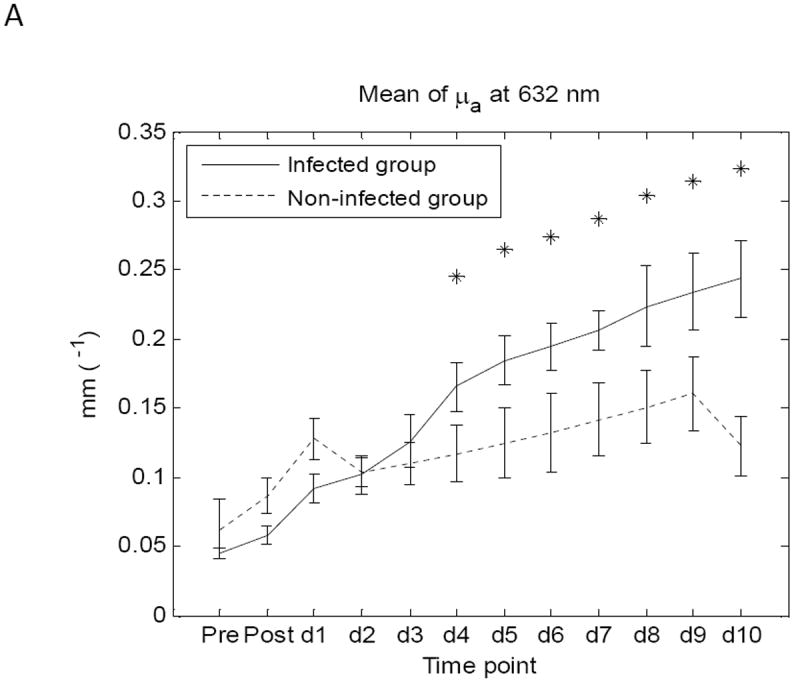

Comparison of mean values of μa (A) and μs’ (B) between infected group and non-infected group at wavelength 632nm. SEMs of the two groups are also included.
Table 1.
P-values of the comparisons of mean value of μa and μs’ between infected group and non-infected group at wavelength 620nm, 632nm, 650nm, 700nm (from day 4, values of p<0.05 are highlighted in gray color).
| Pre burn | Post burn | Day 1 | Day 2 | Day 3 | Day 4 | Day 5 | Day 6 | Day 7 | Day 8 | Day 9 | Day 10 | ||
|---|---|---|---|---|---|---|---|---|---|---|---|---|---|
| 620nm | μa | 0.21 | 0.01 | 0.02 | 0.71 | 0.29 | 0.02 | 0.01 | 0.02 | 0.01 | 0.02 | 0.02 | 0.00 |
| μs’ | 0.62 | 0.33 | 0.26 | 0.98 | 0.15 | 0.00 | 0.01 | 0.03 | 0.02 | 0.05 | 0.03 | 0.25 | |
| 632nm | μa | 0.22 | 0.00 | 0.02 | 0.82 | 0.40 | 0.02 | 0.00 | 0.01 | 0.00 | 0.02 | 0.02 | 0.00 |
| μs’ | 0.66 | 0.27 | 0.26 | 0.73 | 0.07 | 0.00 | 0.01 | 0.02 | 0.03 | 0.02 | 0.01 | 0.28 | |
| 650nm | μa | 0.34 | 0.02 | 0.01 | 0.80 | 0.23 | 0.04 | 0.01 | 0.02 | 0.01 | 0.02 | 0.01 | 0.00 |
| μs’ | 0.45 | 0.32 | 0.38 | 0.71 | 0.04 | 0.00 | 0.01 | 0.03 | 0.03 | 0.02 | 0.01 | 0.25 | |
| 700nm | μa | 0.18 | 0.05 | 0.00 | 0.90 | 0.08 | 0.10 | 0.04 | 0.01 | 0.00 | 0.03 | 0.00 | 0.00 |
| μs’ | 0.56 | 0.59 | 0.39 | 0.78 | 0.01 | 0.00 | 0.02 | 0.01 | 0.01 | 0.00 | 0.00 | 0.34 | |
The method described above was used to extract fold changes in SO2 and HB along the time span of the study in Figures 5 and 6. Values of SO2 and HB of each animal are average values of the three regions of interest previously selected. Figure 5 shows fold changes in mean values of SO2 level and values of SEM of the two groups at twelve time points. Similarly, figure 6 shows fold changes in mean values of HB and values of SEMs of the two groups at twelve time points.
Figure 5.
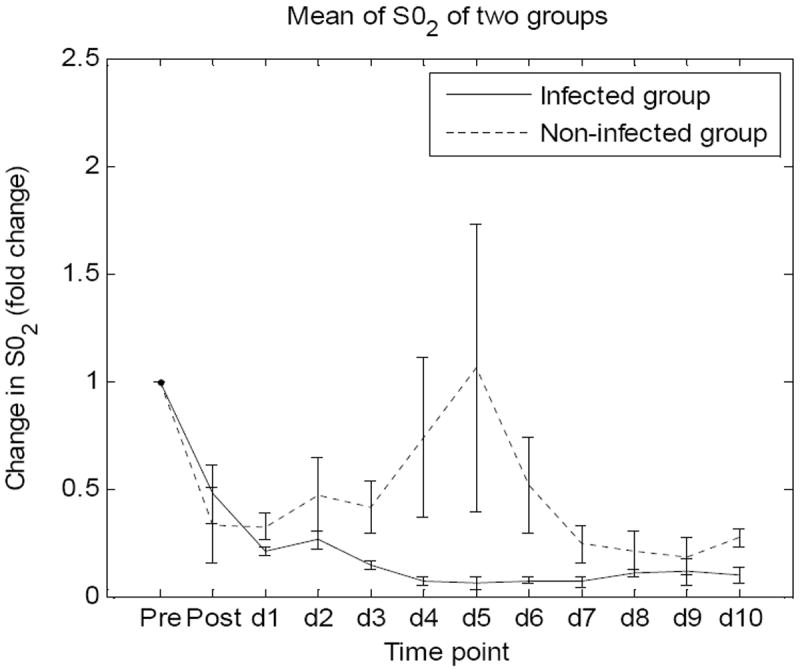
Fold changes in mean values of SO2 level and values of SEM of the two groups at twelve time points.
Figure 6.
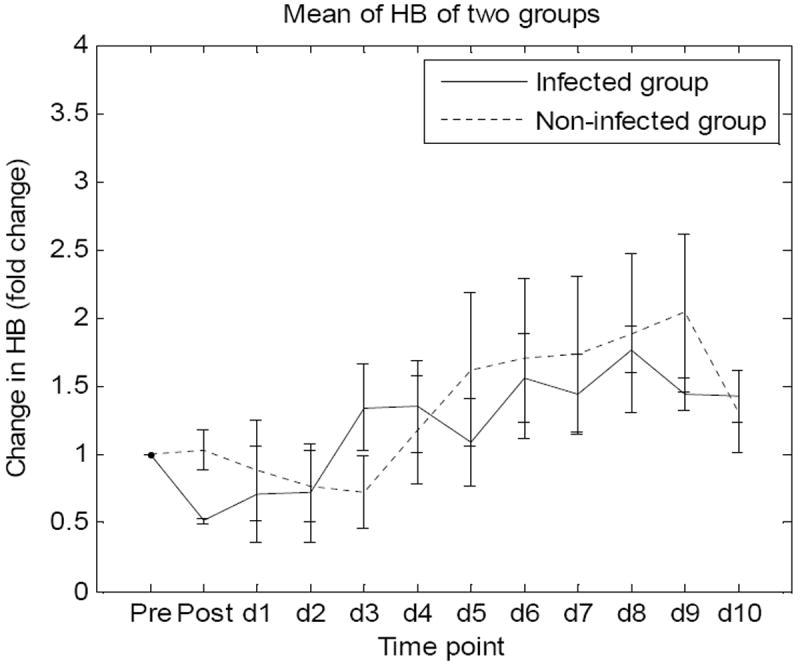
Fold changes in mean values of HB and SEMs of the two groups at twelve time points.
Discussion
A non-lethal burn wound infection animal model was successfully investigated over a ten-day time course. Spatial Frequency Domain Imaging was acquired daily in parallel with Laser Doppler imaging and biopsy collection. Optical properties of skin pre-burn and during 10 days post-burn in non-infected and infected wounds were assessed at 16 different wavelengths from 500 nm to 700 nm. Results at wavelengths above 620nm clearly showed the expected increase of absorption coefficient of the wounds as well as a decrease in scattering coefficient. Changes in infected wounds appeared more dramatically than in non-infected wounds. Statistically significant differences in average absorption and reduced scattering coefficients at 620, 632, 650 and 700 nm were observed between the two groups with p<0.05.
Blood volume fraction fluctuated in all animals without showing a particular trend for each group but seemed to increase with both groups in following the burn event. This result indicates hematocrit increase in the wounds. The change in hematocrit probably resulted from an increase in moving red blood cells, which could be observed in the LDI results. These results (not shown in this paper) indicated that blood perfusion of the non-infected group was higher than the infected group from day 4 and kept increasing in the following days. Higher blood volume fraction as well as blood perfusion appeared in the non-infected wounds compared to infected wounds. Higher oxygen concentration being carried by hemoglobin to the non-infected wounds may be expected. This was observed in our oxygen saturation results. Calculated mean value of oxygen saturation (SO2) increased in the non-infected group, but remained unchanged in the infected group.
All changes in skin properties were most evident by day 4 and persisted throughout the time course. The differential changes that occurred between the two groups indicated a recognizable sign of infection and a possible method to separate non-infected and infected wounds. Results at different wavelengths contained information about different layers in the wounds. Wavelengths shorter than 620nm were mostly absorbed by the superficial layers of the skin and did not provide useful information. This is probably due to post-burn eschar developing in the top layer of the skin.
We believe that the results of our analysis will help in the diagnosis of the infection status of a wound. This novel application of SFDI may prove to be a valuable adjunct to burn wound assessment. Future work with increased sample size will be aimed at determining dose-response relationships and prokaryotic species differences along with in vitro spectral analysis.
References
- 1.Shurland S, et al. Comparison of mortality risk associated with bacteremia due to methicillin-resistant and methicillin-susceptible Staphylococcus aureus. Infect Control Hosp Epidemiol. 2007;28(3):273–9. doi: 10.1086/512627. [DOI] [PubMed] [Google Scholar]
- 2.Branski LK, et al. Emerging infections in burns. Surg Infect (Larchmt) 2009;10(5):389–97. doi: 10.1089/sur.2009.024. [DOI] [PMC free article] [PubMed] [Google Scholar]
- 3.Kaiser ML, et al. Epidemiology and risk factors for hospital-acquired methicillin-resistant Staphylococcus aureus among burn patients. J Burn Care Res. 2011;32(3):429–34. doi: 10.1097/BCR.0b013e318217f92d. [DOI] [PubMed] [Google Scholar]
- 4.Schlievert PM, Kelly JA. Clindamycin-induced suppression of toxic-shock syndrome--associated exotoxin production. J Infect Dis. 1984;149(3):471. doi: 10.1093/infdis/149.3.471. [DOI] [PubMed] [Google Scholar]
- 5.Cuccia DJ, et al. Quantitation and mapping of tissue optical properties using modulated imaging. J Biomed Opt. 2009;14(2):024012. doi: 10.1117/1.3088140. [DOI] [PMC free article] [PubMed] [Google Scholar]
- 6.Shupp JW, et al. Oxazolidinone Antibiotic Treatment Inhibits Virulence Factor Production in MRSA-Infected Burn Wounds. 2012 doi: 10.1097/BCR.0b013e318280e35a. [DOI] [PubMed] [Google Scholar]
- 7.Nguyen TTA, et al. Assessment of the pathophysiology of injured tissue with an in vivo electrical injury model. IEEE J Quantum Electron. 2012;4 [Google Scholar]
- 8.Moffitt T, et al. Preparation and characterization of polyurethane optical phantoms. J Biomed Opt. 2006;11(4):041103. doi: 10.1117/1.2240972. [DOI] [PubMed] [Google Scholar]
- 9.Nelder JA, Mead R. A Simplex Method for Function Minimization. The Computer Journal. 1965;7(4):308–313. [Google Scholar]
- 10.Jacques SL. Spectroscopic determination of tissue optical properties using optical fiber spectrometer. [Online]. Available: http://omlc.ogi.edu/news/apr08/skinspectra/index.html.


